School of Industrial and Information Engineering
Master of Science in Management Engineering
Supervisor: Prof. Alessandro Perego
Tutors: Ing. Valentina Pontiggia
Dott. Elisabetta Puglielli
Master Thesis of:
Lidia Giulia Mazzesi 927659
Mattia Oneto
913371
Academic Year 2019/2020
Beyond the Retail Apocalypse: data-driven
modelling based on an econometric analysis
Acknowledgements
It’s not even a year since we started this dissertation, but the world seems a completely different place now. Nobody could have predicted what happened, and we certainly would have never imagined writing our thesis in such a troubled historic period. The wounds of Covid-19 will not be easy to heal. In our small, sometimes we had to face problems and difficult moments; however, mutual support and encouragement were fundamental.
We would like to express our sincere gratitude to our tutors, Ing. Valentina Pontiggia and Dott. Elisabetta Puglielli, whose expertise and competences were invaluable in formulating the research questions and methodology. They steered us in the right path, and they were always ready to help whenever we had questions or doubts about our work. Moreover, we appreciated being involved in the activities of the Osservatorio Innovazione Digitale nel Retail and Osservatorio eCommerce B2C research team, which assisted us in gathering the necessary data. We are also grateful to Dott. Giorgia Sali, which was so kind in supporting us with Statistics and Econometry.
We would also like to thank our supervisor, prof. Alessandro Perego, who is one of the minds behind the wonderful project of Osservatori Digital Innovation.
A special thanks goes to our loved ones, which always cheered, supported and believed in us through our academic journey.
Finally, we would like to thank each other for these months of dedication, mutual encouragement and laughs. It won’t be easy to say goodbye to this collaboration.
These pages that you are going to read may seem a bit cold, full of math and charts. Nevertheless, the fil rouge connecting all the dots are the individuals.
Customer centricity, after all, is all about putting people before everything else.
Thank you, Lidia and Mattia
Table of Contents
ACKNOWLEDGEMENTS ... 3
ABSTRACT (ENGLISH VERSION) ... 9
ABSTRACT (VERSIONE ITALIANA)... 9
1 EXECUTIVE SUMMARY... 1
RESEARCH INTRODUCTION... 1
OBJECTIVES &RESEARCH QUESTIONS... 1
RESEARCH METHODOLOGY ... 2
RESEARCH FINDINGS &CONCLUSIONS ... 8
2 INTRODUCTION ... 15
3 THE SCIENTIFIC LITERATURE REVIEW ... 17
METHODOLOGY ... 18
3.1.1 Scope of the analysis ... 18
3.1.2 Scientific Literature Process ... 18
LITERATURE ANALYSIS ... 20
3.2.1 Focus ... 23
3.2.2 Methodology ... 27
3.2.3 Market dimensions: Nationality, Sector, Retail Size ... 29
EXOGENOUS FACTORS ... 33 3.3.1 Digital... 33 3.3.2 Macroeconomic ... 35 3.3.3 Competition ... 37 3.3.4 Commercial Distribution... 40 3.3.5 Synergies ... 41 3.3.6 Customer-Based ... 42 ENDOGENOUS FACTORS ... 46 3.4.1 Products ... 46 3.4.2 HR-Based ... 47 3.4.3 Strategic ... 50 3.4.4 Technology-based... 51 IMPACTS ... 52 3.5.1 Quantitative Impacts ... 53 3.5.2 Qualitative Impacts ... 55
3.5.3 Value Chain (organizational, physical store, channel mix) ... 56
SCIENTIFIC LITERATURE WRAP-UP... 67
4 THE NON-SCIENTIFIC LITERATURE REVIEW... 68
LITERATURE ANALYSIS ... 68
EXOGENOUS FACTORS ... 71
ENDOGENOUS FACTORS ... 75
IMPACTS ... 76
NON-SCIENTIFIC LITERATURE OUTCOMES... 82
5 GAP IDENTIFICATION ... 82 6 DATA GATHERING ... 84 METHODOLOGY ... 84 6.1.1 Countries ... 84 6.1.2 Sectors ... 85 6.1.3 Retailers ... 87 EXOGENOUS FACTORS ... 95 6.2.1 Country ... 95 6.2.2 Sector ... 99 ENDOGENOUS FACTORS ... 106 6.3.1 Technologies... 106
6.3.3 Points of Sale ... 114 6.3.4 Formats ... 116 6.3.5 Omnicanality ... 117 6.3.6 Channels ... 119 IMPACTS ... 123 6.4.1 Quantitative Impacts ... 124 6.4.2 Qualitative Impacts ... 139 7 STATISTICAL ANALYSIS... 140 DATA TRANSFORMATION ... 141 DATA EXPLORATION ... 143 DATA ANALYSIS ... 148 7.3.1 Correlation Test ... 149 7.3.2 T-test ... 150 7.3.3 ANOVA Test ... 152 7.3.4 Chi-squared Test ... 155 8 ECONOMETRIC ANALYSIS ... 156 THEORETICAL INTRODUCTION ... 156
8.1.1 Choosing the dependent variables ... 160
8.1.2 Choosing the independent variables ... 160
8.1.3 Assumptions testing ... 162
REVENUES REGRESSION MODEL ... 167
8.2.1 Variables ... 168
8.2.2 Coefficients Intepretation ... 175
STORE CLOSURES REGRESSION MODEL ... 179
8.3.1 Variables choice ... 180
8.3.2 Coefficient interpretation ... 187
9 THE INTERPRETATIVE MODEL ... 192
INTRODUCTION ... 192
THE ROADMAP FOR RETAILERS ... 195
9.2.1 Decision Making Dimensions... 195
9.2.2 Business Guidelines... 197
10 THE IMPACT OF COVID-19 SANITARY EMERGENCY ... 201
11 LIMITATIONS & FUTURE RESEARCH ... 205
12 CONCLUSIONS ... 207
13 BIBLIOGRAPHY ... 210
LITERATURE ... 210
DATABASE ... 215
ANNEX ... 225
REVENUES REGRESSION MODEL ... 225
List of Figures
FIGURE 1.1:RESEARCH METHODOLOGY ... 2
FIGURE 1.2:MULTIPLE LINEAR REGRESSION MODEL PROCESS ... 7
FIGURE 1.3:DECISION DIMENSIONS... 12
FIGURE 1.4:MARKET CONDITIONS AND BUSINESS FOCUS ... 12
FIGURE 1.5:ROADMAP FOR SUCCESSFUL TRANSITION TO OMNICHANNEL RETAILING ... 13
FIGURE 3.1:LITERATURE ANALYSIS FOCUSES ... 17
FIGURE 3.2:FOCUSES OF THE LITERATURE ANALYSIS WITH PAPERS DIVISION ... 23
FIGURE 4.1:THE IN-STORE VS ONLINE GROCERY CONVENIENCE GAP ... 81
FIGURE 8.1:MULTIPLE LINEAR REGRESSION MODEL PROCESS ... 159
FIGURE 8.2:NON-LINEAR REGRESSION MODEL PROCESS ... 159
FIGURE 8.3:OMITTED VARIABLES CONDITION ... 161
FIGURE 8.4:REVENUES REGRESSION SUMMARY ... 191
FIGURE 8.5:STORE CLOSURES REGRESSION SUMMARY ... 191
FIGURE 9.1:DECISION DIMENSIONS... 196
FIGURE 9.2:MARKET CONDITIONS AND BUSINESS FOCUS ... 197
FIGURE 9.3:ROADMAP FOR SUCCESSFUL TRANSITION TO OMNICHANNEL RETAILING ... 198
List of Charts
CHART 3.1:METHODOLOGIES ... 27CHART 3.2:NUMBER OF QUANTITATIVE PAPERS ... 28
CHART 3.3:NUMBER OF QUALITATIVE PAPERS ... 28
CHART 3.4:ALLOCATION OF RETAILERS' NATIONALITY OF THE CONDUCTED RESEARCH ... 29
CHART 3.5:ALLOCATION OF SECTOR SPECIFICITY OF THE CONDUCTED RESEARCH ... 31
CHART 3.6:NUMBER OF SCIENTIFIC PAPERS BY RETAIL SIZE... 32
CHART 3.7:PERCENTAGE OF SCIENTIFIC PAPERS ADDRESSING DIGITAL DRIVERS... 35
CHART 3.8:PERCENTAGE OF SCIENTIFIC PAPERS ADDRESSING DIGITAL COMPETITION DRIVERS... 37
CHART 3.9:PERCENTAGE OF SCIENTIFIC PAPER ADDRESSING COMMERCIAL DISTRIBUTION DRIVERS ... 41
CHART 3.10:PERCENTAGE OF SCIENTIFIC PAPERS ADDRESSING CUSTOMER-BASED DRIVERS ... 45
CHART 3.11:PERCENTAGE OF SCIENTIFIC PAPERS ADDRESSING PRODUCT DRIVERS ... 46
CHART 3.12:PERCENTAGE OF SCIENTIFIC PAPERS ADDRESSING HR-BASED DRIVERS ... 47
CHART 3.13:PERCENTAGE OF SCIENTIFIC PAPERS ADDRESSING STRATEGIC DRIVERS ... 50
CHART 3.14:PERCENTAGE OF SCIENTIFIC PAPERS ADDRESSING TECHNOLOGY-BASED VARIABLES ... 51
CHART 3.15:PERCENTAGE OF SCIENTIFIC PAPERS ADDRESSING QUANTITATIVE PERFORMANCE VARIABLES ... 53
CHART 3.16:PERCENTAGE OF SCIENTIFIC PAPERS ADDRESSING QUALITATIVE PERFORMANCE VARIABLES ... 55
CHART 3.17:PERCENTAGE OF SCIENTIFIC PAPERS ADDRESSING ORGANIZATIONAL VARIABLES ... 56
CHART 3.18:VARIATION OF RETAIL EMPLOYMENT ... 57
CHART 3.19:PERCENTAGE OF SCIENTIFIC PAPER ADDRESSING PHYSICAL STORE VARIABLES ... 59
CHART 3.20:PERCENTAGE OF SCIENTIFIC PAPERS ADDRESSING CHANNEL MIX VARIABLES ... 63
CHART 3.21:PERCENTAGE OF SCIENTIFIC PAPERS ADDRESSING OTHER IMPACTS... 66
CHART 4.1:PERCENTAGE OF PAPERS BY METHODOLOGY ... 68
CHART 4.2:QUALITATIVE PAPERS BY METHODOLOGY USED ... 68
CHART 4.3:ALLOCATION OF RETAILERS' NATIONALITY OF THE CONDUCTED RESEARCH ... 69
CHART 4.4:ALLOCATION OF SECTOR SPECIFICITY OF THE CONDUCTED RESEARCH ... 70
CHART 4.5:NUMBER OF NON-SCIENTIFIC PAPERS BY RETAIL SIZE ... 70
CHART 4.6:PERCENTAGE OF EXOGENOUS FACTORS MENTIONS IN THE REPORTS ... 71
CHART 4.7:PERCENTAGE OF NON-SCIENTIFIC PAPERS ADDRESSING DIGITAL DRIVERS ... 71
CHART 4.8:PERCENTAGE OF NON-SCIENTIFIC PAPERS ADDRESSING DIGITAL COMPETITION DRIVERS ... 72
CHART 4.9:PERCENTAGE OF SCIENTIFIC PAPERS ADDRESSING PRODUCT DRIVERS ... 74
CHART 4.10:PERCENTAGE OF ENDOGENOUS FACTORS MENTIONS IN THE REPORTS ... 75
CHART 4.11:PERCENTAGE OF IMPACTS MENTIONS IN THE REPORTS ... 76
CHART 4.12:PERCENTAGE OF NON-SCIENTIFIC PAPERS ADDRESSING QUANTITATIVE PERFORMANCE VARIABLES ... 77
CHART 4.13:PERCENTAGE OF NON-SCIENTIFIC PAPERS ADDRESSING QUALITATIVE PERFORMANCE VARIABLES ... 78
CHART 4.14:PERCENTAGE OF NON-SCIENTIFIC PAPERS ADDRESSING ORGANIZATIONAL VARIABLES ... 79
CHART 4.15:PERCENTAGE OF NON-SCIENTIFIC PAPERS ADDRESSING PHYSICAL STORE VARIABLES... 79
CHART 6.1:AVERAGE TIME TO START A BUSINESS IN THE SELECTED COUNTRIES ... 96
CHART 6.2: ECOMMERCE PENETRATION PER COUNTRY (2017) ... 97
CHART 6.3: ECOMMERCE GROWTH IN EACH COUNTRY (2018-2019) ... 97
CHART 6.4:DESI INDEX -2018 ... 98
CHART 6.5:PERCENTAGE OF TURNOVER PER SECTORS BY COUNTRY ... 101
CHART 6.6:PERCENTAGE OF EMPLOYEES PER SECTORS BY COUNTRY ... 102
CHART 6.7:PERCENTAGE OF ENTERPRISES PER SECTORS BY COUNTRY... 103
CHART 6.8: ECOMMERCE PENETRATION BY SECTOR ... 105
CHART 6.9:BACK-END TECHNOLOGIES DIFFUSION ... 107
CHART 6.10:FRONT-END TECHNOLOGIES DIFFUSION ... 109
CHART 6.11:EDGE TECHNOLOGIES DIFFUSION... 111
CHART 6.12:PERCENTAGE OF CHIEF OFFICERS TYPES ... 113
CHART 6.13:EMPLOYEES DEVELOPMENT PROGRAMS CLASSIFICATION ... 114
CHART 6.14:DEGREE OF INTERNATIONALISATION CLASSIFICATION ... 114
CHART 6.15:AVERAGE STORE SIZE CLASSIFICATION ... 115
CHART 6.16:TYPES OF STORE FORMAT DIFFUSION ... 117
CHART 6.17:OMNICHANNEL BUSINESS MODELS DIFFUSION ... 118
CHART 6.18:ONLINE CHANNELS DIFFUSION ... 120
CHART 6.19:PERCENTAGE OF TOTAL NUMBER OF ONLINE CHANNELS PER RETAILER ... 122
CHART 6.20:INSTAGRAM FOLLOWERS AND RELATIONSHIP WITH SOCIAL COMMERCE ... 123
CHART 6.21:SALES GROWTH PER SECTOR ... 124
CHART 6.22:REVENUES PER SQUARE METER,GROCERY RETAILERS ... 126
CHART 6.23:EBITDAMARGIN FOR SELECTED U.S.RETAILERS ... 127
CHART 6.24:GROSS MARGIN BY SECTOR ... 128
CHART 6.25:OPERATING PROFIT MARGIN BY SECTOR... 129
CHART 6.26:GROSS PROFIT MARGIN AND OPERATING PROFIT MARGIN FOR SELECTED U.K.RETAILERS... 130
CHART 6.27:ROS AND ROA FOR SELECTED BELGIUM RETAILERS ... 131
CHART 6.28:ROIC BY SECTOR ... 132
CHART 6.29:ROIC FOR SELECTED FRANCE RETAILERS ... 133
CHART 6.30:ROE BY SECTOR ... 134
CHART 6.31:NET PROFIT MARGIN BY SECTOR ... 135
CHART 6.32: ECOMMERCE PENETRATION FOR SELECTED FRANCE RETAILERS ... 135
CHART 6.33:NUMBER OF CLOSED STORES BETWEEN 2017-2018 AND 2018-2019 FOR SELECTED RETAILERS ... 136
CHART 6.34:NET PROMOTER SCORE CLASSIFICATION ... 139
CHART 7.1:HISTOGRAM AND BOXPLOT OF THE YEAR OF FOUNDATION ... 143
CHART 7.2:HISTOGRAM NUMBER OF EMPLOYEES ... 146
CHART 8.1ORDINARY LEAST SQUARE METHOD REPRESENTATION ... 157
CHART 8.2:CURVE ESTIMATION CHART ... 171
CHART 8.3:RESIDUAL PLOT REGRESSION REVENUES... 174
CHART 8.4:RESIDUAL PLOT REGRESSION STORE CLOSURES ... 185
CHART 8.5:QUADRATIC RELATIONSHIPS ... 190
List of Tables
TABLE 1.1:DATABASE STRUCTURE:ENDOGENOUS FACTORS ... 4TABLE 1.2:DATABASE STRUCTURE:EXOGENOUS FACTORS ... 5
TABLE 3.1:CLASSIFICATION OF ACADEMIC PAPERS... 19
TABLE 3.2:ACADEMIC PAPERS GENERIC INFORMATION ... 20
TABLE 3.3:LITERATURE DATABASE STRUCTUR ... 21
TABLE 3.4:LITERATURE DATABASE STRUCTUR ... 22
TABLE 3.5:PAPERS ADDRESSING IMPACTS ... 24
TABLE 3.6:PAPERS ADDRESSING RETAIL ONLY ... 24
TABLE 3.7:CONVERGENCE BETWEEN STORE FORMATS BY MACRO PARAMETERS ... 61
TABLE 3.8:KPIS TO MEASURE THE SUSTAINABILITY OF THE RETAILER WITHIN THE SUPPLY CHAIN ... 65
TABLE 6.1:SELECTED RETAILERS FOR THE DATA GATHERING (PT.1) ... 88
TABLE 6.2:SELECTED RETAILERS FOR THE DATA GATHERING (PT.2) ... 89
TABLE 6.3:SELECTED RETAILERS FOR THE DATA GATHERING (PT.3) ... 90
TABLE 6.4:DATABASE STRUCTURE -ENDOGENOUS FACTORS ... 92
TABLE 6.5:DATABASE STRUCTURE -EXOGENOUS FACTORS ... 93
TABLE 6.7:MACROECONOMIC FACTOR ... 95
TABLE 6.8:RETAIL INDUSTRY DATA PER COUNTRY ... 98
TABLE 7.1:DATASET DESCRIPTIVE STATISTICS ... 145
TABLE 7.2:DESCRIPTIVE STATISTICS OF FACTORS (CATEGORICAL VARIABLES) ... 147
TABLE 7.3:DESCRIPTIVE STATISTICS OF IMPACTS ... 148
TABLE 7.4:TECHNOLOGIES CORRELATION MATRIX ... 150
TABLE 7.5:MARGINS CORRELATIONS MATRIX ... 150
TABLE 7.6:NPSONE-SAMPLE T-TEST ... 150
TABLE 7.7:BACK-END TECH (SUPPLY CHAIN) VS OPERATING MARGIN INDEPENDENT T-TEST ... 151
TABLE 7.8:BACK-END TECH (TRACKING TECH.) VS OPERATING MARGIN INDEPENDENT T-TEST ... 152
TABLE 7.9:IN-STORE TECH. VS OPERATING MARGIN INDEPENDENT T-TEST ... 152
TABLE 7.10:ANOVA TEST %COUNTRY OF ORIGIN OF THE SECTORS ... 153
TABLE 7.11:ANOVA TEST %COUNTRY OF ORIGIN OF THE COUNTRIES ... 154
TABLE 7.12:ANOVA ECOMMERCE PENETRATION IN THE SECTORS ... 154
TABLE 7.13:CHI-SQUARE TEST, LEADERSHIP PROGRAMS AND TRAINING PROGRAMS ... 155
TABLE 8.1:PRINCIPAL COMPONENT ANALYSIS ... 169
TABLE 8.2:ROTATED COMPONENT MATRIX ... 170
TABLE 8.3:CURVE ESTIMATION ... 171
TABLE 8.4:REVENUES REGRESSION MODEL VARIABLES ... 172
TABLE 8.5:REGRESSION COEFFICIENTS... 173
TABLE 8.6:MULTICOLLINEARITY TEST... 174
TABLE 8.7:STORE CLOSURES REGRESSION MODEL VARIABLES... 183
TABLE 8.8:STORE CLOSURE REGRESSION RESULTS ... 184
TABLE 8.9:STORE CLOSURE REGRESSION COEFFICIENTS ... 184
TABLE 8.10:UNSTANDARDIZED VARIABLES REGRESSION COEFFICIENTS ... 186
TABLE 8.11:STANDARDISED VARIABLES MULTICOLLINEARITY TESTS ... 187
ANNEX
ANNEX A:REVENUES HISTOGRAM ... 225ANNEX B:REVENUES LOGARITHM HISTOGRAM... 225
ANNEX C:PARTIAL REGRESSION PLOTS REVENUES... 226
ANNEX D:NORMALITY PLOT ERROR TERMS REVENUES ... 227
ANNEX E:PARTIAL REGRESSION PLOTS STORE CLOSURES ... 228
ANNEX F:HETEROSKEDASTICITY TESTS ... 229
ANNEX G:NORMALITY PLOT ERROR TERMS STORE CLOSURES ... 229
ABSTRACT (English Version)
Since 2015, Retail industry has been suffering from the so-called Retail Apocalypse, a crisis that consists in the closure of many points of sales and the bankruptcy of large established chains. This phenomenon originated in the United States and now is spreading rapidly in Europe. Which are the factors behind it? Are they country-related, or are they due to some specific sectors or to peculiar characteristics of the players? Is eCommerce the main responsible of the crisis? The objective of this thesis is to identify the drivers that are influencing Retailers' performances and the Impacts that they are generating. For this reason, an extensive Literature Analysis was conducted to identify and select the most relevant variables. Afterwards, a cross-sectional Dataset was built, made of Retailers of different Sectors from the main European countries and from the United States, analysed from multifaceted perspectives. Data were explored and examined in order to understand the most important relationships between them, indeed two multiple linear regression models were developed to discern the root causes of the stores closure and of the success of those Retailers who are navigating through the crisis. Ultimately, this study led to the generation of a Model which first outlines the main Decision Dimensions a Retailer should consider in developing its strategy and then frameworks the Business Guidelines and the Roadmap for successful transition to the future of Retailing.
ABSTRACT (Versione Italiana)
A partire dal 2015, il settore Retail ha sofferto l’avvento della cosiddetta “Retail Apocalypse”, una crisi che si sta manifestando attraverso la chiusura di molti punti vendita e la bancarotta di grandi catene affermate. Questo fenomeno ha avuto origine negli Stati Uniti e si è poi rapidamente diffuso anche in Europa. Quali sono i fattori che lo hanno generato? Sono legati alle condizioni delle singole nazioni, o connessi a specifici settori, o a caratteristiche peculiari di alcune aziende del mondo della grande distribuzione organizzata? Si può ritenere l’eCommerce il principale responsabile della crisi? L’obiettivo di questa tesi è quello di individuare gli elementi chiave che stanno influenzando le aziende e gli effetti che stanno generando. A tal fine è stata condotta un’esauriente analisi della letteratura che ha permesso di identificare e selezionare le variabili più rilevanti. Successivamente, è stato creato un dataset di tipo cross-sectional composto da Retailer con sede principali nazioni europee e negli Stati Uniti, provenienti da settori differenti e analizzati da molteplici prospettive. I dati sono stati esplorati e analizzati per comprenderne le relazioni più importanti, e sono stati sviluppati due modelli di regressione lineare multipla per discernere le cause alla radice delle chiusure e del successo di quei Retailer che invece stanno sopravvivendo alla crisi. In conclusione, questo studio ha portato alla generazione di un modello che innanzitutto delinea le principali dimensioni decisionali che un Retailer dovrebbe considerare nello sviluppare la sua strategia e, successivamente, presenta delle linee guida e una mappa per la transizione verso il futuro del Retail.
1 EXECUTIVE SUMMARY
Research Introduction
Retail is intended as the business activity of selling products or services to customers. Among the reasons of the existence of Retailers as the last stop of the supply chain there is their ability to exploit economies of scale and scope, as well as the possibility to engage clients by offering a unique customer experience, with a huge variety of products by many different brands or manufacturers. Since the dawn of history, Retailing has always involved customers purchasing directly from a point of sale, usually managed by the Retail company. In the last few years, digital transformation has been causing an unprecedented and radical change in this industry, generating new business models and a huge shift in the behaviour of customers. Since 2015, a crisis known as Retail Apocalypse has struck the industry, leading to the closure of many stores and to the failure of large and established Retail chains. The phenomenon started in the US and then spread rapidly to Europe, even though with less severe effects. Because of the growing success of eCommerce and the dominant position of some large Dot Coms (Amazon and Alibaba in the first place) bringing greater competitiveness, many people blame digitalization for the crisis, highlighting the decreasing importance of the points of sales which are often excluded from customer journeys by pure online players. However, forward-looking experts, scholars and executives recognize in the digital transformation an incredible opportunity to switch to omnichannel, a new trend which focuses on providing a seamless experience to the customers, integrated and consistent between the channels. In this context, the original meaning of the store as a physical point of access to the product is no more sufficient. Indeed, stores are crucial touchpoints that can add value in many omnichannel customer journeys.
Objectives & Research Questions
The main objective of this work was to develop a deep understanding of the Retail Apocalypse crisis and of the Retail industry in order to recognize which were the factors impacting on the industry in the last few years, as well as the main choices that Retailers took, and which were the effects they generated. The Literature Review performed on Retail, Drivers and Impacts led to the identification of some research gaps that needed further investigation. There was no study that combined all the relevant factors in one analysis, trying to understand quantitatively their impact. In particular, macro-economic variables and digital competition were always analysed individually; nevertheless, their relative impact with respect to other drivers was never computed.
In order to achieve the research objective, the following research questions were formulated:
2. What is the role of eCommerce in the Retail Apocalypse?
3. Why has the Retail Apocalypse generated in the US, and are there any differences in its spread in Europe because of some characteristics of the countries?
4. What are the characteristics and the choices of the most resilient Retailers? 5. How should Retailers behave to succeed in this context?
Research Methodology
The research methodology that was followed in this dissertation can be summarized in the following Figure:
Figure 1.1: Research Methodology
The first step was the Literature Review, which was focused on Retail, Drivers and Impacts both from an academic perspective, the Scientific Literature Review, and a professional one, the
Non-Scientific Literature Review. In the former, 48 peer-reviewed papers were gathered from Scopus, Science Direct, Emerald Insights and from the Academic Library of Politecnico di Milano through a research with varied and heterogeneous keywords, though all related to the main thesis focuses, in order to extract the highest possible amount of pertinent information from many different fields and disciplines. For what concerns the Non-Scientific review, 16 articles and reports by consulting companies and research entities on relevant topics were gathered through their official websites. All the scientific and non-scientific were screened, classified and analysed likewise, and subsequently they were added to an Excel sheet, referred as Literature Database, to keep track of all the relevant knowledge. In this way, each paper has been assessed on the basis of 6 main dimensions:
• Focus of the article;
• Research Methodology adopted;
• Market of Reference, which regards the sector, nationality and size of the Retailers considered;
• Exogenous Drivers, which concerns the external context in which the firms in the paper are exposed to;
• Endogenous Drivers; thus, the characteristics of the Retailers and the internal decisions taken in the past;
• Impacts of those drivers on the companies and on the Retail world in general.
Each dimension was divided into subsections, and each subsection was in turn divided into columns. In total, 105 columns were identified, plus 6 containing certain key general information about the document, such as the title, the source and the author.
An extensive analysis of the papers and reports was conducted to identify the main research gaps, which were already discussed. This process, however, was also critical to build the knowledge necessary to conduct the subsequent analyses in this thesis.
The second step of the research methodology, referred as Data Gathering, involved the creation of a cross-sectional Excel database, gathering the latest available pertinent data on Countries, Sectors and on selected top players in the Retail industry. 110 Retailers were investigated, starting from the top Retailers by revenues in each Country examined (US, UK, Germany, Italy, France, Spain, Netherlands, Belgium, Sweden, Switzerland) according to Global Powers of Retailing Report 2020 by Deloitte, with the commitment to explore the most relevant sectors in the industry (Grocery, Electronics, Fashion, Department Stores, Home Furniture, Drug Stores) selecting two retailers for each of them to have a comprehensive perspective on the Retail world.
Whenever it was not possible to identify enough Retailers from the list, they were recognized and added thanks to external sources. However, some Retailers were not considered large enough to be relevant for this research, as the comparison with the others would have been meaningless; therefore, not all the Countries were assigned with 12 Retailers as expected.
The actual data to be gathered was chosen on the basis of the Literature Review, trying to find variables which could represent the Drivers and Impacts identified in the process. For what concerns general information about the Countries, 18 variables were identified as potentially relevant. These data were gathered referring only to three databanks, namely World Bank, Trading Economics and OECD, to have a result as consistent as possible. Related to the Sectors, 3 variables were selected, with data coming from Eurostat for European Countries and from Census.gov for United States. Regarding the single Retailers, 59 different relevant aspects were investigated. In this case, the main sources were the company websites and their annual reports, even if many secondary references, both international and national, were consulted to fill the database where necessary.
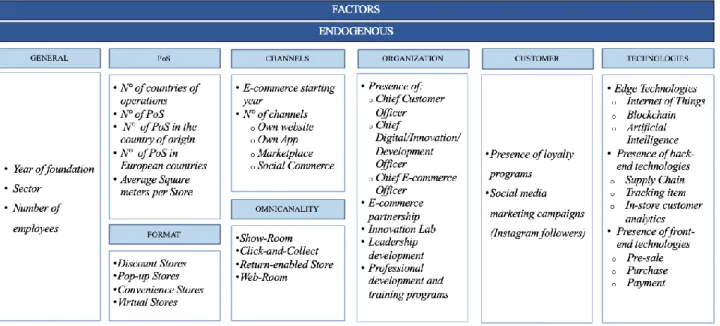
The structure of the Database was built to closely resemble the framework of the Literature Database, with a clear distinction between Exogenous Drivers (related to the Countries and Sectors), Endogenous Drivers and Impacts. This structure and the actual variables that were collected are reported in Tables 1.1, 1.2 and 1.3.
Table 1.2: Database Structure: Exogenous Factors
Table 1.3: Database Structure: Impacts
Following the Data Gathering process, a first exploratory analysis on the variables was conducted to understand the main trends and characteristics of the different Countries and Sectors, as well as to have a clear picture of the choices and the performances of the Retailers. The approach in this case was mainly visual, with intensive usage of charts and graphs to develop an in-depth knowledge of the data. Through this process, for example, it was possible to have precise information about the diffusion of particular technologies or the eCommerce penetration in the different Sectors.
Data Gathering phase, through which it was possible to quantitatively compare the performances of Retailers belonging to different Sectors and Countries. Indeed, relying on the accounting-based indicators computed in the Data Gathering phase, it was possible to quantitatively compare Retailers belonging to different Sectors and Countries.
Thanks to this exploratory research, outliers were identified and discussed, introducing de facto the following section: Statistical Analysis.
Before proceeding with this chapter, the Excel database was uploaded to IBM SPSS, a statistical analysis software that allows to run more sophisticated data analytics' tools and techniques. The first step was the Data Transformation phase: a few adjustments were made to the variables to make them more easily interpretable by the software and to better suit the analysis tools. In addition, the outliers that were considered inappropriate were replaced with a missing value.
The second step consisted in the Data Exploration: while most of it had already been conducted right after the Data Gathering process, SPSS allowed to extract additional information about the distribution of the data, for example about skewness and kurtosis, in a clear and concise way.
The last phase of this section concerned the Data Analysis: statistical tests such as correlations test, T-test, Anova test and Chi-square test were run to highlight some of the most interesting relationships between the variables.
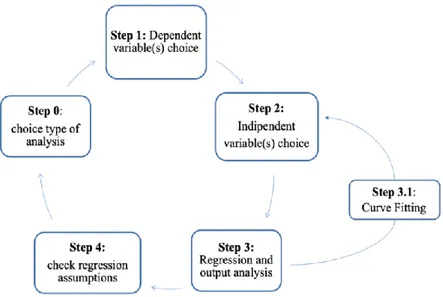
The following phase of this extensive empirical research, the Econometric Analysis, was related to the development of an econometric model that can bring additional quantitative proof to answer the research questions. First, a theoretical introduction about the main econometric techniques and tools was presented, along with their advantages, disadvantages and requirements. In this section, it was decided to apply univariate multiple linear regression to the SPSS Dataset, thanks to its superior interpretability compared to other analyses, as well for its fit with the objectives of this research. Two linear regression models were built. The first one, the Revenues Regression Model, has “Revenues” as the dependent variable, while the second one reported, the Store Closures Regression Model, takes its name from the its explained variable too, "Store Closures" . The decision to develop models with these variables was based on the contribute that they can bring towards the answer to the research questions. The explanatory variables to include in the models were also chosen for their pertinence towards this thesis objective, being also validated by the comprehensive Literature Review that was conducted before. The following Figure (1.2) represents which was the approach employed towards the development of the models:
Figure 1.2: Multiple Linear Regression model process
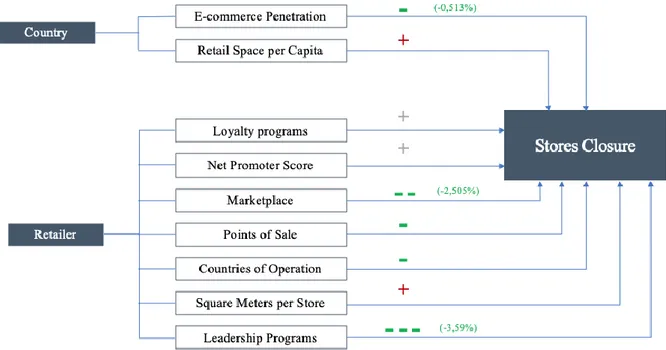
In particular, it was important to make sure that the assumptions behind the Ordinary Least Squares algorithm employed by the regressions were respected, so that the coefficients associated to the independent variables would be unbiased and precise. Figures 1.3 and 1.4 represent the relationships between explanatory and explained variables resulting from the econometric models. Some of them have a grey symbol, which means that the statistical significance was not confirmed. The strength of some of those relationships could not be quantified in a linear way with a percentage increase because of their intrinsic non-linear nature.
Figure 1.4: Store Closures Regression Summary
Research Findings & Conclusions
The Statistical and Econometric analyses were built with the specific aim of filling precise gaps in the Literature concerning the effects of digital competition and macroeconomic variables associated with the single countries in relation with all the other drivers behind the Retail Apocalypse. To do so, an extensive qualitative research about trends, factors and impacts currently reported in the Retail industry was necessary. The combination of qualitative and quantitative analyses developed the required knowledge to answer the main research questions:
1. Which are the main trends and drivers impacting on the Retail industry, and which are their effects?
Customer centricity is for sure considered the final aim for Retailers by academics, scholars and experts, and the interpretation of the quantitative analyses leads in the same direction. The omnichannel paradigm is the new frontier for the Retail industry, with companies that are striving to implement a competitive strategy that puts the customer at its centre, aspiring to provide a seamless, remarkable, and fully integrated customer experience. The new digital channels are a way to provide clients with more convenient touchpoints and to enable firms increase customers' satisfaction. Retailers are trying to present in whichever channel is more suitable for the needs of their customers, and this is the reason why there is a huge shift towards mobile commerce as the diffusion and the
usage of smartphone increase among people. Online marketplaces are spawning to aggregate Retail firms and provide them with the critical mass they need for their online channels, as well as access to new markets, customers and obtain an increased visibility in general. In the new omnichannel business models the store is a crucial offline touchpoint that is reimagined in a omnichannel perspective, from being just a purchasing location to a hub that offers support to the digital channels. Its focus shifts from selling goods to providing an amazing experience to customers, and therefore the design, the format and the location of points of sales are questioned to make sure that the store network matches the new needs of the clients. Being as close as possible to them is key to offer a noteworthy experience, and therefore many Retailers are “Returning to Proximity” by closing their large stores in peripheries and opening smaller convenience stores in city centres, places with higher traffic and higher accessibility. While opening a shop in an urban context where many other players are present can generate a negative externality due to the increased competitive intensity, there is also a positive externality, which is definitely stronger in this new context, due to the trade area providing a higher utility to customers. Smaller shops are also preferred as the presence of a large variety of goods and a huge exhibition space lose importance thanks to digital catalogues and online channels. Digital technologies, both front-end and back-end, are the enablers for the new omnichannel business models. They allow the Retailers to improve both their efficiency and their effectiveness, and therefore huge investments are made to launch new digital innovation initiatives. In particular, data analytics is focusing interest by most Retailers worldwide, not only for being so crucial for the success in the implementation of other technologies but also for the insights about the customer which can be extracted from big data. This information can be exploited to personalize and tailor the experience for the customers among the channels.
In order to manage these incredibly complex companies with enormous amount of data and so many touchpoints with the customers, the organizational structure changes, becoming agile in order to avoid separated silos of data and information that can lead to a poor integration. New professional figures, such as the Chief Customer Officers, are born to make sure that the firms are able to put the customer at the centre of their activities and that all the people inside work towards that objective.
2. What is the role of eCommerce in the Retail Apocalypse?
The regression model with store closures as dependent variable highlights how a higher eCommerce penetration in a country is in fact associated with a lower probability to close a store. According to the econometric analysis, an additional 1% of eCommerce penetration leads to a -0,513% of closed stores.
Therefore, it has been demonstrated that, eCommerce should not be seen as a practice that cuts stores out of the customer journey, but it should then be considered as an opportunity by large Retailers, which should exploit this channel and integrate it in their omnichannel strategy in order to provide a seamless and remarkable customer experience to their clients.
3. Why has the Retail Apocalypse generated in the US, and are there any differences in its spread in Europe because of some characteristics of the countries?
The economic and social contexts of US and European Countries are not that different from each other under many points of view, such as the diffusion of eCommerce, unemployment, GPD at purchasing power point per capita. However, United States show an incredibly high value of square feet per capita of Retail surface (23,5), which is not comparable to any of the European Countries, which report 4,7 square feet per capita on average. Digital technologies and omnichannel business models have shifted the need of consumers in terms of points of sales from large Retail spaces with a huge variety of products, to experience hubs that can support the online channels. These stores do not need enormous room for exhibition; the catalogue can be expanded by exploiting web-rooming and the electronic devices of the clients. Rather, having a store network in city centres or, in general, as close as possible to the customers, is a significant advantage for a Retailer by enhancing the experience that it can offer. The regression model confirms that players with average larger stores were more likely to close a point of sale, with the relationship described by a logarithmic function:
𝑆𝑡𝑜𝑟𝑒 𝐶𝑙𝑜𝑠𝑢𝑟𝑒𝑠 = 0,649 ∗ 𝐿𝑛 (𝑆𝑞𝑢𝑎𝑟𝑒 𝑀𝑒𝑡𝑒𝑟𝑠 𝑝𝑒𝑟 𝑆𝑡𝑜𝑟𝑒)
The characteristics of the logarithmic function illustrate well how unlikely it was for Retailers with smaller stores to close one of them, while an increasing square meters per store value was always connected with an increasing percentage of store closures.
The same model also highlights how the relationship between the closure of points of sales and the Retail surface per capita could be presented by a quadratic function:
𝑆𝑡𝑜𝑟𝑒 𝐶𝑙𝑜𝑠𝑢𝑟𝑒𝑠 = 0,039 ∗ 𝑅𝑒𝑡𝑎𝑖𝑙 𝑆𝑝𝑎𝑐𝑒 𝑝𝑒𝑟 𝐶𝑎𝑝𝑖𝑡𝑎2− 0,446 ∗ 𝑅𝑒𝑡𝑎𝑖𝑙 𝑆𝑝𝑎𝑐𝑒 𝑝𝑒𝑟 𝐶𝑎𝑝𝑖𝑡𝑎 The interpretation is that with higher values of Retail space per capita, store closures became definitely more likely, while lower values of average Retail surface lead to a reduced probability to close a point of sale.
US, by reporting such a high average Retail space per capita, are subject to a phenomenon called “Over-Retailing”. With Return to Proximity being one of the most relevant future trends in the Retail industry, this Country is the one in which Retailers should rethink their store network in the most radical way to adapt with the new needs of the customers. This is the main reason why the Retail
Apocalypse started in the US, and it also an explanation of why the Country is more exposed to the negative effects of the crisis compared to Europe.
4. What are the characteristics and the choices of the most resilient Retailers during the Apocalypse?
According to the regression model and to the Literature Review, the most resilient Retailers have some specific characteristics that concurred in building resilience over the years. Generally, the largest Retailers were advantaged thanks to the possibility to exploit economies of scale and economies of learning. In particular, highly internationalised players were less reliant of the macro-economic situation of their country of origin, being able to access a multitude of markets and customers. Moreover, their supply chain was also more resilient, even if more complicated, thanks to their relationship with a huge variety of potential suppliers. Operating in countries where the eCommerce penetration was high and the digital channels were developed was also an important factor in surviving to the crisis.
Additionally, as it was already discussed before, the firms who suffered less from the Retail Apocalypse were the ones which had a points of sale network with lower average square meters per store, more suitable to exploit the Return to Proximity trend.
Aggregating and exploiting marketplaces is also a choice that provided a sizeable advantage to Retailers who joined them. Being part of a community of players that gives access to new customers, markets and to an improved visibility increases the resilience in this new digital context.
A strong leadership is essential to survive to a crisis. The econometric model shows that the presence of specific programs to form managers and leaders were strongly correlated with a reduction in the stores closed during the Apocalypse. These companies were able to provide their executives with the skills necessary to inspire the workforce and to manage the increasing complexity due to the digital transformation.
5. How should Retailers behave to succeed in this context?
On the basis of the knowledge acquired through the analysis of the Database, the answer to this research question consisted in the development of a qualitative framework aimed at retailers which are struggling to survive the Retail Apocalypse. The process started with the identification of the main decision-making spheres, corresponding to the most relevant research variables, and finally the proposal of a roadmap for successful transition towards omnichannel retailing.
In order to answer this research question, the first step was to identify the dimensions underlying the decisions that can be taken, which are represented in Figure 1.5.
Figure 1.3: Decision Dimensions
The second step was to understand which are the phases of the crisis, clarifying the corresponding market conditions and underlining which should be the main focus of the business in each phase. Figure 1.6 summarizes the findings in this sense.
In the first phase, the increasing competition and the over-Retailing phenomenon give birth to the Retail Apocalypse. The companies should be focusing on building resilience, adapting their characteristics and making choices that allow them to be less exposed to the new challenges while simultaneously save resources.
In the second phase, “Thrive”, the effects of the reorganization of the Retail infrastructure thanks to the Apocalypse become evident. At the same time, companies try to launch initiatives to integrate their channels and develop omnichannel business models in order to overcome the Apocalypse. In this context, Retailers should aggressively invest in new digital technologies and channels, while simultaneously rethinking their store network to match the new needs of the customers.
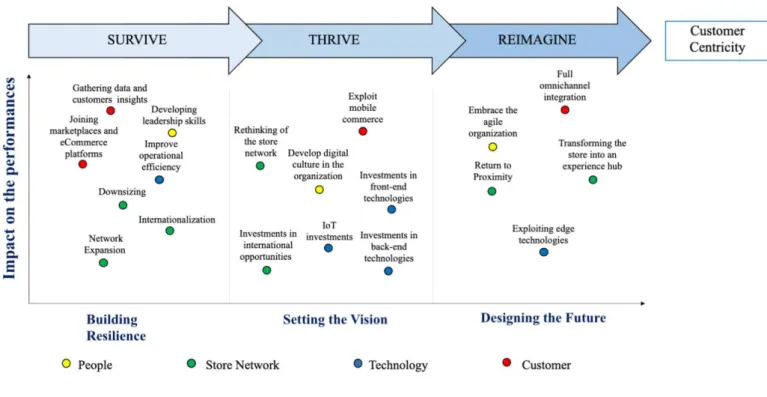
In the last phase, the crisis is over, and Retailers are leading towards the future of the industry. In this context, a player in this industry should adhere to full customer centricity and should redefine its store network, organization, and all its other decision areas in order to match the needs of the customers. In Figure 1.7, the most appropriate decisions in each of the dimensions identified before were included for each of the phases of the crisis.
Figure 1.5: Roadmap for successful transition to omnichannel retailing
While the matrix is thought to be qualitative, the position of each of the activities is chosen based on the econometric models and on the Literature Review. Each phase should be considered separately for a proper interpretation. The main takeaway is that Retailers should be understanding in which
phase they are, and they should adapt their decisions on this basis. The final aim, however, should be to put the customer at the heart of their strategy to be able to succeed in the future.
1.1 A note about Covid-19
This thesis was assigned before the terrible spread of Covid-19 across the globe, and all the information gathered in the Data Gathering process refers to time periods prior to the pandemic. However, it is undeniable that its impact will reshape economy and society forever, with Retail being one of the industries most affected and transformed by lockdowns, social distancing and the diffusion of new practices to face the virus. Academics and experts seem to be aligned in stating that the trends that were already identified as upcoming are still the same, and they have just been accelerated by the necessity of the fight against the pandemic. A section was dedicated to the analysis of reports and articles about the effect of Covid-19 in Retail, as well as some exemplary initiatives launched in this period by companies to continue their business with compliance to the new regulations. In this new crisis, customers changed their usual preferences in terms of brands and customer journey; digital technologies, omnichannel marketing practices and the rethinking of the points of sale infrastructure, format, location and design were key to generate new ways to stay in touch with them. It was crucial for the companies to pursue agility to be able to design and deploy innovation in order to meet the evolving priorities. It was possible to see a clear overlap between the findings and the conclusions of this thesis, the trends described by scholars and consultants, and what actually happened in the real world, which is a pleasant confirmation of the validity of the results of this research.
2 Introduction
Retail is usually defined as the activity of a business selling products or services to a final consumer. It generally involves the sale of small quantities of goods to a multitude of customers. A Retailer is a company from which the end users make their purchases. Retailers typically do not manufacture the products they sell, but they just buy them from wholesalers or manufacturers and sell them in much smaller quantities to a large number of customers. In order to obtain these goods, they generally rely on a supply chain composed of multiple actors, which has the objective of making them obtain the right products at the right time and at a price that allows them to have a competitive margin. Each of the actors in the supply chain has a specific role and carries on different activities; Retailers are the last ring of the supply chain, being in direct contact with the final customer. Among the reasons of the existence of Retailers is their ability to exploit economies of learning and economies of scale, as well as being able to engage clients with a unique customer experience, offering a huge variety of products from different manufacturers.
Traditionally, customers can go to points of sales, managed by Retailers, to make their purchases. Stores can vary in size and format on the basis of the strategy adopted by the corporation, which tries to align the store network in order to match the needs of the final customers. Opening a new store means potentially reaching a new geographical market and the new customers in that area.
Retailing is an activity that traces back to antiquity, with points of sales evolving and transforming to become the modern boutiques and shopping malls. In the last years, however, digital transformation lead to the diffusion of new business models and to a radical change in the industry.
In the last decades, the traditional Retail paradigm was shaken by the advent of eCommerce, a phenomenon which is defined as the online sale or purchase of goods or services to a final customer. The investment to set up an eCommerce initiative is huge, and the success of the project is often very dependent on the critical mass that a Retailer is able to reach. This fact led to the creation of many online marketplaces, which agglomerate several traditional Retailers to optimize the logistics and marketing costs. In a pure online transaction, customers can inform themselves, get in touch with a Retailer, pay and have their goods delivered at home, all without the need of a physical store in the process. In these last few years, however, the proliferation of several new channels thanks to the Internet and the birth of hybrid online-offline customer journey has brought to the development of the omnichannel paradigm, a strategy in which a Retailer try to offer a seamless customer experience to its customers in an integrated and coherent way among the channels. The development of new digital technologies is changing the way Retailers do business, transforming some of the more consolidated activities and creating new ones in a very turbulent, fast-paced and uncertain
Starting from 2015 (Helm et al. 2018) there have been a huge number of closures of points of sales and bankruptcy filings from companies in the Retail industry. This phenomenon started in the United States, with the failure of large Retail chains such as Toys R Us and Sears, but soon spread to Europe, even if with lower intensity.
The blame for the existence of this phenomenon, which was given the name of Retail Apocalypse, has been mainly given to eCommerce, which is considered to be responsible of cutting off physical stores from the customer journey, and especially to Amazon, the biggest online marketplace, which is deemed guilty of imposing an unsustainable competition pressure thanks to its scale and investment capabilities.
On the contrary, some scholars, academics and experts consider the new digital channels as an incredible opportunity for Retailers worldwide to improve the customer experience they offer and to switch to new omnichannel business models. Amazon itself has bought grocery Retailer Whole Foods in 2017 and started opening new store with its own brand to exploit the advantages of omnichannel. In conclusion, the actual scenario of the Retail industry is the one of a business which is undergoing a drastic reshaping in strategies, business models and activities thanks to the Internet and the Digital Transformation.
3 The Scientific Literature Review
In this first phase the aim was to search, understand and analyse scientific papers concerning the so-called “Retail Apocalypse”, the sudden closure of many points of sale, and sometimes even of entire established Retail chains, all over the world. Some scholars identifythe Internet and the competition coming from eCommerce on traditional physical Retail as the main drivers behind this phenomenon. Others, on the contrary, look at the digital transformation more as an opportunity, rather than a threat. What is clear is that the market is undergoing a drastic reshaping, and the object of this research is to understand which are the main drivers behind it, and how Retailers are coping with them, transforming their businesses and the way in which they create value.
Therewere many different topics to be addressed, such as the impact of the customer experience and relationship, the intensity of competitive forces, the synergies between the actors, the skills of the sales force, the organizational structure of Retailers, the strategic approach they are pursuing in this new context, just to show some examples. It is clear that this kind of analysis required competences stemming from many different fields, such as marketing, business administration, innovation, macro-economics, and even applied geography. Academics and researchers from manifold disciplines started addressing this problem from very peculiar points of view, and the objective was to gather information from their papers to have a clear picture of the megatrends that will shape the market in the future, and also how Retailers will adapt and react to them.
48 papers coming from many different sources were analysed; most were found thanks to the online academic library of Politecnico di Milano, Scopus and Emerald Insight. In particular, it was decided to set the focus on three main areas: Retail, Drivers behind the market transformation, and Impacts generated on the business. From now on, these three areas will be referred to as the Focuses of the academic research. Figure 3.1illustrates the research areas of this thesis.
Methodology
3.1.1 Scope of the analysis
The main objective of this analysis was to have a clear idea of how the three main research areas are intertwined between each other and to capture the nature of the most important relationships between the critical topics.
In order to have a clear and structured approach to the analysis, a Microsoft Excel sheet was used to build a database, following a clear structure based on an analytical framework expressly developed. This is definitely necessary given the number of papers read, and it was also useful as the baseline to deal with the Non-Scientific Literature Review later on.
3.1.2 Scientific Literature Process
The process that was followed in order to provide input data to the Literature Review can be summarized in four main phases:
1. Article Search
In this phase the online library of Politecnico di Milano and Scopus were explored to find papers. To be sure that the work was as rigorous as possible, only peer-reviewed articles were taken into account. The key aspect to consider here was the use of the right keywords; the research needed material coming from many different fields, therefore it was crucial to pay attention to use the right search input for each topic. Moreover, papers are written in every corner of the world, and different authors often referred to the same concepts using different terms, which made the process more complicated. Additionally, authors often employ catchy words or phrases to entitle their articles, which means that sometimes papers could not be easily found with the most immediate keywords. The most used keywords were: “Retail digitalization”, “Retail Apocalypse”, “Retail sustainability”, “Retail strategy”, “Retail externalities”, “omnichannel Retail”, “eCommerce impact”, “Retail customer experience”, “Retail organization”, “Retail format”, “Retail drivers”, “Retail business model”, “Retail innovation”, “closing stores”, “smart Retail”, “traditional Retail”, “Retail globalization”.
Another critical point to consider was related to the year of publication of the paper. It was really important to analyse recent articles; the world is changing faster than ever, new trends come up continuously and drastically re-shape the Retail business. However, many concepts about Retail were studied thoroughly in the past, and it was crucial to not forget about them. The research was focused mostly on articles written after the 2008 economic crisis, but some previous works were considered to be valuable for the thesis and therefore they were added.
2. Paper Selection
In this phase, the title and the abstract of the papers found through keyword research were read and discussed. Only the most promising papers could transition through this phase into the next one. To be considered promising, an article must have been addressing one of the focuses directly and in a way that was considered relevant for the research. No restrictions about the breadth of the topics or fields that had some influence on the research topic was made, in order to be able to catch drivers of change analysed by many different academic fields. However, it was important to be extremely selective in order to avoid considering papers which were not relevant for this thesis work; a large quantity of articles was taken into consideration and most of them were discarded to avoid being off topic.
3. Paper Structure
In this phase, the paper was added to the framework and carefully read; the most relevant parts were highlighted. Concurrently, important information about the article, such as the source, the authors, the year of publication and the focus were recorded, and additional meaningful information were classified in the Literature Database.
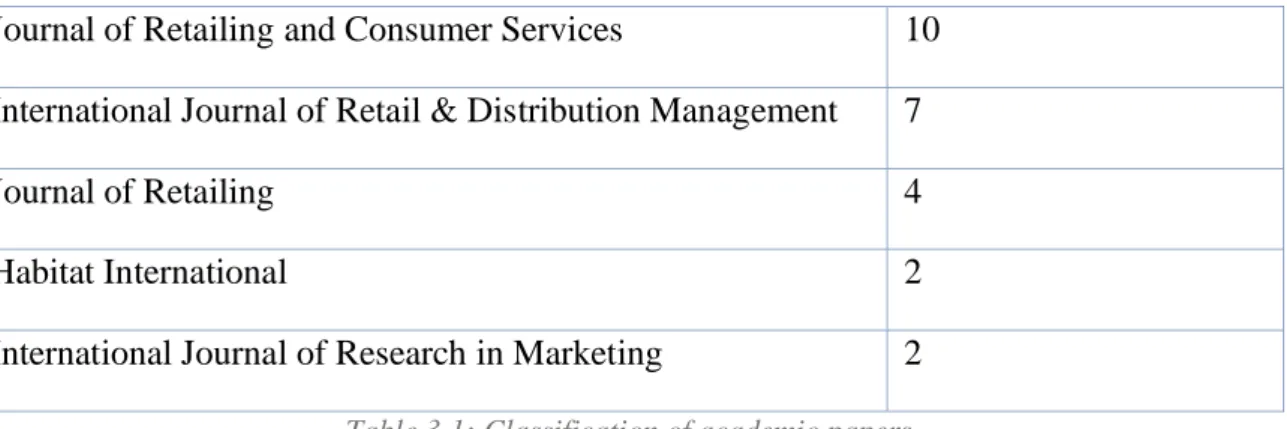
The most frequent sources were:
Journal of Retailing and Consumer Services 10 International Journal of Retail & Distribution Management 7
Journal of Retailing 4
Habitat International 2
International Journal of Research in Marketing 2
Table 3.1: Classification of academic papers
It is clear how 28 out of 48 articles came from unique sources; this highlights the relevance of the topic we are discussing, which was studied by many scholars all around the world; however, it is also an indication of how many different approaches and disciplines could be used to tackle it.
4. Paper Analysis
In this last part of the process, a short summary of the paper was written to highlight the most crucial concepts and the most significant information was extracted to fill the analytical framework. The framework was built with a hierarchical structure that will be discussed in the next chapter.
Literature Analysis
As a result of the process just described, 48 papers were gathered through the research on the online library of Politecnico di Milano, Scopus and Emerald Insight. Moreover, 16 non-scientific papers were added, coming from many different sources, such as reports from leading companies in consultancy or newspapers, which made them freely available on the web.
Information extracted from them was used to build and fill the analytical framework, which needs to be discussed in detail, as it was a key tool to find gaps in the Literature.
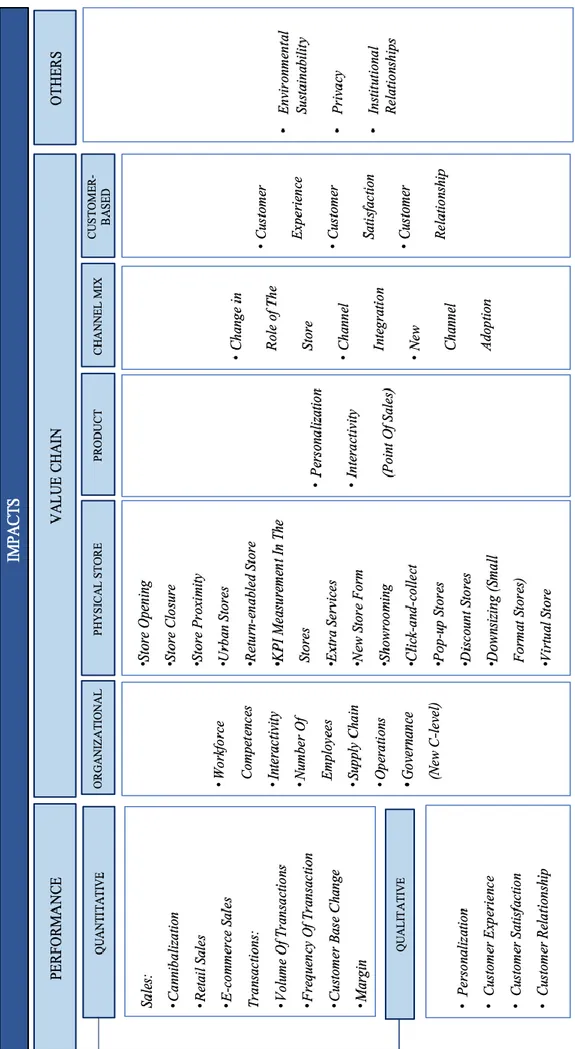
The framework is composed by six main areas. The first three concern the Focus; the Research Methodology, divided in qualitative and quantitative; the reference market, which is split into sector, nationality and size of the Retailer discussed. Subsequently, there are two areas which take into consideration the drivers of change in the industry: the first one deals with factors which are exogenous to the single Retailer, such as competition, macroeconomic factors, customer-base, digital-based, synergies, commercial distribution. The second one deals with factors which are instead endogenous to the single Retailer, such as its strategic choices, HR structure, product offering and technological infrastructure. The last part of the framework is dedicated to impacts of the changes in the business on the Retailers, concerning both their performances and their value chains. Impacts of other nature are also taken into consideration.
T abl e 3 .4 : L it e rat ur e D at ab as e St ruc tur e
3.2.1 Focus
Focuses are the first aspect of the framework and they need an appropriate discussion. They represent the main topics of the articles tackled in the research: Retail, Drivers of change, and Impacts. This phase had two main objectives: first, it was crucial to be sure to analyse papers which were relevant for the thesis. This is one of the main reasons why most of the articles selected speak about more than one focus: the risk of them being off topic was much lower. The second objective was to understand how those topics were intertwined between them, in order to grasp both the most evident and the most hidden relationships. Articles that were able to connect more than one focus at the time were prioritized, and this is another explanation on why there are many overlapping in this part.
In Figure 3.2 it is possible to observe the focuses of the paper that were searched and analysed
Figure 3.2: Focuses of the Literature Analysis with papers division
The first thing to notice is that all the articles had a clear focus on Retail. The reason is that any paper that took into account Drivers or Impacts on Retail without conducting a specific analysis on the Retail business itself was considered not deep or relevant enough to included.
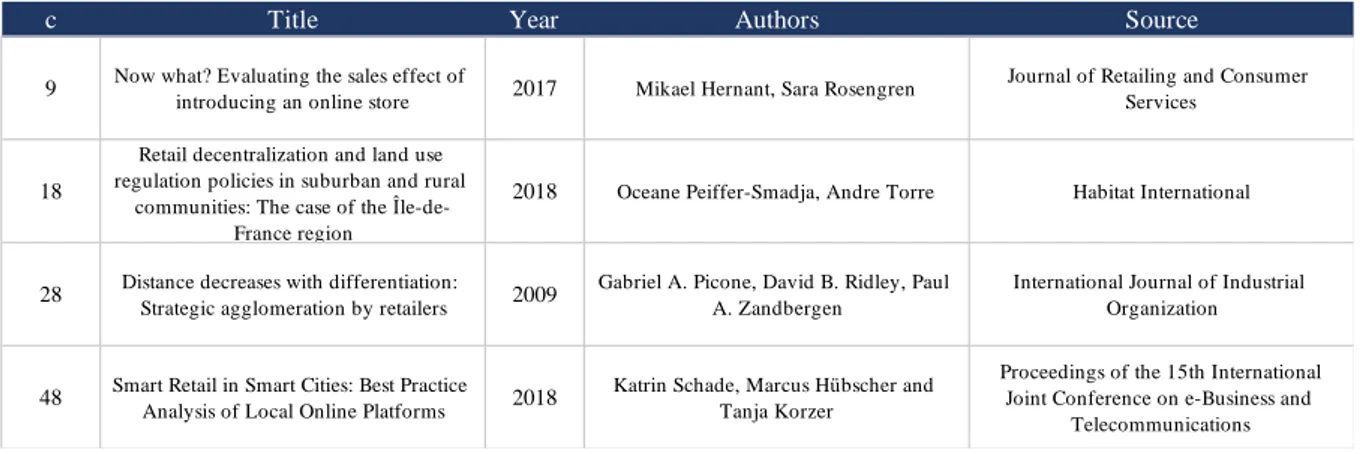
Four papers combined impacts of the changes with the Retail business, without speaking of the factors behind the transformation. Those articles generally studied a specific impact and added a lot of relevant knowledge about the possible responses by companies or the government. An example is Smart Retail in Smart Cities: Best Practice Analysis of Local Online Platforms (2018) by Schade and colleagues, in which the authors described the best practices in terms of local online Retail platforms and their key success factors.
5 39 0
0 0 4
Table 3.5: Papers addressing Impacts
Five papers just targeted the Retail business without entering in details of Drivers and Impacts of the Retail Apocalypse, or in general of the transformation of the business. Those articles were considered to be relevant as they provided some useful information about the field, such as the most recent techniques or strategies implemented by companies, or to report and understand the most cutting-edge research in Retail. An example is Omni-channel Retailing research – state of the art and intellectual foundation (2018) by Galipoglu and colleagues, which had the objective to reveal the intellectual foundation of omnichannel research by classifying and reviewing the existing knowledge on the topic.
Table 3.6: Papers addressing Retail only
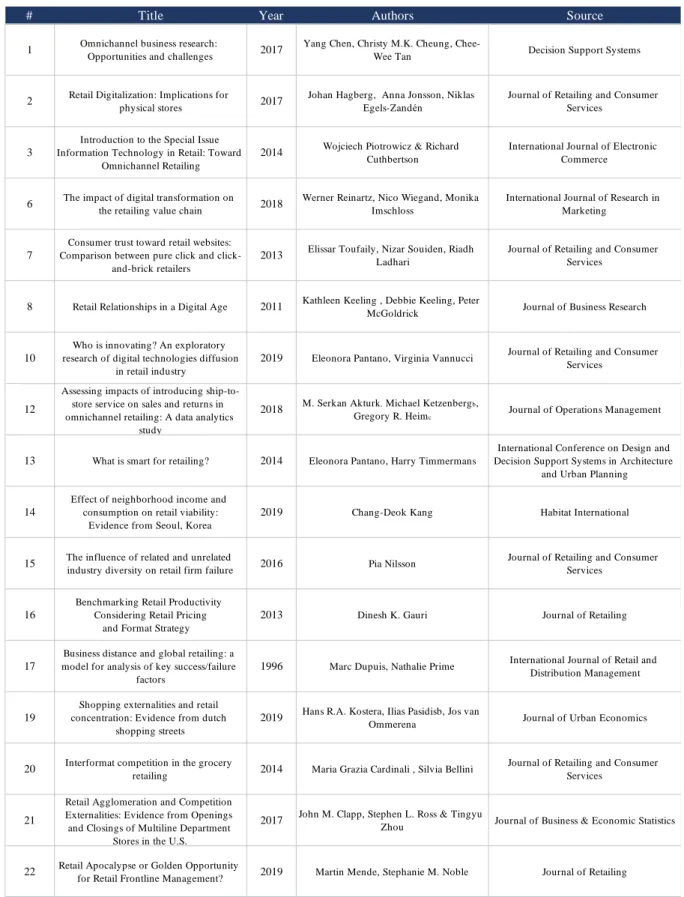
Another important fact is that most of the papers (38) covered all the focuses. This shows how many academics already tried to connect some of the drivers of change in the Retail business in the last few years to the possible outcomes of the transformation. An example might be Analysing Retail store closures (2016) by Cavan, in which the authors was struck by the closing of many shops after the 2008 crisis and tried to understand which were the main reasons why a Retailer should decide to close one of its points of sales. As it is possible to see, just one
# Title Year Authors Source
4
Transitions towards omni-channel retailing strategies: a business model
perspective
2018
Milan Jocevski, Niklas Arvidsson, Giovanni Miragliotta, Antonio Ghezzi and
Riccardo Mangiaracina
International Journal of Retail & Distribution Management
5 Omni-channel retailing research – state of
the art and intellectual foundation 2018
Erdem Galipoglu, Herbert Kotzab, Christoph Teller, Isik Özge Yumurtaci
Hüseyinoglu, Jens Pöppelbuß
International Journal of Physical Distribution & Logistics Management
11
A quantitative performance management framework for assessing omnichannel
retail supply chains
2019 Burcu Adivar, Işık Özge Yumurtacı
Hüseyinoğlu, Martin Christopher
Journal of Retailing and Consumer Services
39
Buy online collect in-store: exploring grocery click&collect
using a national case study
2019 Alec Davies, Les Dolega and Daniel
Arribas-Bel
International Journal of Retail & Distribution Management
40
Paradoxical influence of family ownership on innovation-focused organizational change. Evidence from a large family
business retail firm
2019
Izabela Szymanska, Anita Blanchard,
Kaleigh Kuhns Journal of Family Business Management
c Title Year Authors Source
9 Now what? Evaluating the sales effect of
introducing an online store 2017 Mikael Hernant, Sara Rosengren
Journal of Retailing and Consumer Services
18
Retail decentralization and land use regulation policies in suburban and rural
communities: The case of the Île-de-France region
2018 Oceane Peiffer-Smadja, Andre Torre Habitat International
28 Distance decreases with differentiation:
Strategic agglomeration by retailers 2009
Gabriel A. Picone, David B. Ridley, Paul A. Zandbergen
International Journal of Industrial Organization
48 Smart Retail in Smart Cities: Best Practice
Analysis of Local Online Platforms 2018
Katrin Schade, Marcus Hübscher and Tanja Korzer
Proceedings of the 15th International Joint Conference on e-Business and
particular impact was considered here, together with its roots and its consequences. The question that emerged was to understand whether all those papers just target some specific Drivers or Impacts, or if there are some articles that analyse the Retail field with an integrated approach, to describe and study all the elements that are changing and the reasons why they are doing so.
# Title Year Authors Source
1 Omnichannel business research:
Opportunities and challenges 2017
Yang Chen, Christy M.K. Cheung,
Chee-Wee Tan Decision Support Systems
2 Retail Digitalization: Implications for
physical stores 2017
Johan Hagberg, Anna Jonsson, Niklas Egels-Zandén
Journal of Retailing and Consumer Services
3
Introduction to the Special Issue Information Technology in Retail: Toward
Omnichannel Retailing
2014 Wojciech Piotrowicz & Richard
Cuthbertson
International Journal of Electronic Commerce
6 The impact of digital transformation on
the retailing value chain 2018
Werner Reinartz, Nico Wiegand, Monika Imschloss
International Journal of Research in Marketing
7
Consumer trust toward retail websites: Comparison between pure click and
click-and-brick retailers
2013 Elissar Toufaily, Nizar Souiden, Riadh
Ladhari
Journal of Retailing and Consumer Services
8 Retail Relationships in a Digital Age 2011 Kathleen Keeling , Debbie Keeling, Peter
McGoldrick Journal of Business Research
10
Who is innovating? An exploratory research of digital technologies diffusion
in retail industry
2019 Eleonora Pantano, Virginia Vannucci Journal of Retailing and Consumer Services
12
Assessing impacts of introducing ship-to-store service on sales and returns in omnichannel retailing: A data analytics
study
2018 M. Serkan Akturk, Michael Ketzenbergb,
Gregory R. Heimc Journal of Operations Management
13 What is smart for retailing? 2014 Eleonora Pantano, Harry Timmermans
International Conference on Design and Decision Support Systems in Architecture
and Urban Planning
14
Effect of neighborhood income and consumption on retail viability:
Evidence from Seoul, Korea
2019 Chang-Deok Kang Habitat International
15 The influence of related and unrelated
industry diversity on retail firm failure 2016 Pia Nilsson
Journal of Retailing and Consumer Services
16
Benchmarking Retail Productivity Considering Retail Pricing
and Format Strategy
2013 Dinesh K. Gauri Journal of Retailing
17
Business distance and global retailing: a model for analysis of key success/failure
factors
1996 Marc Dupuis, Nathalie Prime International Journal of Retail and Distribution Management
19
Shopping externalities and retail concentration: Evidence from dutch
shopping streets
2019 Hans R.A. Kostera, Ilias Pasidisb, Jos van
Ommerena Journal of Urban Economics
20 Interformat competition in the grocery
retailing 2014 Maria Grazia Cardinali , Silvia Bellini
Journal of Retailing and Consumer Services
21
Retail Agglomeration and Competition Externalities: Evidence from Openings and Closings of Multiline Department
Stores in the U.S.
2017 John M. Clapp, Stephen L. Ross & Tingyu
Zhou Journal of Business & Economic Statistics
22 Retail Apocalypse or Golden Opportunity
Table 3.6: Papers That Cover All the Focuses
# Title Year Authors Source
1 Omnichannel business research:
Opportunities and challenges 2017
Yang Chen, Christy M.K. Cheung,
Chee-Wee Tan Decision Support Systems
2 Retail Digitalization: Implications for
physical stores 2017
Johan Hagberg, Anna Jonsson, Niklas Egels-Zandén
Journal of Retailing and Consumer Services
3
Introduction to the Special Issue Information Technology in Retail: Toward
Omnichannel Retailing
2014 Wojciech Piotrowicz & Richard
Cuthbertson
International Journal of Electronic Commerce
6 The impact of digital transformation on
the retailing value chain 2018
Werner Reinartz, Nico Wiegand, Monika Imschloss
International Journal of Research in Marketing
7
Consumer trust toward retail websites: Comparison between pure click and
click-and-brick retailers
2013 Elissar Toufaily, Nizar Souiden, Riadh
Ladhari
Journal of Retailing and Consumer Services
8 Retail Relationships in a Digital Age 2011 Kathleen Keeling , Debbie Keeling, Peter
McGoldrick Journal of Business Research
10
Who is innovating? An exploratory research of digital technologies diffusion
in retail industry
2019 Eleonora Pantano, Virginia Vannucci Journal of Retailing and Consumer Services
12
Assessing impacts of introducing ship-to-store service on sales and returns in omnichannel retailing: A data analytics
study
2018 M. Serkan Akturk, Michael Ketzenbergb,
Gregory R. Heimc Journal of Operations Management
13 What is smart for retailing? 2014 Eleonora Pantano, Harry Timmermans
International Conference on Design and Decision Support Systems in Architecture
and Urban Planning
14
Effect of neighborhood income and consumption on retail viability:
Evidence from Seoul, Korea
2019 Chang-Deok Kang Habitat International
15 The influence of related and unrelated
industry diversity on retail firm failure 2016 Pia Nilsson
Journal of Retailing and Consumer Services
16
Benchmarking Retail Productivity Considering Retail Pricing
and Format Strategy
2013 Dinesh K. Gauri Journal of Retailing
17
Business distance and global retailing: a model for analysis of key success/failure
factors
1996 Marc Dupuis, Nathalie Prime International Journal of Retail and Distribution Management
19
Shopping externalities and retail concentration: Evidence from dutch
shopping streets
2019 Hans R.A. Kostera, Ilias Pasidisb, Jos van
Ommerena Journal of Urban Economics
20 Interformat competition in the grocery
retailing 2014 Maria Grazia Cardinali , Silvia Bellini
Journal of Retailing and Consumer Services
21
Retail Agglomeration and Competition Externalities: Evidence from Openings and Closings of Multiline Department
Stores in the U.S.
2017 John M. Clapp, Stephen L. Ross & Tingyu
Zhou Journal of Business & Economic Statistics
22 Retail Apocalypse or Golden Opportunity