UNIVERSITÀ DEGLI STUDI DI NAPOLI FEDERICO II
DIPARTIMENTO DI SCIENZE BIOMEDICHE AVANZATEDOTTORATO DI RICERCA IN SCIENZE BIOMORFOLOGICHE E CHIRURGICHE (XXXI CICLO)
Coordinatore: Prof. Alberto Cuocolo
TESI DI DOTTORATO
Applications of machine learning algorithms using texture analysis-derived
features extracted from computed tomography and magnetic resonance images
RELATORE CANDIDATA Prof. Arturo Brunetti Dott.ssa Valeria Romeo
Introduction
Radiomics relies on post-processing images derived from diagnostic examinations such as ultrasound (US), computed tomography (CT), magnetic resonance (MR) or positron emission tomography (PET), by means of appropriate created algorithms with the extraction of a big amount of data (Gillies 2015). Radiomics has been recognized to have a great potential offering different potential applications especially in the oncologic field, from tissue characterization to the
assessment/prediction of the response to a specific treatment, towards a “personalized medicine”. One of the main applications of radiomics is texture analysis (TA), a post processing imaging technique that analyzes the spatial variation of pixel intensity levels within an image obtaining quantitative data reflecting image heterogeneity. The texture of an image can be evaluated using statistical, model or transformed-based methods. Among these, the statistical method is the most widely applied in medical images. According to this tool first, second and higher-order features are extracted that depend on the spatial variation in pixel intensity levels (Alobaidli 2014). In detail, first-order quantitative features represent the distribution of pixel intensities (Histogram Analysis, HA); second-order textural features are extracted by the analysis of grey-level co-occurrence matrices (GLCM) and rely on the relation between couples of pixels; finally, high order textural features extracted from Neighborhood Grey-Tone Difference Matrices (NGTDM) describe the relation between a pixel and the neighboring pixels, while Run Length Matrices (RLNM) consist the number of consecutive pixels that have the same intensity level and which occur in a specified direction.
Machine learning (ML) is an application of artificial intelligence for recognizing patterns that can be applied to medical images (Erickson 2017); it enables the development of algorithms that can learn and make prediction, with the ability to improve with the experience. Three categories of ML tool can be identified: 1) supervised, in which data labels are provided by experts to the learning algorithm for the training test; 2) unsupervised, in which no data labels are provided to the learning algorithm; and 3) reinforcement learning, in which “a computer program performs a certain task in a dynamic environment in which it receives feedback in terms of positive and negative
reinforcement” (Choy, 2018). ML software can be applied in different fields of radiology: image acquisition (e.g. suggesting modifications to acquisition protocol during MR examinations); detection of imaging findings (e.g. pulmonary or thyroid nodules detected as incidental findings or for breast cancer screening); interpretation of imaging findings; clinical decision support; image segmentation and quality analysis; and radiation dose estimation (Choy, 2018). Using TA features extracted from medical images, ML algorithms are able to identify the best combination of features in order to create a predictive algorithm for the diagnosis of interest (Juntu 2010). Regarding the oncologic field, ML analysis using TA applied to CT or MR images has been proved to identify combination of features correlated to histopathology parameters in thyroid (Meyer 2017), breast (Holli 2010, Waugh 2016) and lung cancer (Ganeshan 2013) as well as to predict locations of metastases (Coroller 2015, Vallieres 2015) and the efficiency of treatments (Tixier F 2011, De Cecco 2015, Dang 2015). These findings expand the research tools available for tissue
characterization, clinical management and prediction of patients’ prognosis.
The aim of this work is to illustrate our experience in TA and ML field using MR and CT images acquired in patients with adrenal lesions and head and neck cancer imaging, respectively. In
particular, we aimed to assess the accuracy of ML algorithms in the differential diagnosis of adrenal lesions and to predict tumor grade and nodal involvement in oropharynx and oral cavity
squamocellular carcinoma.
Adrenal lesions characterization
Adrenal lesions, frequently detected as incidental imaging findings, are mainly represented by benign adrenal adenomas (AA) (Song 2008). Although well-defined CT and MR imaging criteria are currently used to characterize adrenal lesions, particularly Lipid-Rich Adenomas (LRA) (Korivi 2013), the correct differentiation between AA and non-adenoma adrenal lesions (NAL) is still challenging. Of note, lipid-poor adrenal adenomas (LPA) fail to be characterized by
measurement of unenhanced CT Hounsfield Unit (HU) threshold as well as by signal intensity loss on Chemical-Shift (CS) MR sequence. Therefore, alternative imaging methods, long-term follow-up, biopsy or surgical resection for final diagnosis are currently used in such adrenal lesions. In a previous study CT histogram analysis method was found useful to differentiate adrenal adenomas from non-adenomas (Halefoglu 2010, Remer 2006). According to Blake and colleagues, the most practical clinical application of HA in adrenal imaging seems to be supplementing unenhanced CT to improve sensitivity to almost 90%, maintaining a high specificity (Blake 2010). To the best of our knowledge, only one study analyzed the role of HA applied to MR images and specifically on Apparent Diffusion Coefficient (ADC) maps to differentiate AA from Pheochromocytomas
(Umanodan 2017). In this setting, our aim was to assess the diagnostic effectiveness of TA-derived parameters (morphologic, first-order, GLCM and RLNM) using a ML approach to characterize LRA, LPA and NAL on unenhanced T1-weighted in-phase (IP) and out-phase (OP) as well as T2-weighted MR images.
Materials and Methods Patient population
This retrospective study was approved by our local Institutional Review Board (IRB) and the requirement for informed consent was waived.
A consecutive case series of 436 abdominal MR examinations of patients with adrenal lesions, performed at our institution between September 2014 and September 2016, were reviewed. Inclusion criteria were: presence of at least one adrenal lesion; adrenal adenomas classified as LRA and LPA based on in & out of phase behavior, in terms of presence/absence of clear and homogeneous signal intensity drop on out-phase images compared to in-phase images as previously reported (Maurea 2006, Chung 2001), confirmed by means of a long-term MR follow-up (at least 1 year) or surgical excision; histologically proven NAL. Exclusion criteria were: poor quality MR images affected by motion/respiratory artifacts; incomplete MR examinations; patients with clinically/radiologically
suspected LRA and LPA without a long term follow up and/or histological confirmation; patients with a suspected NAL because of MR features without histological confirmation. Considering NAL were the least frequent lesion type (n=20), to obtain equally numerous groups for all three categories, the first 20 eligible consecutive patients with LRA and LPA who fulfilled the above-mentioned criteria were selected. In all, 60 MR examinations including 20 LRA, 20 LPA and 20 NAL (11 pheochromocytomas, 5 metastases, 1 hemangioma and 3 carcinomas) were selected. The flow chart of patient selection is reported in Figure 1.
In 24 patients (4 LPA, 20 NAL) post-surgical histology confirmation of the diagnosis was obtained. In the remaining 36 patients (20 LRA and 16 LPA), stable lesion size during the 1-year follow-up was considered diagnostic criterion for lesion classification as adenomas. The follow-up evaluation consisted of clinical and laboratory assessment as well as additional imaging studies (MR and/or radionuclide). The mean age of the 60 patients (41F) was 58.6 ±14 years (age range 18-79 years). Median values of lesion size were 19 mm (range: 7- 46 mm), 26 mm (range: 8-54mm) and 52 mm (range: 13-107mm) for LRA, LPA and NAL respectively.
MR acquisition protocol
MR examinations were performed using a 3T MR scanner (Magnetom Trio, Siemens Medical Solutions, Erlangen, Germany) and a 4-channel abdominal surface coil and integrated spine phased-array coil (Body Matrix, Siemens Medical Solutions); the protocol included axial HASTE T2-weighted (T2-w) sequence (TR/TE= 2000/90 ms, Flip Angle 150°, slice thickness 3 mm, gap 0.6 mm) and axial TFL T1-w CS sequence (TR/TE= 1500/1.37 and 2.27 ms, Flip Angle 20°, slice thickness 3.5 mm, gap 0.7 mm).
Texture analysis
Each detected adrenal lesion was manually segmented using a dedicated software (ITK-SNAP v 3.4) through placement of a spherical Volume of Interest (VOI) on In-Phase (IP), Opposed-Phase
(OP) and T2-w images (Yushkevich 2006), as shown in Figure 2. VOIs were placed in the center of each lesion and enlarged or reduced in order to stay within the margins of the lesion and to avoid the inclusion, when present, of necrotic areas. This segmentation method was applied to reduce observer’s influences that were limited to the identification of the center of the lesions. A spherical VOI shape was chosen as most adrenal lesion have a rounded shape. If large central necrosis was present, VOIs were placed peripherally over solid tumor tissue. Images and VOIs were successively imported on 3D Slicer (HeterogeneityCAD module) to extract a total of 138 first-order, GLCM and RLM texture parameters, 46 for each MR sequence (Fedorov 2012). The wisdom of each feature selection method was assessed by calculating the diagnostic performance of each feature group with the J48 classifier. Subsequently, ML analysis was conducted using a dedicated data mining software (Weka v. 3.8.1), freely available (www.weka.org) (Eibe 2016, Ian 2011, Remco 2010). The training of the ML classifiers required feature selection to avoid overfitting and the overall reduction of classifiers’ capabilities. Feature selection methods belong to three main categories: 1) subset feature selection methods, which use a learning algorithm and evaluate its performance on the dataset with different subsets of features selected; the subset with the best performance was finally selected; 2) ranking methods, that rank the texture features by a numeric value and eliminate all features that do not achieve an adequate score; 3) embedded methods, using the classification itself to measure the importance of features set, hence the feature selected depends on the classifier model used (Fedorov 2012). To identify the best feature selection method for our data, we used selection methods
belonging to each of these categories and in particular we tested:
- subset feature selection: CfsSubsetEval with BestFirst as the search method and using forward, backward and bi-directional directions with both leave-one-out and 10-fold cross-validation;
- Ranking: InfoGainAttributeEval using Ranker as the search method;
- Embedded methods: WrapperSubsetEval using GreedyStepwise as the search method. Each group of selected data was then tested using J48 as supervised ML classifier associated with a
leave-one-out cross-validation. The accuracy of the classifications was assessed using the percentage of correctly classified data and the area under the Receiver Operating Characteristic (ROC) curve was calculated as a measure of accuracy of the ML algorithm. In particular, we aimed to obtain the highest diagnostic performance while employing the smallest number of selected features.
In addition, the diagnostic performance of J48 classifier was compared with that of a senior
radiologist with >20 years-experience in abdominal and adrenal imaging. The radiologist analyzed the in-phase, opposed-phase and T2w images of all 60 patients, blinded to clinical history and final diagnosis, identified adrenal lesions and established a diagnosis (LRA, LPA, NAL) which was recorded by a research assistant. Diagnostic performances of the classifier and radiologist were compared using Mc Nemar’s test. A p value ≤ 0.05 was considered as statistically significant.
Results
The selected features and diagnostic performances with the J48 classifier are reported in Table 1. The most relevant results are as follows:
- Among the different subset feature selection methods tested, the cfsSubsetEvaluator with an associated BestFirst selection method and a forward direction selected 3 features, all
extracted from the OP images: Root Mean Square (RMS_O), Maximum 3D Diameter (Max 3D_Diam) and Long Run Emphasis (LRE_O) obtaining the highest correct classification (73.3% of correctly classified instances) using the J48 classifier and a leave-one-out cross-validation.
- The ranked methods were not suitable for our dataset as too many features reached a high score and were considered not selectable (not shown).
- The WrapperSubsetEvaluator, with an associated GreedyStepwise as selection method and the J48 classifier, selected a total of 4 features: Short Run High Gray Level Emphasis
extracted from the IP images (SRHGLE_in), Mean Intensity and Maximum 3D Diameter extracted from the OP images (Mean Int_opp, Max 3D Diam_opp) and Standard Deviation extracted from the T2w images (SD_T2). Employing such features with J48 classifier, without using MDL corrections, a diagnostic accuracy of 80% was obtained; the resulting decision tree algorithm is shown in Figure 3.
The expert radiologist obtained a diagnostic accuracy of 73% in characterizing adrenal lesions. AUC, sensitivity and specificity of J48 and the expert radiologist for diagnosis of LRA, LPA and NAL are reported in Table 2.
McNemar’s test did not show significant differences in terms of diagnostic performance
between the J48 classifier and the expert radiologist (x2= 4; p=0.13); the number of agreements and disagreements are summarized in Table 3. The confusion matrix for diagnosis of LRA, LPA and NAL according to both J48 classifier and the expert radiologist is shown in Table 4.
Discussion
On the basis of our results, ML algorithm using texture-derived features extracted from unenhanced MR images was useful in characterizing adrenal lesions as compared to a senior
radiologist. Previous authors have evaluated the role of TA employed with a ML approach. Juntu et al studied, from a ML perspective, the performance of several Weka ML classifiers that used TA features extracted from soft tissue tumors in nonenhanced T1-weighted MR images to discriminate between malignant and benign tumors (Juntu 2010); they concluded that ML classifiers trained with TA features are potentially valuable for detecting malignant tumors in T1-weighted MR images. They also compared the diagnostic accuracy of the classifier with that of an expert radiologist, finding that the former performed better with a higher classification accuracy. More recently, Waugh and colleagues evaluated whether MR TA could be useful in non-invasive breast cancer subtype classification. They found that entropy features can differentiate between histological and
immunohistochemical subtypes of breast cancer, suggesting that TA of breast cancer potentially provides additional information for decision making (Waugh 2016). A ML software employing MR texture features has been also used in the head and neck field by Dang, who found that MR imaging TA correctly predicted p53 status in oropharyngeal squamous cell carcinoma with ~80% of
diagnostic accuracy (Dang 2015). Regarding adrenal imaging, previous authors have evaluated the role of histogram analysis to characterize adrenal lesions on CT images (Halefoglu 2010) while only in one study this technique was applied to MR images, particularly to differentiate adrenal adenomas from pheochromocytomas on ADC maps, showing that histogram-derived parameters extracted from ADC maps could be useful for this purpose (Umanodan 2017); to the best of our knowledge, this is the first report describing TA with a ML approach for differential diagnosis of adrenal lesions using T2-weighted, in-phase and opposed-phase MR images. We decided to perform the analysis only on unenhanced MR images as we intended to propose a faster and noninvasive diagnostic MR imaging method able to characterize adrenal lesions, in the light of the potential safety issues related to the use of gadolinium-based contrast agents (Gulani 2017).In this setting, all the unenhanced sequences resulted useful for differential diagnosis of adrenal lesion as at least one of the selected features with the highest diagnostic performance was extracted from each of them. Of interest is that, based on the tree algorithm generated by our analysis, the first feature to evaluate is the Maximum 3D diameter; this criterion has also a clinical correlation as lesion size is considered as a reliable parameter to classify non-adenoma lesions.
As several concerns have arisen from the recent advances in the application of TA on medical images, we aimed to also compare the diagnostic performance of the J48 classifier with that of a senior radiologist with >20 years of experience in abdominal and adrenal imaging. The senior radiologist correctly classified the 73% of cases, performing worse than the J48 classifier that correctly classified the 80% of cases. Even if this difference was not statistically significant at McNemar’s test, the J48 classifier still showed a higher classification accuracy compared to the expert radiologist’s performance. Our results suggest that TA may be a useful diagnostic tool to characterize adrenal lesions at MR, particularly in differentiating LPA from NAL which represents
the most relevant topic in adrenal imaging.
In our perspective, this tool could help radiologist to express the probability of an adrenal lesion to belong to each of the three categories (LRA, LPA and NAL), therefore clinicians could be more accurately directed towards a more conservative approach (i.e. instrumental follow-up) or a more interventional (i.e. biopsy or surgical excision) one. To promote an easier and rapid implementation in the clinical practice, we selected the lowest possible number of texture features while
maintaining the highest diagnostic accuracy.
Limitations of this study are represented by: 1) relatively small sample; 2) cross-validation of the J48 classifier was conducted with a leave-one-out method using the same patient dataset: a definitive validation using a different set population would beadvantageous; 3) differentiation among LRA and LPA was assessed using a qualitative diagnostic criterion in evaluating in and opposed phase images, since a quantitative cut-off values of signal intensity drop at 3T have not been established yet (Nakamura 2012); nevertheless, qualitative method is the most widely used and is considered as reliable as quantitative imaging analysis (Korobkin 1995, Heinz-Peer 1999, Ream 2015); 4) enhanced images were not included in our study and thus a) the potential role of TA on these images was not investigated and b) the expert radiologist did not assess post-contrast adrenal lesion behavior that is instead often provided in clinical practice. A larger study, possibly involving different centers with both 1.5 and 3T MR scanners from different vendors, could solve many of the above-mentioned limitations and is needed to confirm our promising results before application of ML algorithms in the clinical setting to characterize adrenal lesions.
In conclusion, TA applied to MR unenhanced images using a ML approach may be useful to characterize adrenal lesions and could represent a valuable tool to assist radiologists in the
Prediction of tumor grade and nodal involvement in oral cavity and oropharynx squamocellular carcinoma
Cancers of the oral cavity (OC) and oropharynx (OP) arise from the uppermost part of the digestive tract with a reported incidence of 2.1% and 1%, respectively (Ferlay 2008), causing significant mortality and morbidity despite clinical advances enable their early diagnosis and
treatment. Well recognized risk factors of cancer of the OC and OP are smoking, alcohol and sexual behavior (Rettig 2015). Once detected by clinical and/or endoscopic examination, imaging is
required for tumor staging in order to establish the most appropriate treatment strategy. Surgery is the first choice at early stages (I and II), while a combination of chemotherapy and radiotherapy is recommended in advanced stages (III and IV) (Gregoire 2010), depending on tumor size and the presence of metastatic lymph-nodes; along with nodal involvement, tumor grade is reported as independent predictor of distant metastases, both having therefore a role in determining patients who may benefit from systemic treatment (Fortin 2001). Moreover, the presence of metastatic lymph nodes is considered the single most important negative predicting factor, reducing, when present, overall 5-year survival by 50%. In this setting, additionally to ultrasound, CT and MR, advanced imaging techniques (i.e. diffusion weighted imaging, perfusion CT), have been employed to identify non-enlarged, positive lymph nodes in head and neck cancer patients (Bisdas 2007, Jin 2016, Trojanowska 2012). However, even if promising, the role of these new modalities still has to be established.
Regarding head and neck cancer imaging, TA and ML applied to CT, PET or MR images were proved to be reliable in predicting Human Papilloma Virus (HPV) status (Buch 2015, Fujita 2016), p53 mutation (Dang 2015), local treatment (Kuno 2017) as well as patient failure (Vallieres 2017) and overall survival (Zhang 2013). In this perspective, we performed a ML analysis using CT-derived texture features in patients with stage I-II OC and OP SCC candidate to surgical excision, to assess whether this approach may predict tumor grade and nodal involvement and potentially
Materials and Methods Patient population
This retrospective study was approved by the local Institutional Review Board and written informed consent was waived. From our database, all CT examinations performed between January 2014 and December 2016 for pre-operative staging of patients with head and neck SCC were selected (n=116). Inclusion criteria were:> 18 years-old patients with OC and OP SCC who performed a contrast-enhanced CT scan at our institution, that subsequently underwent surgical excision (stage I or II) and for whom histological report was available (n=58). Exclusion criteria were the following: patients with tumor recurrence (n=8); CT images affected by motion or beam hardening artifacts by dental implants (n=4); CT examinations in which tumor lesions were not clearly detectable (n=6). Based on these criteria, 40 patients (21 M, mean age 69 ±14 yrs), 33 with OC and 7 with OP carcinoma, were finally included. Of these, 1 was classified as a G1, 12 as G2 and the remaining 27 as G3 lesion at the histopathological examination. For prediction of tumor grade, only the latter two groups were included, due to the presence of a single G1 lesion. In 19 patients, no metastatic lymph-nodes were found after surgery, while 21 cases had metastatic nodal involvement (N1=8, N2=15). Flow-chart of patient selection is reported in Figure 4.
CT acquisition protocol
All patients underwent CT scan of the head and neck, performed with a single multidetector CT scanner (Toshiba Multi-Slice Aquilion 64 system, Toshiba Medical Systems, Tokyo, Japan) after intravenous injection of 100 mL of nonionic iodinated contrast medium (370 mg of iodine per milliliter (Iopamidol), Iopamiroâ 370; Bracco Imaging S.p.A.) at a flow rate of 3 mL/sec with imaging delayed until 80 seconds after initiation of contrast medium injection. Scan parameters were 120 kV; 300 mAs; rotation time=0.5 second; pitch=1; collimation= 0.5 mm using a standard smoothing algorithm for axial image reconstruction; section thickness=2.5 mm; and intervals= 2.5
mm. A 250 × 250 mm field of view and 512 × 512 pixel matrix size were used for an average pixel size of approximately 0.5 × 0.5 mm on the x-axis and y-axis and 2.5 mm on the z-axis. Images were reviewed in soft-tissue algorithms.
Texture analysis
Lesion analysis was performed using a previously established image post-processing software (Romeo 2018). CT images were imported on a dedicated software (ITK-SNAP 3.6.0) for tumor segmentation (Yushkevich 2006). Lesions were identified on post-contrast CT images and manually segmented by drawing a polygonal ROI, further edited with paintbrush tools, excluding necrotic areas by a radiologist with 7 years’ experience in head and neck imaging. An example of ROI positioning is shown in Figure 5. ROIs were analyzed using 3DSlicer, version 4.8, extracting a total of 55 first, second and higher order texture-derived features (Fedorov 2012). The same data-mining software of the previous study (Weka 3.8.2) was then used for preprocessing of these parameters, using various feature selection techniques. A subsequent evaluation of the performance of different supervised ML algorithms in the prediction of tumor grade, nodal involvement and N stage was conducted (Frank 2016). Feature selection was performed using correlation, information gain and learner-based techniques. For the last, C4.5 tree, k-nearest neighbors (k-NN) and locally weighted learning algorithms were employed. These were also used as classifiers, together with Zero Rules (0-R), Random Tree, Random Forest, Support Vector and Naïve Bayesian ones. Since no test population was available, each ML technique was evaluated with a 10-fold cross-validation, iterated 10 times, to predict tumor grade and nodal involvement, in terms of presence/absence of metastatic lymph-nodes in accordance with previous studies (Chang 2018, Taylor 2017); in patients with positive lymph nodes, we also tested the ML classifiers for prediction of N stage (N1 or N2). The 0-R classifier assumes all cases belong to the most common class and was included as a baseline accuracy reference to further evaluate the real-world value of the other prediction
observed in algorithm performance (Nadeau 2003); a p value £ 0.05 was considered statistically significant.
Results
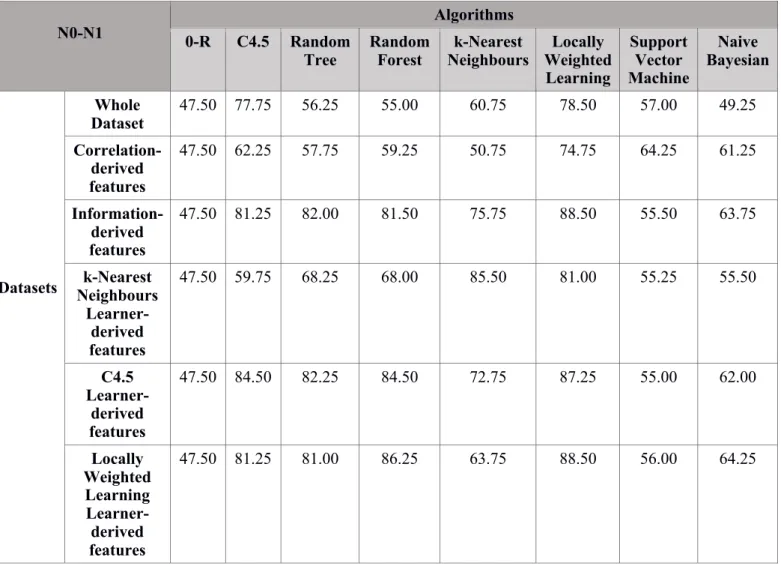
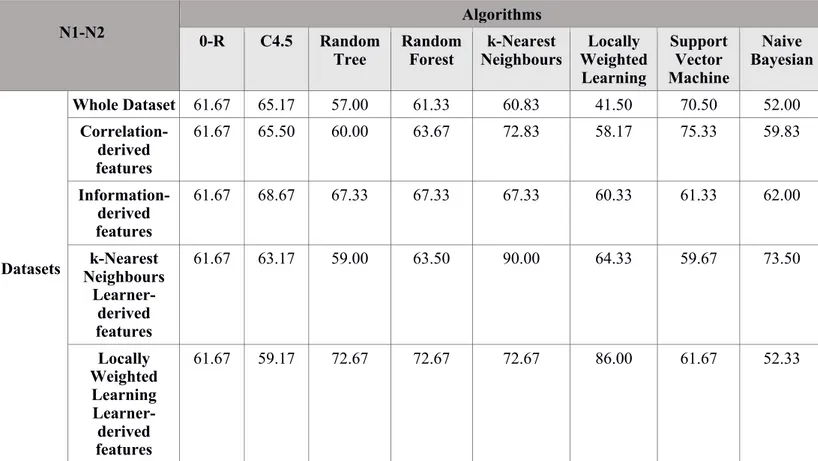
For all class groups, feature subsets that performed better were those derived from the learner-based selection using the k-NN algorithm. Specifically, Root Mean Square and Long Run Emphasis were selected for tumor grade prediction, while Cluster Prominence, Dissimilarity, Long Run Low Gray Level Emphasis (LRLGLE) and LRHGLE were selected for nodal involvement; finally, Range, Mean Deviation, Surface Area, High Gray Level Run Emphasis, Short Run High Gray Level Emphasis, LRLGLE and LRHGLE were selected for N1/N2 stage prediction.
Performances of all classifiers across the different feature combinations derived from data selection for prediction of tumor grade, nodal involvement and nodal status are reported in Tables 5, 6 and 7, respectively. In particular, the k-NN algorithm achieved the best performance in all evaluated tasks with an accuracy, defined as the ratio between correctly classified instanced and all instances, of 91.6 ± 14.04 % for tumor grade prediction, 85.5 ± 19.2% for the assessment of nodal involvement and 90± 19.8 % for the definition of N stage. In all evaluated settings, it performed significantly better than the 0-R classifier that scored 69.17 ± 9.95 %, 47.5 ± 7.54 % and 61.67 ± 19.89 % for grade prediction, nodal involvement and N stage, respectively.
Discussion
According to our results, ML analysis applied to CT-derived texture features was useful to accurately predict tumor grade, the presence of nodal involvement and to define N stage in patients with OC and OP SCC with a diagnostic accuracy of 91.6%, 85.5% and 90%, respectively. TA has been previously found as useful in predicting tumor grade in lung adenocarcinoma and pancreatic neuroendocrine tumor (Canellas 2018, Choi 2018, Liu 2017) as well as to assess mediastinal and cervical lymph node status in lung and thyroid cancer, respectively (Andersen 2016, Pham 2017,
using not only imaging findings but also CT texture features variables such as sphericity, skewness and kurtosis (Choi 2018). Similarly, CT texture features were found predictive of pancreatic
neuroendocrine tumor aggressiveness and possibly useful to identify patients at risk of early disease progression after surgical resection (Canellas 2018). Furthermore, Liu et al extracted TA features from contrast-enhanced CT images of patients with lung adenocarcinoma that were useful in predicting pathologic grade (Liu 2017). Regarding the assessment of lymph node involvement, a diagnostic accuracy of 70% in classifying benign and malignant mediastinal lymph nodes in lung cancer patients has been described using TA features extracted by unenhanced CT images (Pham 2017). Similarly, Andersen and colleagues found a statistically significant difference between CT texture features of benign and malignant lymph nodes in patients with non-small cells lung carcinoma Andersen 2016. TA has been also applied to ultrasound images, showing a diagnostic accuracy of 98.8% in classifying tumor free and metastatic cervical lymph nodes in patients with papillary thyroid carcinoma (Ardakani 2018). Differently from our study, these authors extracted texture features directly from detected lymph nodes on CT or ultrasound images; according to our experience, useful data regarding the possibility of nodal involvement could be obtained even from the primary tumor mass, probably related to tumor heterogeneity and aggressiveness. Both tumor grade and nodal involvement are well recognized prognostic factors in terms of presence/absence of distant metastasis in head and neck cancer patients. As a consequence, providing pre-treatment data concerning tumor grade and the possibility of lymph node involvement using a routinely used imaging technique may have a significant impact on therapeutic strategies and clinical outcome. In particular, the presence of a metastatic lymph node on one side of the neck reduces the 5-year survival rate by 50%, and the presence of a metastatic node on both sides of the neck reduces the survival rate by further 25% (Trojanowska 2012). Considering this we decided, despite the
relatively low number of patients, to stratify patients with positive lymph nodes in those classified as N1 (unilateral positive lymph nodes) or N2 (contralateral positive lymph nodes) and to
As selection features method, we decided to use the learner-based technique, which allows to identify features that best perform with a selected classifier, based on the previous experience (Romeo 2018). Using this feature selection method and k-NN classifier, also employed as ML method, we obtained the highest diagnostic accuracy, thus suggesting the employment of this classifier for future studies in this topic, preferably conducted on larger patient population. To the best of our knowledge, this is the first study assessing tumor grade and lymph node
involvement in head and neck cancer. In this field, TA has been previously applied on CT images to assess its reliability in predicting HPV status (Buch 2015, Fujita 2016). The authors found
statistically significant differences in texture features between HPV positive and negative patients with OP tumors, thus suggesting this technique as an adjunct to the evaluation of HPV status. The potential of radiomics applied to PET-CT and CT images has been also reported in assessing the risk of specific tumor outcomes, in terms of locoregional recurrence and distant metastases (Vallieres 2017). In a recent study, Dang and colleagues analyzed MR images of 16 patients with OP carcinoma using TA, showing a diagnostic accuracy of 80% in predicting p53 status (Dang 2015). Regarding the employment of TA in predicting head and neck patients’ outcome, pre-treatment CT images of 62 patients with head and neck cancer who underwent chemo-radiotherapy were analyzed in a recent study (Kuno 2017), showing that CT texture parameters were associated with local failure. Similarly, a population of 72 patients with head and neck carcinoma candidate to induction chemotherapy was evaluated using CT texture and histogram analysis of the primary tumor mass to predict the prognosis (Zhang 2013). Authors found that CT texture and histogram analysis parameters were associated with overall survival.
Our investigation expands the current knowledge about the use of TA in head and neck patients showing that such approach, in combination with specific ML algorithms, allows for an accurate prediction not only of tumor grade, but also of nodal involvement and N grade. Nevertheless, the study is not free from limitations, mainly represented by the small sample size. This low number of patients included in our study led also to the embrace of a 10-fold cross validation on the same patient dataset, since no different set population was available. For these reasons, future multicenter
studies are strongly warranted to confirm our preliminary results. ML analysis using contrast-enhanced CT TA applied to primary tumor lesions in patients with OC and OP may represent a reliable tool in predicting tumor grade and nodal involvement; it could also have a role in defining the most appropriate surgical strategies and in identifying patients at risk of tumor recurrence.
Conclusion
Our results are in accordance with the current literature supporting the potential use of ML software employing TA-derived features for the differential diagnosis of solid lesions as well as for the prediction of histological features and the presence of nodal metastases in oncologic patients. The proven potential of ML to provide quantitative imaging biomarkers as well as the fast development of this technique will probably lead to its clinical implementation in radiological practice. Given the main limitation of our investigations represented by the lack of an external population to test and validate the identified algorithms, further studies are needed to establish and validate the role of TA and ML in the presented topics.
Reference
- Andersen MB, Harders SW, Ganeshan B, et al. CT texture analysis can help differentiate between malignant and benign lymph nodes in the mediastinum in patients suspected for lung cancer. Acta Radiol 2016;57:669-676.
- Ardakani A, Rasekhi A, Mohammadi A, et al. Differentiation between metastatic and tumour-free cervical lymph nodes in patients with papillary thyroid carcinoma by grey-scale sonographic texture analysis. Polish Journal of Radiology 2018;83:37-46.
- Bisdas S, Baghi M, Smolarz A, et al. Quantitative measurements of perfusion and permeability of oropharyngeal and oral cavity cancer, recurrent disease, and associated lymph nodes using first-pass contrast-enhanced computed tomography studies. Invest Radiol 2007;42:172-179.
- Blake MA, Cronin CG, Boland GW. Adrenal imaging. AJR Am J Roentgenol. 2010
Jun;194(6):1450-60. doi: 10.2214/AJR.10.4547. Review. Erratum in: AJR Am J Roentgenol 2012;198:1232.
- Buch K, Fujita A, Li B, et al. Using Texture Analysis to Determine Human Papillomavirus Status of Oropharyngeal Squamous Cell Carcinomas on CT. AJNR Am J Neuroradiol 2015;36:1343-1348.
- Canellas R, Burk KS, Parakh A, et al. Prediction of Pancreatic Neuroendocrine Tumor Grade Based on CT Features and Texture Analysis. AJR Am J Roentgenol 2018;210:341-346.
- Chang P, Grinband J, Weinberg BD, et al. Deep-Learning Convolutional Neural Networks Accurately Classify Genetic Mutations in Gliomas. AJNR Am J Neuroradiol 2018;39:1201-1207.
- Choi TW, Kim JH, Yu MH, et al. Pancreatic neuroendocrine tumor: prediction of the tumor grade using CT findings and computerized texture analysis. Acta Radiol 2018;59:383-392
- Choy G, Khalilzadeh O, Michalski M, Do S, Samir AE, Pianykh OS, Geis JR, Pandharipande PV, Brink JA, Dreyer KJ. Current Applications and Future Impact of Machine Learning in Radiology. Radiology. 2018 Aug;288(2):318-328.
doi:10.1148/radiol.2018171820.
- Chung JJ, Semelka RC, Martin DR. Adrenal adenomas: characteristic post-gadolinium capillary blush on dynamic MR imaging. J Magn Reson Imaging 2001;13:242-248.
- Coroller TP, Grossmann P, Hou Y, Rios Velazquez E, Leijenaar RT, Hermann G, Lambin P, Haibe-Kains B, Mak RH, Aerts HJ. CT-based radiomic signature predicts distant metastasis in lung adenocarcinoma. Radiother Oncol. 2015 Mar;114(3):345-50. doi:
10.1016/j.radonc.2015.02.015.
- Dang M, Lysack JT, Wu T, et al. MRI texture analysis predicts p53 status in head and neck squamous cell carcinoma. AJNR Am J Neuroradiol 2015;36:166-170.
- De Cecco CN, Ganeshan B, Ciolina M, Rengo M, Meinel FG, Musio D, De Felice F, Raffetto N, Tombolini V, Laghi A. Texture analysis as imaging biomarker of tumoral response to neoadjuvant chemoradiotherapy in rectal cancer patients studied with 3-T magnetic resonance. Invest Radiol. 2015 Apr;50(4):239-45. doi:
10.1097/RLI.0000000000000116.
- Eibe Frank, Mark A. Hall, and Ian H. Witten (2016). The WEKA Workbench. Online Appendix for "Data Mining: Practical Machine Learning Tools and Techniques", Morgan Kaufmann, Fourth Edition, 2016.
- Erickson BJ, Korfiatis P, Akkus Z, Kline TL. Machine Learning for Medical Imaging. Radiographics 2017;37:505-515.
- Fedorov A, Beichel R, Kalpathy-Cramer J, et al. 3D Slicer as an image computing platform for the Quantitative Imaging Network. Magn Reson Imaging 2012;30:1323-1341
GLOBOCAN 2008. Int J Cancer 2010;127:2893-2917.
- Fortin A, Couture C, Doucet R, et al. Does histologic grade have a role in the management of head and neck cancers? J Clin Oncol 2001;19:4107-4116.
- Frank E, Hall M, Witten I. The WEKA Workbench: Online Appendix for “Data Mining: Practical Machine Learning Tools and Techniques”. In: Kaufmann M, ed. Fourth Edition ed; 2016.
- Fujita A, Buch K, Li B, et al. Difference Between HPV-Positive and HPV-Negative Non-Oropharyngeal Head and Neck Cancer: Texture Analysis Features on CT. J Comput Assist Tomogr 2016;40:43-47.
- Ganeshan B, Goh V, Mandeville HC, Ng QS, Hoskin PJ, Miles KA. Non-small cell lung cancer: histopathologic correlates for texture parameters at CT. Radiology. 2013
Jan;266(1):326-36. doi: 10.1148/radiol.12112428.
- Gillies RJ, Kinahan PE, Hricak H. Radiomics: Images Are More than Pictures, They Are Data. Radiology. 2016 Feb;278(2):563-77. doi: 10.1148/radiol.2015151169.
- Gregoire V, Lefebvre JL, Licitra L, et al. Squamous cell carcinoma of the head and neck: EHNS-ESMO-ESTRO Clinical Practice Guidelines for diagnosis, treatment and follow-up. Ann Oncol 2010;21 Suppl 5:v184-186.
- Gulani, V., Calamante, F., Shellock, F. G., Kanal, E., Reeder, S. B., & International Society for Magnetic Resonance in Medicine. Gadolinium deposition in the brain: summary of evidence and recommendations. The Lancet Neurology 2017; 16:564-570.
- Halefoglu AM, Bas N, Yasar A, Basak M. Differentiation of adrenal adenomas from nonadenomas using CT histogram analysis method: a prospective study. Eur J Radiol 2010;73:643-651.
Roentgenol 1999;173: 15- 22.
- Holli K, Lääperi AL, Harrison L, Luukkaala T, Toivonen T, Ryymin P, Dastidar P, Soimakallio S, Eskola H. Characterization of breast cancer types by texture analysis of magnetic resonance images. Acad Radiol. 2010 Feb;17(2):135-41. doi:
10.1016/j.acra.2009.08.012.
- Jin GQ, Yang J, Liu LD, et al. The diagnostic value of 1.5-T diffusion-weighted MR imaging in detecting 5 to 10 mm metastatic cervical lymph nodes of nasopharyngeal carcinoma. Medicine (Baltimore) 2016;95:e4286.
- Juntu J, Sijbers J, De Backer S, Rajan J, Van Dyck D. Machine learning study of several classifiers trained with texture analysis features to differentiate benign from malignant soft-tissue tumors in T1-MRI images. J Magn Reson Imaging 2010;31:680-689.
- Korivi BR, Elsayes KM. Cross-sectional imaging work-up of adrenal masses. World J Radiol 2013;5:88-97.
- Korobkin M, Lombardi TJ, Aisen AM et al. Characterization of adrenal masses with chemical shift and gadolinium-enhanced MR imaging. Radiology 1995; 197:411-418 - Kuno H, Qureshi MM, Chapman MN, et al. CT Texture Analysis Potentially Predicts Local
Failure in Head and Neck Squamous Cell Carcinoma Treated with Chemoradiotherapy. AJNR Am J Neuroradiol 2017;38:2334-2340.
- Liu Y, Liu S, Qu F, et al. Tumor heterogeneity assessed by texture analysis on contrast-enhanced CT in lung adenocarcinoma: association with pathologic grade. Oncotarget 2017;8:53664-53674.
- Maurea S, Imbriaco M, D'Angelillo M, Mollica C, Camera L, Salvatore M. Diagnostic accuracy of chemical-shift MR imaging to differentiate between adrenal adenomas and non adenoma adrenal lesions. Radiol Med 2006; 111:674-686.
Parameters in Thyroid Cancer - A First Preliminary Study. Transl Oncol. 2017 Dec;10(6):911-916. doi: 10.1016/j.tranon.2017.09.003.
- Nadeau C, Bengio Y. Inference for the Generalization Error. Machine Learning 2003;53:239-281.
- Nakamura S, Namimoto T, Morita K, et al. Characterization of adrenal lesions using chemical shift MRI: comparison between 1.5 Tesla and two echo time pair selection at 3.0 Tesla MRI. J Magn Reson Imaging 2012;35: 95-102.
- Ng F, Ganeshan B, Kozarski R, Miles KA, Goh V. Assessment of primary colorectal cancer eterogeneity by using whole-tumor texture analysis: contrast-enhanced CT texture as a biomarker of 5-year survival. Radiology. 2013 Jan;266(1):177-84. doi:
10.1148/radiol.12120254.
- Pham TD, Watanabe Y, Higuchi M, et al. Texture Analysis and Synthesis of Malignant and Benign Mediastinal Lymph Nodes in Patients with Lung Cancer on Computed Tomography. Sci Rep 2017;7:43209.
- Ream JM, Gaing B, Mussi TC, Rosenkrantz AB. Characterization of adrenal lesions at chemical-shift MRI: a direct intraindividual comparison of in- and opposed-phase imaging at 1.5 T and 3 T. Am J Roentgenol 2015; 204: 536–541.
- Remco R. Bouckaert, Eibe Frank, Mark A. Hall. Geoffrey Holmes, Bernhard Pfahringer, Peter Reutemann, and Ian H. Witten. WEKA-experiences with a java open-source project. Journal of Machine Learning Research 2010; 11:2533-2541.
- Remer EM, Motta-Ramirez GA, Shepardson LB, Hamrahian AH, Herts BR. CT histogram analysis in pathologically proven adrenal masses. AJR Am J Roentgenol 2006;187:191-196. - Rettig EM, D'Souza G. Epidemiology of head and neck cancer. Surg Oncol Clin N Am
MRI Using Texture Analysis: A Machine-Learning Approach. J Magn Reson Imaging 2018;48:198-204.
- Song JH, Chaudhry FS, Mayo-Smith WW. The incidental adrenal mass on CT: prevalence of adrenal disease in 1,049 consecutive adrenal masses in patients with no known
malignancy. AJR Am J Roentgenol 2008;190:1163-1168.
- Taylor JC, Fenner JW. Comparison of machine learning and semi-quantification algorithms for (I123)FP-CIT classification: the beginning of the end for semi-quantification? EJNMMI Phys 2017;4:29.
- Tixier F, Le Rest CC, Hatt M, Albarghach N, Pradier O, Metges JP, Corcos L, Visvikis D. Intratumor heterogeneity characterized by textural features on baseline 18F-FDG PET images predicts response to concomitant radiochemotherapy in esophageal cancer. J Nucl Med. 2011 Mar;52(3):369-78. doi:10.2967/jnumed.110.082404.
- Trojanowska A, Trojanowski P, Bisdas S, et al. Squamous cell cancer of hypopharynx and larynx - evaluation of metastatic nodal disease based on computed tomography perfusion studies. Eur J Radiol 2012;81:1034-1039.
- Umanodan T, Fukukura Y, Kumagae Y, Shindo T, Nakajo M, Takumi K, Nakajo M, Hakamada H, Umanodan A, Yoshiura T. ADC histogram analysis for adrenal tumor
histogram analysis of apparent diffusion coefficient in differentiating adrenal adenoma from pheochromocytoma. J Magn Reson Imaging 2017;45:1195-1203.
- Vallières M, Freeman CR, Skamene SR, El Naqa I. A radiomics model from joint FDG-PET and MRI texture features for the prediction of lung metastases in soft-tissue sarcomas of the extremities. Phys Med Biol. 2015 Jul 21;60(14):5471-96. doi:
10.1088/0031-9155/60/14/5471.
- Vallieres M, Kay-Rivest E, Perrin LJ, et al. Radiomics strategies for risk assessment of tumour failure in head-and-neck cancer. Sci Rep 2017;7:10117.
- Waugh SA, Purdie CA, Jordan LB, Vinnicombe S, Lerski RA, Martin P, Thompson AM. Magnetic resonance imaging texture analysis classification of primary breast cancer. Eur Radiol 2016;26:322-330.
- Yushkevich PA, Piven J, Hazlett HC, et al. User-guided 3D active contour segmentation of anatomical structures: significantly improved efficiency and reliability. Neuroimage
2006;31:1116-1128.
- Zhang H, Graham CM, Elci O, et al. Locally advanced squamous cell carcinoma of the head and neck: CT texture and histogram analysis allow independent prediction of overall
Figures Figure 1
Figure 2
Fig. 2 Example of spherical VOIs positioning in an adrenal lesion on T2-weighted (A), In-phase (B) and Opposed-phase (C) images.
Figure 3
Fig. 3 Flow-chart of the J48 algorithm showing selected features and relative cutoff values for the diagnosis of Lipid-Rich Adenomas (LRA), Lipid-Poor Adenomas (LPA) and Non-Adenoma Lesions (NAL). The sequence from which each feature was derived is reported in parenthesis as IP for in-phase images, OP for opposed phase images and T2 for T2-weighted images.
Figure 4
Fig. 4 Flow-chart of patient selection. SCC=squamo-cellular carcinoma, OC=oral cavity, OP=oropharynx
Figure 5
Fig. 5 Examples of tumor segmentation. Axial contrast-enhanced CT images of oral cavity (A) and oropharynx (C) tumor lesions, along with the corresponding hand-drawn regions of interest
Tables
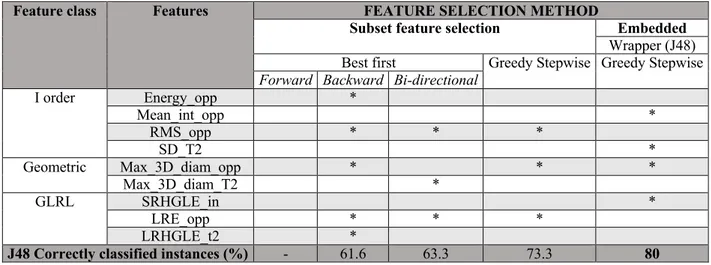
Table 1. Results of the different feature selection methods and relative performances using J48 classifier. For each method are reported the corresponding selected features (specified with *).
Feature class Features FEATURE SELECTION METHOD
Subset feature selection Embedded
Wrapper (J48) Best first Greedy Stepwise Greedy Stepwise
Forward Backward Bi-directional
I order Energy_opp * Mean_int_opp * RMS_opp * * * SD_T2 * Geometric Max_3D_diam_opp * * * Max_3D_diam_T2 * GLRL SRHGLE_in * LRE_opp * * * LRHGLE_t2 *
J48 Correctly classified instances (%) - 61.6 63.3 73.3 80
Note: Energy_opp= energy extracted from the opposed phase images, Mean_int_opp= Mean Intensity extracted from the opposed phase images, RMS_opp” = Root Mean Square extracted from the opposed phase images, SD_T2= Standard deviation extracted from the T2 weighted images, Max_3D_diam_opp= Maximun 3D Diameter extracted from the opposed phase images, Max_3D_diam_T2= Maximun 3D Diameter extracted from the T2 weighted images,
SRHGLE_in= Short Run High Gray Level Emphasis extracted from the IP images, LRE_opp= Long Run Emphasis extracted from the opposed phase images, LRHGLE_T2= Short Run High Gray Level Emphasis extracted from the T2 weighted images, AUC=Area Under the Curve, CI= Confidence Interval, LRA= Lipid Rich Adenoma, LPA=Lipid Poor Adenoma, NAL=Non-Adenoma Lesion
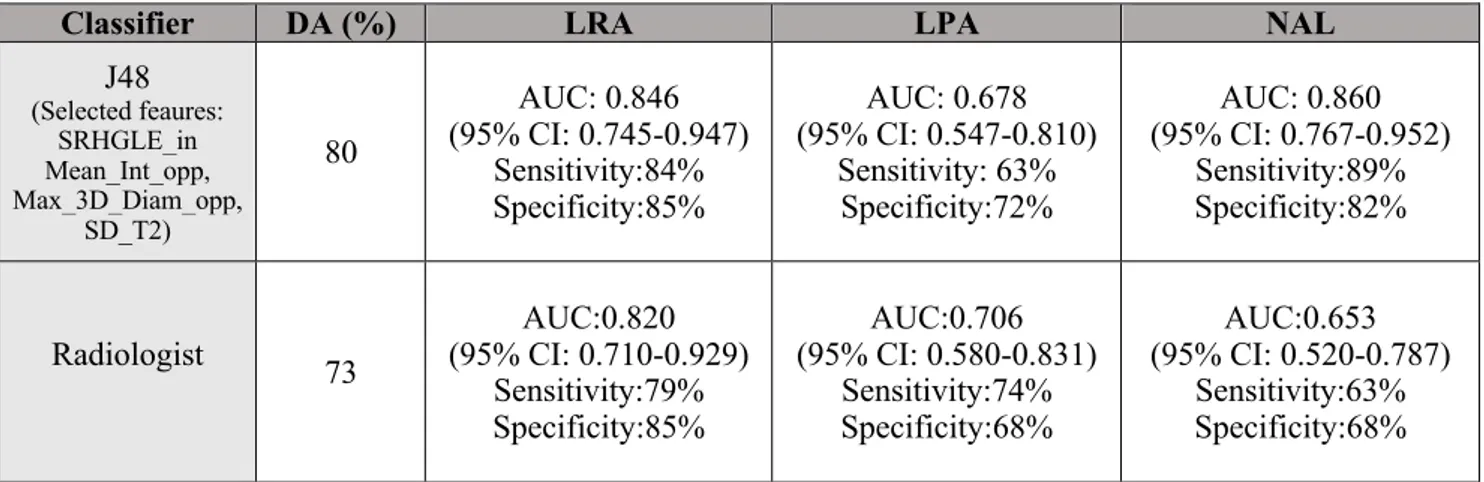
Table 2. AUC values for diagnosis of LRA, LPA and NAL employing the most accurate feature selection with J48 classifier.
Classifier DA (%) LRA LPA NAL
J48 (Selected feaures: SRHGLE_in Mean_Int_opp, Max_3D_Diam_opp, SD_T2) 80 AUC: 0.846 (95% CI: 0.745-0.947) Sensitivity:84% Specificity:85% AUC: 0.678 (95% CI: 0.547-0.810) Sensitivity: 63% Specificity:72% AUC: 0.860 (95% CI: 0.767-0.952) Sensitivity:89% Specificity:82% Radiologist 73 AUC:0.820 (95% CI: 0.710-0.929) Sensitivity:79% Specificity:85% AUC:0.706 (95% CI: 0.580-0.831) Sensitivity:74% Specificity:68% AUC:0.653 (95% CI: 0.520-0.787) Sensitivity:63% Specificity:68%
Note: DA= Diagnostic Accuracy, AUC=Area Under the Curve, LRA= Lipid Rich Adenoma, LPA=Lipid Poor Adenoma, NAL=Non-Adenoma Lesion, SRHGLE_in= Short Run High Gray Level Emphasis extracted from the IP images, Mean_int_opp= Mean Intensity extracted from the opposed phase images, Max_3D_diam_opp= Maximun 3D Diameter extracted from the opposed phase images, SD_T2= Standard Deviation extracted from the T2 weighted images, CI=
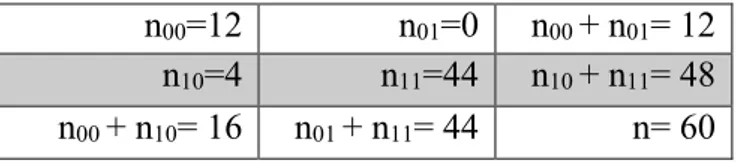
Table 3. Table for comparison of J48 classifier and the Radiologist diagnosis with McNemar’s test; n00=12 is the number of adrenal lesions misclassified by both the J48 classifier and the radiologist, n01=0 is the number of adrenal lesions that were correctly classified by the radiologist and
misclassified by the J48 classifier, n10=4 is the number of adrenal lesions that were correctly classified by the J48 classifier and misclassified by the radiologist, n11=44 is the number of adrenal lesions that were correctly classified by both the J48 classifier and the radiologist
n00=12 n01=0 n00 + n01= 12
n10=4 n11=44 n10 + n11= 48
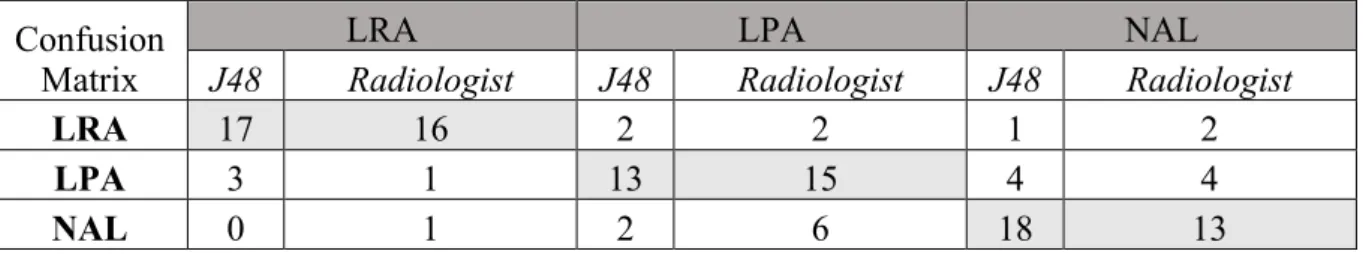
Table 4. Confusion matrix for diagnosis of LRA, LPA and NAL according to J48 classifier and the expert radiologist.
Confusion Matrix
LRA LPA NAL
J48 Radiologist J48 Radiologist J48 Radiologist
LRA 17 16 2 2 1 2
LPA 3 1 13 15 4 4
NAL 0 1 2 6 18 13
Table 5. Accuracy of machine learning algorithms across all datasets in the classification of G2 and G3 lesions. Note: 0-R= Zero Rules
G2-G3 0-R C4.5 Random Algorithms
Tree Random Forest Neighbours k-Nearest Weighted Locally Learning Support Vector Machine Naive Bayesian Datasets Whole Dataset 69.17 55.58 59.50 64.75 60.50 60.83 61.92 53.42 Correlation-derived features 69.17 57.75 65.00 62.00 67.25 67.83 68.08 58.50 k-Nearest Neighbours Learner-derived features 69.17 59.50 79.42 79.33 91.58 69.83 69.17 65.25 Locally Weighted Learning Learner-derived features 69.17 67.42 70.50 70.50 70.50 76.67 69.17 71.58
Table 6. Accuracy of machine learning algorithms across all datasets in the classification of nodal involvement presence or absence. Note: 0-R= Zero Rules
N0-N1 0-R C4.5 Random Algorithms
Tree Random Forest Neighbours k-Nearest Weighted Locally Learning Support Vector Machine Naive Bayesian Datasets Whole Dataset 47.50 77.75 56.25 55.00 60.75 78.50 57.00 49.25 Correlation-derived features 47.50 62.25 57.75 59.25 50.75 74.75 64.25 61.25 Information-derived features 47.50 81.25 82.00 81.50 75.75 88.50 55.50 63.75 k-Nearest Neighbours Learner-derived features 47.50 59.75 68.25 68.00 85.50 81.00 55.25 55.50 C4.5 Learner-derived features 47.50 84.50 82.25 84.50 72.75 87.25 55.00 62.00 Locally Weighted Learning Learner-derived features 47.50 81.25 81.00 86.25 63.75 88.50 56.00 64.25
Table 7. Accuracy of machine learning algorithms across all datasets in the classification of N1 and N2 nodal status. Note: 0-R= Zero Rules
N1-N2 0-R C4.5 Random Algorithms Tree Random Forest k-Nearest Neighbours Locally Weighted Learning Support Vector Machine Naive Bayesian Datasets Whole Dataset 61.67 65.17 57.00 61.33 60.83 41.50 70.50 52.00 Correlation-derived features 61.67 65.50 60.00 63.67 72.83 58.17 75.33 59.83 Information-derived features 61.67 68.67 67.33 67.33 67.33 60.33 61.33 62.00 k-Nearest Neighbours Learner-derived features 61.67 63.17 59.00 63.50 90.00 64.33 59.67 73.50 Locally Weighted Learning Learner-derived features 61.67 59.17 72.67 72.67 72.67 86.00 61.67 52.33