1
Immigrant groups’ income inequality within and across Italian regions
Chiara Mussida and Maria Laura Parisi
Abstract
The relationship between Italian regional income inequality and the phenomenon of migration is still under current debate. Policymakers and researchers worry about the process of assimilation of the new entrants, in a country where regional disparities are strong. We provide evidence that regional income disparities apply to groups of immigrants as well as of nationals, but the most important source of inequality rests on within-immigrant group/within-region, especially for those households with the presence of women and very young children. However, if bottom incomes were to grow, inequality would not diminish, with the exception of married individuals living in the North, for no other characteristic is correlated to inequality according to the Atkinson bottom sensitive index. We show that the uneven economic development across regions then influences the distribution of immigration both in socio-demographic and economic terms.
JEL Classification codes: D31, F22, O15
Keywords: regional income inequality, household income inequality, income distribution, migration
Corresponding author: Assistant Professor, Department of Economic and Social Sciences, Università Cattolica del Sacro Cuore, via Emilia Parmense, 84, Piacenza, 29122, Italy, tel. +39 0523 599440, e-mail: [email protected].
Associate Professor of Economics at Department of Economics and Management, University of Brescia, via San Faustino 74/b, 25122, Brescia, Italy, [email protected].
2
1. Introduction
The debate on whether regional economic disparities in Italy come from different sources goes back to the 1970s, when the first flows of international migrants added to inter-regional flows. The discussion about the process of assimilation of foreigners into the country (Ambrosini 2001) was thus initiated. The concept of ‘assimilation’ is very general and ranges from accumulating language skills to improving one’s own qualifications and achieving better knowledge of labor market institutions, as well as
depending on the length of stay and economic needs of individual immigrant (Fullin and Reyneri 2011). Consequently, it has an impact on the employment/unemployment status, earning capacity and at a more aggregate level, on income inequality within a region or a country. The objective of this paper is to provide more evidence on income inequality within (and between) immigrant groups in Italy, and to show that there is significant correlation between individual characteristics (and their households), pull migration factors and within-group income inequality.
Here we have included evidence not only on the importance of income, employment or geographical residence to produce inequality, but also on other demographic and social features. Women with children, marriage status, education, age, and the relative income are relevant features as well. It remains true nonetheless, that income inequality depends on the degree of economic development of the macro region of residence. Concerns therefore arise not only because specific individual features have higher probability to contribute to increase within-region inequality, but also because individuals choosing to live in a region may fall into a poverty “trap” within their own community.1
Interestingly, from an analytical point of view, estimated correlations change with measures of inequality. The Gini index and more sensitive measures to parts of the income distribution provide
1 In our analyses, we are able to assess whether there is significant correlation with income inequality but we are not able to identify a causal relationship.
3
different conclusions both in terms of inequality “size” and of its correlation to specific individual features. There might be two opposite effects of migration on income inequality. On one hand, international migrants in Italy come from less developed countries, they are on average less skilled and less qualified than nationals and for this reason suffer from a lower initial level of social and economic inclusion, downgrading their expectations (see e.g., Faini et al. 2009). Accordingly, their presence in Italy contributes to increase the country’s income inequality, independently on the region of destination.
On the other hand, migrants try to acquire skills and education, at least for their children, when coming to Italy; they improve their economic conditions also through entrepreneurial activities, reducing the income gap with nationals or with their own established immigration group (Baycan-Levent and Nijkamp, 2009; Codura Martìnez et al., 2013). The latter effect might dominate especially in more developed or fast-growing regions of the country. Indeed, the uneven economic development of Italian regions influences the distribution and the “quality” of immigration (Einaudi 2007).
There are a few interesting studies that attempt to address the issue of integration (e.g., Allasino et al. 2004; Barone and Mocetti 2011; Ottaviano and Peri 2012; Saraceno et al. 2013; Venturini and Villosio 2006, 2008, 2017) discussing disparities in labour market outcomes and assimilation (for wage assimilation of immigrants see Strom et al. 2017). The incorporation of immigrants into the Italian labour market is indeed quite problematic. Immigrants show on average lower returns to human capital compared to natives (Dell’Aringa et al. 2015) and this does not contribute to achieve access to high-payment occupations, as opposed to unskilled and/or semi-skilled manual jobs (Fullin and Reyneri 2011).
The recent empirical paper by D’Agostino et al. (2016) deals with the issue of economic integration of immigrants in Italy, analyzing immigrant group inequality and economic stratification. By using a Gini decomposition technique, they found that whereas between-group inequality was quite negligible, the largest share of overall inequality was due to within-group differentials. Immigrants’ choices in terms of work and residence, interestingly, increase income disparities with respect to their
4
own immigration group. Indeed, immigrant groups tend to concentrate in “enclaves” when migrating to foreign countries, and according to the Ethnic Enclave Hypothesis, their labor market and economic performance depends on this concentration (see, for example, Portes and Jensen 1987; Edin et al. 2000; Light and Gold 2000). This hypothesis might be associated with “regional” concentration, at least in Italy, where there seem to be both geographical and job segmentation for foreign workers (Bettio et al. 2006; Reyneri 2004; Venturini and Villosio 2017).
There is consensus among scholars that integrating immigrants in the labour market as well as in the social and legal context could increase social welfare. Our methodology reveals that inequality of opportunity is present for immigrants in Italy. They suffer from inequality of opportunity in the labour market when their educational attainment is compared to that of nationals. This means that there exists a mismatch between their own skills and qualification in the jobs they get unless they are forced to work in the informal market (this is true for certain immigrant group more than others). Moreover, the education system in Italy does not support the children of immigrants in the integration process (Italy was at the 19th place in Europe in the MIPEX index for Education in May 2010, MIPEX III 2011).
From our results, even less equality of opportunity is provided to female immigrants, especially mothers of little children. This is consistent with evidence on Italy (Piazzalunga, 2015) and other European countries (Amuedo-Dorantes and de la Rica 2007), where migrant women have a “double” disadvantage (gender and migrant status) bringing third-country migrant women to experience a lower participation rate and a higher unemployment rate than native-born women and foreign-born men (Rubin et al. 2008). Some of the lessons from Italy might therefore be useful for other countries with a similar immigration pattern, such as Spain or Portugal.
Our research is related to the existing literature on the determinants of migration as well, which suggests that the unemployment rate, the economic structure, the age structure of the population, and disposable income, are among the most relevant pull factors of the migration phenomenon (Venturini
5
2004). In particular, the economic aspects (i.e. income) are the most relevant determinants of migration followed by social, cultural and institutional framework (Etzo 2007).
The unit of observation in our analysis is an ‘immigrant group’ which, following the official definition
provided by the UN Statistics Division (Ratha and Xu 2008), is defined as a group of foreign individuals coming from the same (foreign) nation and residing in Italy. Moreover, the definition of immigrant group has already been used for the Italian case in previous studies (Berti et al. 2014; D’Agostino et al. 2016). The more general concept of ‘ethnicity’, however – which we do not observe in our data - involves
features such as a common and distinctive culture, language, religion, as well as geographical origins (Fenton 1999; Modood et al. 1994; Smedley 1998; Song 2003).
We first documented the presence of immigrant groups across the four macro-regions of Italy (North-West, North-East, Centre and South).2 The CVS cross sectional 2009 data are the only available source of information – at present - of a representative sample of foreigners residing in Italy. Secondly, we discuss whether the presence of different immigrant groups produce income inequality both ‘within’ groups and macro regions and ‘across’ groups and macro regions. General inequality may arise because individuals and households’ incomes are very unequal in the same group (“within-group”) in each macro region (“within-region”), or because of strong disparity of average incomes among different groups (“between-group”) in macro regions (“between-region”).
The former measure considers disaggregated data of the whole population, while the latter involves comparisons at a more aggregate level, with obviously different policy implications.
2 In the CVS-2009 Istat survey there is no household’s information on the single (administrative) region of residence. Nonetheless, macro regions reflect the different levels of economic development across Italian regions, as reported in Table 2. Northern regions’ GDP average growth rate in 2008 is 2.29%, 0.94% in the Centre and 1.28% in the South. Growth rates were decreasing rapidly from previous year and turned negative in 2009. Not only do macro regions have different levels of development but show different resilience to economic shocks.
6
The paper proceeds as follows. Section 2 sketches the main characteristics of migration to Italy over time, focusing on the year of observation, 2008. Section 3 evaluates the size and source of inequality arising from using different measures, for each group, and decomposing aggregate indexes in within and between immigrant groups and regions components. Section 4 shows the correlation estimates between income inequality, migrant characteristics and pull factors. Section 5 concludes.
2. The presence of immigrant groups in Italy
The Italian migration model is characterized by a strong and increasing fragmentation of the groups of immigrants. The Italian Census provides evidence about heterogeneity of the country of origin, in a database gathered by the Italian National Institute of Statistics (ISTAT 2015). The most recent available data refer to the latest 2011 Census of the Italian population.
Fragmentation of the immigrant groups and the related heterogeneity of inflows to Italy are due both to easy access favored by a well-developed communication and transportation system at the international level, and to the absence of past relevant colonial experience or agreements with other countries. The increasing relevance and heterogeneity, therefore, is due to the central and strategic position of Italy in the Mediterranean area (Del Boca and Venturini 2003; Ortega and Peri 2009; Visco 2008).
The first immigration flows, at the end of the 1970s, concentrated on the Mediterranean route. Italy hosted immigrants from Northern Africa and Greece, but also from China, Iran, Philippines and Ethiopia. Things changed during the 1990s, primarily due to the dissolution of the communist regimes, which gave rise to a massive migration from Eastern Europe. Italy became rapidly one of the preferred countries of destination from the Balkans and ex-Soviet Union. The continuous growth of international migration flows since the 2000s implies that migrants are now a significant component of the Italian population. In 2011, foreign residents in Italy represented more than 7% of Italian population (Census data). Immigrants are therefore becoming an important source of population growth and in the future high skilled foreigners
7
might add to overall productivity of the society (D’Agostino et al. 2016). The structure of the foreign
resident population has changed strongly/significantly and rapidly. In general, the gender composition of immigrants is balanced, immigrants are much younger than nationals (migration involves mainly people between 18 and 30 years old), with low levels of education (Morettini et al. 2012). In addition, as explained above, the geographical origin of immigrants is highly heterogeneous.
Table 1 shows which immigrant groups (defined according to their country of origin) prevail in Italy, as confirmed by the Census data3 and by the literature (see Morettini et al. 2011, for instance, for details on the foreign presence in Italy). Table 1 reports the absolute and percentage frequency of the most important immigrant groups in our sample from ISTAT CVS-2009 survey, which includes households with at least one foreign component. It has to be admitted that our analysis has some limitations due to the lack of information on irregular immigration, which is not collected by the official statistical sources. Available data on this segment of population would surely improve the analysis, which currently might be a bit biased in favour of the most settled immigrant population.4
The first group, named “Italy”, includes Italian nationals living in households with at least one foreign
member and residing in the country.5 The following groups are ranked accordingly.
3 Figures from the 2011 and previous years’ ISTAT Census on the Italian population are available on the site http://dati-censimentopopolazione.istat.it/Index.aspx?lang=it.
4 Estimates of irregular immigrants are available from the Fondazione ISMU (Iniziative e Studi sulla Multietnicità). The number of un-registered immigrants in 2011 is about 443000 individuals, who represent approximately 9% of the un-registered migrant population. In Italy, irregular immigration is mostly due to the so called over stayers, i.e. foreigners entering Italy with a regular permit, remaining in the country also after the expiration of such permit. This phenomenon involves around 60% of total irregular immigrants in 2011. For additional information, see Fondazione ISMU (2012).
5The data used in this work come from the 2009 European Union Statistics on Income and Living Conditions (EU-SILC) survey for Italian
8
As displayed in Table 1, the largest presence is that of Romania, followed by Albania, Morocco, Ukraine, China, Tunisia, Poland, Moldova, Philippines and India. The last two groups in the table include ‘residual’ categories of “other EU” and “non-EU countries” (belonging to this last group are for example
Pakistan or Egypt). Table 2 shows the distribution of immigrant groups in percentages by (macro) region of destination. The third column reports the total share of immigrant groups in the North as the sum of the share of immigrants in the North-West and in the North-East. We see that immigrants from Romania, Albania, Morocco, Moldova, India and those in the ‘residual’ category of “other non-EU countries”
mostly reside in the North. In general, most immigrants reside in the North. This is confirmed by the average shares of groups: the gap between the average share in the North and in the South amounts to around 3 percentage points.
[Table 1 about here] [Table 2 about here]
3. Size and source of inequality
Inequality measures differ by their degree of sensitivity to portions of the income distribution, which in Italy respond quite differently to shocks (Mussida and Parisi 2016, p.13).6 The relevant measure of
(CVS-2009) conducted by the Italian National Institute of Statistics (ISTAT 2011). The CVS-2009 survey covers a larger sample of foreign households than the national EU-SILC. The two surveys share the same methodology and definitions, which allow us to use both in order to compare living conditions of native and foreign households. This enables us considering one group of Nationals, which includes households with at least one foreign member, taken from CVS-2009, and another group of Italians only, taken from EU-SILC 2009.
6 Evidence in Mussida and Parisi (2016) suggests that the most relevant impacts of the latest economic crisis on income inequality were concentrated on the bottom quantiles of the income distribution in Southern and Central regions. The income shares in the middle of the distribution seemed not to be significantly affected
9
income in the inequality analysis is the per capita ‘equivalized-household income’, derived from EU-SILC database definition.7 This income is a weighted average of household’s members income, with weights depending on each member’s needs measured on an equivalence scale.8 We use different indexes
of income inequality (Cerqueti and Ausloos 2015, Jenkins 1999, Mussida and Parisi 2016): in general, higher values of each index are associated with higher inequality. The Gini Coefficient is one of the most common measure used in the literature. This coefficient however is very sensitive to differences (and transfers) in the middle portion of the income distribution, while not very sensitive to differences in the bottom or upper tails, i.e. when very high or very low incomes are present. Capturing such sensitivity is an important issue, for example when observing the distributional effects of an economic crisis. Moreover, the Gini coefficient is not additively separable into within or between-group inequality, another important issue to disentangle the spatial and/or socio-demographic source of income inequality. For these reasons, we use additional measures besides Gini. The class of General Entropy indexes, GE(a), depends on a parameter a taking up values in the set {-1, 0 (mean log-deviation), 1 (Theil), 2 (½ the square of coefficient of variation)}, which signals sensitivity to bottom, middle or upper tail of the income distribution. A high positive parameter a is associated with more sensitivity to income differences at the top tail of the distribution. If a>1 the index is very sensitive to outliers in the data (Cowell and Flachaire, 2007). The more negative a, the more sensitive the index to discriminate at the bottom tail of the distribution (and to very small income levels too). We need to be careful at taking extreme values of this
7 EU-SILC is a rotating panel survey based on a harmonized methodology and definitions across most members of the European Union (see EUROSTAT 2010, for further technical details).
8 Individual income is calculated as the total net household income divided by the number of 'equivalent adults’, using a standard equivalence scale, i.e. the modified OECD scale. Such a scale assigns weight 1.0 to the first adult; 0.5 to the second and each subsequent person aged 14 and over; 0.3 to each child under 14.
10
parameter, though, as the presence of one or two very large or small outliers might influence the measure of inequality. In the class of Atkinson indexes, A(e), e is an inequality “aversion” parameter. This means that the more positive e, the more sensitive A(e) to differences at the bottom tail of the distribution.9 Furthermore, we consider percentile ratios of the income distribution. The p90/p10 ratio is the ratio of the upper bound value of the ninth decile (i.e. income at the 90% position) to that of the first decile (i.e. income at 10% position). The p90/p50 ratio is the ratio of the upper bound value of the ninth decile and the median income; the p10/p50 ratio is the ratio between the upper bound value of the first decile and median income. The advantage of using these last measures of inequality is that they address the over-sensitivity of the Gini coefficient to middle incomes, and reflect the impact of economic shocks on the society as a whole.
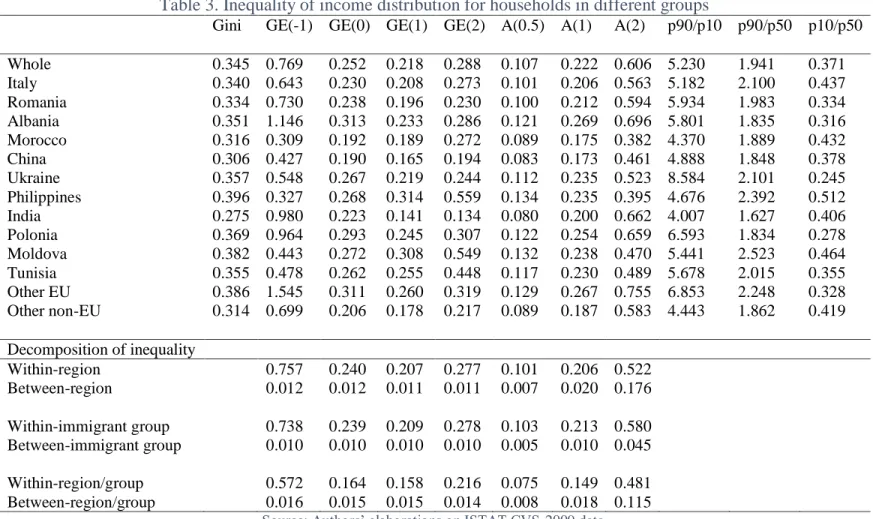
Table 3 reports all inequality indexes calculated for the whole sample and for each immigrant group in the data. We observe that the smaller (therefore marginal for the society) groups in the sample have also higher than average inequality (other EU countries, Poland, Moldova, Ukraine, Tunisia, scoring almost all indicators above inequality of the whole sample).
For Poland, Moldova, Ukraine and the Philippines, the female presence is prevalent and above average (Table 1). One possible explanation of their relatively high within-group income inequality then is that more women are forced into low-paid or informal jobs than their male counterparts. However, this fact cannot explain high inequality for Tunisians, because only 33% of them are women. For this group, a possible explanation of their relatively high inequality is that more than 60% Tunisian immigrants live
9 We choose to describe and analyze the relative income inequality across groups (immigration groups in macro regions, by gender or age) rather than ranking distributions in terms of social welfare, which implies comparing average living standards through a welfare function, and not only through inequality comparisons, with specific properties, e.g. the Generalized Lorenz Curve (Jenkins 2006). Nonetheless, the Atkinson class of inequality indexes, which we use, is a class of social welfare functions in which a mean-preserving spread of income lowers social welfare and reduces progressively inequality by transferring when income of the recipient is lower and lower.
11
in the South, which is the most “unequal” macro region of Italy, as we discuss later (Poland, Ukraine and the Philippines as well are over-represented in the South, as described in the previous section).
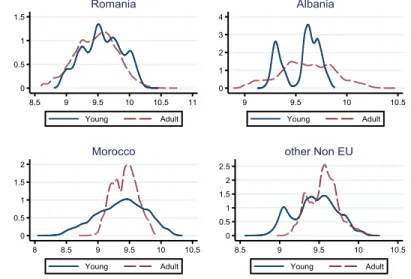
Among the largest groups (other non-EU, Romania, Albania, Morocco), only Albania scores higher than average inequality in the indicators. The female presence is high for Romania (60.4%), and only above forty percent in Albania and Morocco. This discrepancy is evident from the percentile ratios: the group with the majority of women (Romania) scores higher than average levels for p90/p10, p90/p50 and less than average p10/p50 ratio, but lower than average in all other indicators. Many women in that group end up mostly in low-paid domestic work or care services, sometimes even informally. Albania is an exception among the largest immigrant groups: it scores higher than average in the p90/p10 ratio (and lower than average in p10/p50) as well as in almost all other indicators. The fraction of women is below average though, about 44%. Such within-group inequality for Albanians derive probably from their long permanence in Italy, starting at the beginning of the 1980s. Second generation of Albanians live, study and work in Italy today, so they are getting assimilation by knowing the language and through education, and plausibly manage to step up the income ladder at higher positions than their parents. Kernel density estimations of the ln-income data show that young Albanians (those older than 15 and younger than 25, in 2009) are much less economically “unequal” comparing to adults (see Figure 1). The opposite is true for Moroccan people. Young Moroccans’ kernel ln-income density is much more spread out than the correspondent density for adults. Finally, the kernel density for Romanian ln-incomes does not differ by age. Unfortunately, the available data cannot distinguish first from second generation of immigrants residing in Italy (second generation includes those foreign individuals born or mostly grown up and residing in Italy, who are at a working age by the time of the survey).
[Figure 1 about here] [Table 3 about here]
12
The last panel of Table 3 shows the decomposition of inequality within and between-group categories: macro regions (4), immigrant groups (12) plus two groups of nationals, Italians living in households with at least one foreign member (CVS-ISTAT) and Italians with no foreign household member (EU-SILC), which is a representative sample of Italian population. We also calculate inequality for 56 cross group-region categories. Only General Entropy and Atkinson classes allow this decomposition. The Gini index is not additively decomposable, so it cannot give indication of within or between-group inequality.10 In general, the within-region value is much higher than the between-region value of the indexes. Between-region inequality appears to be quite low, but not according to A(2), giving a value equal to 0.176. This result is quite interesting, given that macro-regions in Italy are different in terms of economic conditions, labor market structures, growth, and culture (see e.g. Venturini and Villosio 2008). We can interpret this as evidence that bottom incomes are more sensitive to regional differences, and might benefit from inter-regional transfers. As far as the categories of immigrant groups, within-group inequality is far higher than between-group inequality, even for A(2). This result is consistent with the rest of the literature on income inequality for immigrants (D’Agostino et al. 2016; Saraceno et al. 2013; Carillo 2012; Perugini and Martino 2008). Within-group inequality, as suggested by e.g. Dell’Aringa et al. (2015) and Strom et al. (2017), implies labour market segmentation of immigrants: there is no assimilation because immigrants are mainly employed in sectors/occupations with no career progression.
Notice that, in general, foreigners in the South appear to be poorer (their average regional income is the lowest) and more economically “unequal” than in the other macro regions of the country (especially with
respect to North East and Centre, see Figure 2). This fact might help explaining why the group coming from Tunisia, Ukraine, and Poland do show such high inequality indexes. Immigrant groups in that macro
10 Unless we take into account overlapping categories through the ANOGI technique, as in D’Agostino et al. (2016). However that method cannot help at answering the research question of this paper, i.e. finding the relative importance of spatial and socio-demographic source of inequality.
13
region then have a higher probability to fall in a poverty “trap”. Southern regions of Italy, in fact, are the most penalized in terms of income inequality (Mussida and Parisi 2016), especially after the economic crisis.
[Figure 2 about here]
Finally, we calculate the within and between group inequality also for 56 disaggregated categories (14 groups by 4 macro-regions). In the latter case, within-category inequality is higher than between-category inequality according to all measures, although it is never above 0.57 (i.e. inequality at more disaggregated level is less pronounced within-category but slightly more pronounced between-category, although “within” inequality is still higher than “between”). We can conclude that within-region inequality seems
to be the most important source of inequality in Italy clearly according to the bottom tail-sensitive index GE(-1) = 0.757. However, within-region and within-immigrant group inequality have the same weight on shaping income distribution according to other measures.
4. Income inequality, migrant characteristics and pull factors
We adopt here a regression approach to explore whether income inequality is associated with migrant characteristics and other pull factors. The descriptive analysis highlights that most of income inequality in Italy takes the form of within-immigrant group and within-region inequality, as illustrated in Table 3. Therefore, we use three inequality indexes calculated in 56 disaggregated categories (14 groups for each macro-region shown in Table 2, including the two groups of nationals).11
The equation specification is the following:
11 As already explained (see footnote 5), we have a representative sample of nationals in EU-SILC and nationals in CVS, the latter belonging to households with foreign-born individuals.
14
𝐼𝑗𝑘 = 𝛼 + 𝛽𝑋𝑗𝑘+ 𝐷𝑗+ 𝑟𝑘+ 𝜀𝑗𝑘 (1)
where j = 1,…,14 is the group indicator, k = 1,…,4 is the macro region indicator. 𝐼𝑗𝑘 (the dependent
variable) becomes alternatively one of our three preferred inequality measures, calculated for group j and macro region k, the Gini index, GE(2) and A(2). On the right-hand side, X is a vector of explanatory variables, such as the share of married individuals in each category, the share of female individuals, he share of mothers of less than 6 years old children, individuals with secondary or tertiary degree of education, the share of individuals belonging to five different age classes (16-24, 25-34, 35-44, 45-54 and over 55 years old). Regional unemployment rate, the share of foreigners and the relative mean income are relevant pull factors for the decision to reside in a region. D is the immigration group dummy, r is the regional dummy, and 𝜀𝑗𝑘 is an idiosyncratic white noise term. The dataset does not provide
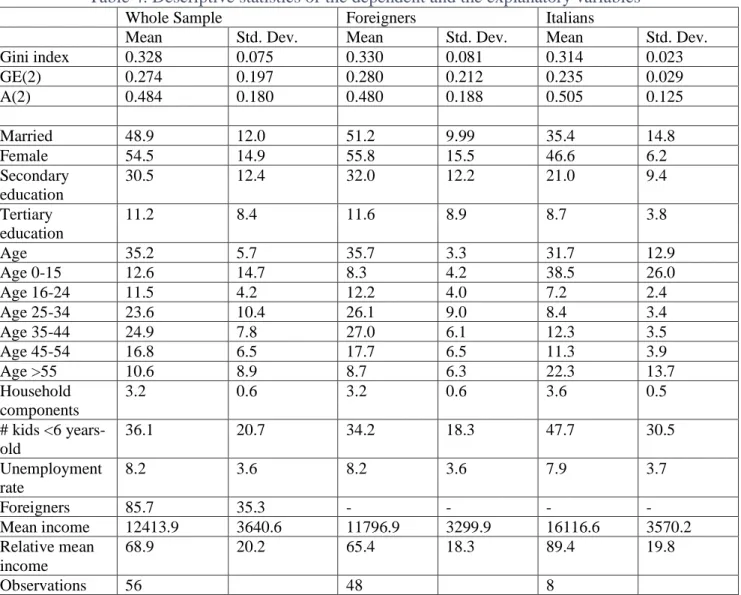
information on the year since migration. Yet, given that the focus is on working age population (16 years old and over), mostly migrating for work purposes, age is a good proxy for the year of entrance in the country (e.g., Strom et al., 2017). The mean and standard deviation of the three dependent variables are reported in Table 4. As it is evident, the three indicators attach different values to inequality of groups across the macro regions. The most sensitive index to the bottom portion of the income distribution, A(2), says that inequality is high (0.484) with quite high variability across the categories (0.180). This means that some categories show an index as high as 0.68, i.e. individuals in those categories belong to a very unequal income distribution. If we rely on the Gini index, the information we get is that inequality exists but it is not as substantive (0.328) and it varies very little across categories (0.075). We also divide the sample between immigrants and Italians, with 48 categories for the former and 8 categories for the latter. Immigrants show higher volatility in all indexes, and they suffer from higher inequality especially when considering sensitivity in the top portion of the income distribution (GE(2)), while Italians are more “unequal” when considering sensitive to bottom portion A(2) index.
15
Slightly less than half of the sampled individuals is married. Almost 55% is female (56% foreigners and 46.6% Italians). About one third has a secondary educational level (going down to 21% for Italian groups) and about 11% has a tertiary degree. The sample is young on average (35 years old), and the average number of components in a household is 3.2. We find that the age class 0-15 and over 55 have the highest frequency for Italian groups, while foreigners mostly are 24 to 44 years old. The mean unemployment rate is 8.2% (higher for foreigners) and the mean income is about 12 thousand euro per year for the immigrants and above 16 thousand euro for nationals. When calculating the relative mean income of each group (mean of each group relative to the general mean), it ranges between 40.4% and 124%, with a relative mean equal to 65.4% for immigrants and 89.4% for Italians.
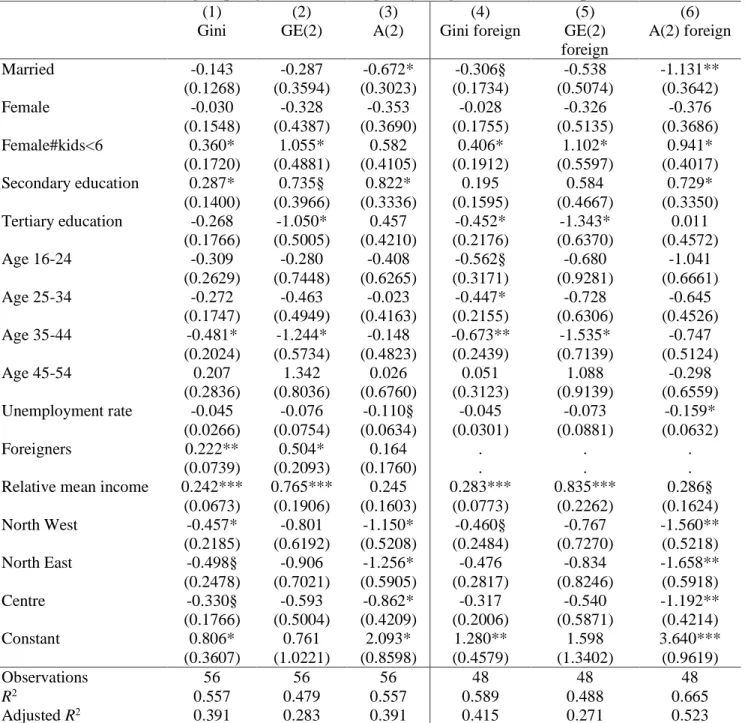
Table 5 shows the regression results from applying the OLS method to equation (1). Categories with a higher share of married individuals are associated with a reduced inequality for the bottom-tail sensitive index A(2) in column (3). If we take only immigrant groups, the estimated coefficient of marital status is negative and statistically significant both for Gini and A(2) in columns (4) and (6), the latter showing a particularly strong effect (-1.13). The share of female does not seem to have any significant relationship with inequality across groups and regions. However, mothers of very young children (less than 6 years old) belong to categories with significantly increased inequality, according to Gini and GE(2) in the total sample and according to all indexes for foreigners only. This result is consistent with the qualitative evidence discussed in the previous section, where groups with a significant presence of women suffer from higher inequality.
Secondary education is associated almost everywhere with higher inequality in the whole sample, especially in the low and middle incomes categories, and to higher inequality only according to A(2) (sensitive to bottom quantiles) for foreigners (0.729). Tertiary education helps at reducing inequality according to GE(2) for the whole sample and according to Gini and GE(2) for foreigners only. Of course, having a tertiary degree increases the probability of getting better-paid jobs. Education is emphasized in
16
the literature as one of the most important factors affecting the degree of income inequality, even though theoretical studies suggest that the relationship between education and inequality is not always clear (Knight and Sabot 1983, and among others the more recent works of De Gregorio and Lee 2002; Yang and Qiu 2016). The presence of individuals aged 25-34 is important only according to Gini in column (4), i.e. foreigners, to reduce income inequality with respect to people over 55 (the reference category). Otherwise, households with individuals in the 35-44 age class belong to categories with reduced inequality (but not according to A(2)).
Regional economic and labor market features as well play a role in shaping income distribution of immigrant groups. The regional unemployment rate is negatively correlated to inequality, measured with the bottom-tail income sensitive index A(2). This result indicates that the higher the general unemployment rate in a region, the lower the inequality. In fact, higher regional unemployment rates would push migrants to reside elsewhere.
The distance between the category mean income and the general mean, measured by the “relative” mean income, is positively associated with income inequality, but not according to A(2). If the relative mean grow, inequality grows as well, ceteris paribus, particularly when this growth affect incomes in the middle portion or top quantiles of the distribution. When bottom incomes grow, inequality is not affected. Moreover, the presence of other foreigners in the macro region affects the decision to migrate, and this is positively correlated with inequality.
The uneven economic development in Italy (see note 2) then influences the regional socio-demographic and economic distribution of immigration. Residents of the Centre-North of Italy have less “unequal” incomes with respect to the South (at least according to Gini and A(2)). This result confirms what we found in section 3, p. 12, in other words, the South is the region with the highest income inequality in Italy, even for (foreign) immigrant groups. This is true according to all indexes, apart from GE(2), the top income sensitive index.
17
Our findings are consistent with the structure of the Italian economy and labor market, which have a “regional divide”. Households living in Southern regions, on average, enjoy less favorable economic
conditions, while immigrant households living in Northern regions benefit from more advantageous conditions, thus mitigating the economic distance from natives (see e.g. D’Agostino et al. 2016, Einaudi 2007). The latter for instance, stressed that in the North of Italy, the unemployment rate is lower than in the South of Italy and consequently the share of immigrants in the North is higher compared to the share of the South.
[Table 4 about here]
[Table 5 about here]
5. Conclusions
We have provided evidence about regional income inequality of national and foreign households in Italy. We derived a qualitative assessment of income distribution for the most numerous immigrant groups residing in the four macro-regions of Italy, with several indexes of inequality, differing by their sensitivity to quantiles of the income distribution. We then conducted a quantitative analysis, through a simple estimation technique, to assess the correlation of migrant characteristics and pull factors of migration to income inequality.
The most important contribution of the paper relies on evidence concerning within-immigrant group/within-region inequality, especially for those households with the presence of women and very young children. All measures of inequality indicated that women with young children in the household belong to highly unequal immigration groups and regions, such as the Centre and South. This is consistent with evidence from other European countries, with a similar immigration pattern, such as Spain and
18
Portugal (Amuedo-Dorantes and de la Rica 2007), where migrant women have a “double” disadvantage (gender and migrant status). This indicated that third-country migrant women experience a lower participation rate and a higher unemployment rate than native-born women and foreign-born men (Rubin et al. 2008).
Inequality is only reduced for married individuals living in the Northern regions according to A(2) index, i.e. our bottom-quantiles sensitive measure. This result has important implications. If bottom incomes were to grow, inequality would not diminish, apart from no those individuals, for no other characteristic is correlated to inequality according to the Atkinson index. Nonetheless, there is a slightly negative correlation between the regional unemployment rate and inequality. This means that for individuals ending up in the bottom portion of the income distribution, unemployment is a deterrent factor to migrate, and that is why unemployment is negatively associated with inequality. The uneven economic development in Italy therefore influences regional distribution of immigration both in socio-demographic and economic terms.
Conflict of Interest: The authors declare that they have no conflict of interest.
References
Allasino, E., Reyneri, E., Venturini, A., Zincone, G.: Discrimination of Foreign Workers in the Italian Labour Market. International Migration Papers No. 67. Geneva, ILO (2004)
Ambrosini, M.: La fatica di integrarsi. Immigrati e lavoro in Italia. Il Mulino, Bologna (2001)
Amuedo-Dorantes, C., de la Rica, S.: Labour Market Assimilation of Recent Immigrants in Spain. British Journal of Industrial Relations, 45(2), 257-284 (2007)
19
Barone, G., Mocetti, S.: With a little help from abroad: The effect of low-skilled immigration on the female labour supply. Labour Economics, 18(5), 664-675 (2011)
Baycan-Levent, T., Nijkamp, P.: Characteristics of migrant entrepreneurship in Europe. Entrepreneurship & Regional Development, 21(4), 375-397 (2009)
Berti, F., D’Agostino, A., Lemmi, A., Neri, L.: Poverty and deprivation of immigrants vs natives in Italy.
International Journal of Social Economics, 41(8), 630-649 (2014)
Bettio, F., Simonazzi, A., Villa, P.: Change in care regimes and female migration: the ‘care drain’ in the Mediterranean. Journal of European Social Policy, 16(3), 271-285 (2006)
Carillo, M. R.: Flussi migratori e capitale umano. Una prospettiva regionale. Carocci editore, Roma (2012)
Cerqueti, R., Ausloos, M.: Statistical assessment of regional wealth inequalities: the Italian case. Quality and quantity, 49(6), 2307-2323 (2015)
Codura Martìnez, A., Saiz-Alvarez, J. M., Cuervo-Arango Martìnez, C.: Immigrant Entrepreneurship: An International Comparison. Revista de Economìa Mundial, 35, 137-150 (2013)
Cowell, F. A., Flachaire, E.: Income distribution and inequality measurement: The problem of extreme values. Journal of Econometrics, 141, 1044-1072 (2007)
D’Agostino, A., Regoli, A., Cornelio, G., Berti, F.: Studying Income Inequality of Immigrant
Communities in Italy. Social Indicators Research, 127(1), 83-100 (2016)
De Gregorio, J., Lee, J.-W.: Education and income inequality: New evidence from cross country data. Review of Income and Wealth, 48, 395–416 (2002)
Del Boca, D., Venturini, A.: Italian Migration. IZA Discussion Paper, No. 938 (2003)
Dell'Aringa, C., Lucifora, C., Pagani, L.: Earnings differentials between immigrants and natives: the role of occupational attainment, IZA Journal of Migration, 4,8 (2015)
20
Edin, P.-A., Fredriksson, P., Åslund, O.: Ethnic enclaves and the economic success of immigrants - evidence from a natural experiment,” IFAU, 2000-2009 (2000)
Einaudi, L.: Immigration and integration policies in Italy in rethinking immigration and integration: A new centre-left Agenda. Policy Network, United Kingdom (2007)
Etzo, I.: Determinants of Interregional Migration in Italy: A Panel Data Analysis. MPRA Paper, No. 5307 (2007)
EUROSTAT: Description of Target Variables: Cross-sectional and Longitudinal, EU-SILC 065/2010. (EUROSTAT, Luxembourg 2010)
Faini, R., Strom, S., Venturini, A., Villosio, C.: Are Foreign Migrants More Assimilated than Native Ones? IZA Discussion paper, No. 4639 (2009)
Fenton, S.: Ethnicity: Racism, Class and Culture. Macmillan, Basingstoke (1999)
Fondazione ISMU: Diciottesimo Rapporto sulle migrazioni 2012. Franco Angeli, Milano (2012)
Fullin, G., Reyneri, E.: Low unemployment and bad jobs for new immigrants in Italy. International Migration, 49, 118-147 (2011)
ISTAT: I redditi delle famiglie con stranieri, Statistiche Report. (ISTAT, Roma 2011)
ISTAT: Annuario Statistico Italiano. (ISTAT, Roma 2015)
Jenkins, S. P.: Analysis of income distribution. Stata Technical Bulletin, sg104: 4-18 (1999)
---: Estimation and interpretation of measures of inequality, poverty and social welfare using Stata. Slide presentation at North American Stata User Group Meeting, Boston, (2006, July) Knight, J. B., Sabot, R. H.: Educational expansion and the kuznets effect. American Economic Review,
73, 1132-1136 (1983)
21
MIPEX: Migration Integration Policy Index, Third edition, http://www.mipex.eu/history (2011)
Modood, T., Beishon, S., Virdee, S.: Changing Ethnic Identities. Policy Studies Institute, London (1994)
Morettini, G., Presbitero, A. Tamberi, M.: Da paesi vicini, democratici e non troppo poveri: l'immigrazione straniera nelle province italiane. Università' Politecnica delle Marche, Dipartimento di Scienze Economiche e Sociali, Working Paper No. 362 (2011)
--- : Determinants of international migrations to Italian provinces. Economics Bulletin, 32(2), 1604-1617 (2012)
Mussida, C., Parisi, M. L.: The effect of economic crisis on regional income inequality in Italy. DISES Working Paper, No. 114 (2016)
Ortega, F., Peri, G.: The Causes and Effects of International Migrations: Evidence from OECD Countries 1980-2005. NBER, Working Papers No. 14833 (2009)
Ottaviano, G. I. P., Peri, G.: Rethinking the Effect of Immigration on Wages. Journal of the European Economic Association, European Economic Association, 10(1), 152-197 (2012)
Perugini, C., Martino, G.: Income Inequality within European Regions: Determinants and Effects on Growth. Review of Income and Wealth, International Association for Research in Income and Wealth, 54(3), 373-406 (2008)
Piazzalunga, D.: Is There a Double-Negative Effect? Gender and Ethnic Wage Differentials in Italy, LABOUR, 29(3), 243-269 (2015)
Portes, A., Jensen, L.: What's an ethnic enclave? The case for conceptual clarity. American Sociological Review, 52(6), 767-771 (1987)
22
Reyneri, E.: Immigrants in a Segmented and Often Undeclared Labour Market. Journal of Modern Italian Studies, 9 (1), 71-93 (2004)
Rubin, J., Rendall, M. S., Rabinovich, L., Tsang, F., van Oranje-Nassau, C. and Janta, B.: Migrant Women in the European Labor Force. Current situation and future prospects. RAND Europe, Technical Report. (2008).
Saraceno, C., Sartor, N., Sciortino, G. (eds.). (2013). Stranieri e disuguali, Il Mulino, Bologna: Le disuguaglianze nei diritti e nelle condizioni di vita degli immigrati.
Smedley, A.: "Race" and the Construction of Human Identity. American Anthropologist, 100(3), 690-702 (1998)
Song, M.: Choosing Ethnic Identity. Polity Press, Cambridge (2003).
Strom S., Piazzalunga, D., Venturini, A., Villosio C.: Wage assimilation of immigrants and internal migrants: the role of linguistic distance. Regional Studies (2017)
http://dx.doi.org/10.1080/00343404.2017.1395003
Venturini, A. (2004). Post-War Migration in Southern Europe. An Economic Approach, Cambridge University Press, Cambridge.
Venturini, A., Villosio, C.: Labour market effects of immigration into Italy: An empirical analysis. International Labour Review, 145(1-2), 91-118 (2006)
---: Labour-market assimilation of foreign workers in Italy. Oxford Review of Economic Policy, 24(3), 517–541 (2008)
---: Are migrants an asset in recession? Insights from Italy, Journal of Ethnic and Migration Studies (2017), online first
23
Visco, I.: Invecchiamento della popolazione, immigrazione, crescita economica. Rivista Italiana degli Economisti, 13(2), 209-244 (2008)
Yang, J., Qiu, M.: The impact of education on income inequality and intergenerational mobility. China Economic Review, 37, 110-125 (2016)
24 Tables
Table 1. Incidence of the immigrant groups (country of origin)
Immigrant group Freq. Percent Cum. % female
Italy 3,969 26.40 26.40 40.6 Romania 2,355 15.66 42.06 60.4 Albania 1,375 9.14 51.20 44.2 Morocco 1,121 7.46 58.66 42.1 Ukraine 449 2.99 61.65 84.9 China 436 2.90 64.55 49.3 Tunisia 371 2.47 67.02 32.9 Poland 369 2.45 69.47 76.4 Moldova 282 1.88 71.35 68.1 Philippines 271 1.80 73.15 58.7 India 244 1.62 74.77 37.3 Other EU 811 5.39 80.16 65.4 Other non-EU 2,983 19.84 100.00 51.2 Total 15,036 100.00 50.6
Italy in this table includes Italian nationals living in households with at least one foreign member. Source: Authors’ elaborations on ISTAT CVS-2009 data
Table 2. Immigrant groups by (macro) region of destination - percentages
Immigrant group North-West North-East North Centre South
Italy 21.2 22.9 44.1 19.2 36.7 Romania 19.6 18.1 37.7 25.8 36.5 Albania 21.8 22.1 43.9 24.3 31.8 Morocco 27.4 27.3 54.7 9.6 35.7 Ukraine 13.1 17.4 30.5 14.1 55.4 China 17.2 15.6 32.8 15.1 52.1 Tunisia 13.7 17.8 31.5 7.8 60.7 Poland 7.6 13.6 21.2 21.9 56.9 Moldova 10.9 51.1 62 28.1 9.9 Philippines 16.9 11.1 28 33.3 38.7 India 36.1 27.1 63.2 16.7 20.1 Other EU 16.2 17.9 34.1 21.4 44.5 Other non-EU 26.9 29.9 56.8 18.3 24.9 Average§ 41.6 19.7 38.7 Growth rate§§ 3.34 1.25 2.29 0.94 1.28
§Average share of immigrants in the North, Centre and South §§The annual growth rate of GDP in 2008 in each macro region.
25
Table 3. Inequality of income distribution for households in different groups
Gini GE(-1) GE(0) GE(1) GE(2) A(0.5) A(1) A(2) p90/p10 p90/p50 p10/p50
Whole 0.345 0.769 0.252 0.218 0.288 0.107 0.222 0.606 5.230 1.941 0.371 Italy 0.340 0.643 0.230 0.208 0.273 0.101 0.206 0.563 5.182 2.100 0.437 Romania 0.334 0.730 0.238 0.196 0.230 0.100 0.212 0.594 5.934 1.983 0.334 Albania 0.351 1.146 0.313 0.233 0.286 0.121 0.269 0.696 5.801 1.835 0.316 Morocco 0.316 0.309 0.192 0.189 0.272 0.089 0.175 0.382 4.370 1.889 0.432 China 0.306 0.427 0.190 0.165 0.194 0.083 0.173 0.461 4.888 1.848 0.378 Ukraine 0.357 0.548 0.267 0.219 0.244 0.112 0.235 0.523 8.584 2.101 0.245 Philippines 0.396 0.327 0.268 0.314 0.559 0.134 0.235 0.395 4.676 2.392 0.512 India 0.275 0.980 0.223 0.141 0.134 0.080 0.200 0.662 4.007 1.627 0.406 Polonia 0.369 0.964 0.293 0.245 0.307 0.122 0.254 0.659 6.593 1.834 0.278 Moldova 0.382 0.443 0.272 0.308 0.549 0.132 0.238 0.470 5.441 2.523 0.464 Tunisia 0.355 0.478 0.262 0.255 0.448 0.117 0.230 0.489 5.678 2.015 0.355 Other EU 0.386 1.545 0.311 0.260 0.319 0.129 0.267 0.755 6.853 2.248 0.328 Other non-EU 0.314 0.699 0.206 0.178 0.217 0.089 0.187 0.583 4.443 1.862 0.419 Decomposition of inequality Within-region 0.757 0.240 0.207 0.277 0.101 0.206 0.522 Between-region 0.012 0.012 0.011 0.011 0.007 0.020 0.176 Within-immigrant group 0.738 0.239 0.209 0.278 0.103 0.213 0.580 Between-immigrant group 0.010 0.010 0.010 0.010 0.005 0.010 0.045 Within-region/group 0.572 0.164 0.158 0.216 0.075 0.149 0.481 Between-region/group 0.016 0.015 0.015 0.014 0.008 0.018 0.115
26
Table 4. Descriptive statistics of the dependent and the explanatory variables
Whole Sample Foreigners Italians
Mean Std. Dev. Mean Std. Dev. Mean Std. Dev.
Gini index 0.328 0.075 0.330 0.081 0.314 0.023 GE(2) 0.274 0.197 0.280 0.212 0.235 0.029 A(2) 0.484 0.180 0.480 0.188 0.505 0.125 Married 48.9 12.0 51.2 9.99 35.4 14.8 Female 54.5 14.9 55.8 15.5 46.6 6.2 Secondary education 30.5 12.4 32.0 12.2 21.0 9.4 Tertiary education 11.2 8.4 11.6 8.9 8.7 3.8 Age 35.2 5.7 35.7 3.3 31.7 12.9 Age 0-15 12.6 14.7 8.3 4.2 38.5 26.0 Age 16-24 11.5 4.2 12.2 4.0 7.2 2.4 Age 25-34 23.6 10.4 26.1 9.0 8.4 3.4 Age 35-44 24.9 7.8 27.0 6.1 12.3 3.5 Age 45-54 16.8 6.5 17.7 6.5 11.3 3.9 Age >55 10.6 8.9 8.7 6.3 22.3 13.7 Household components 3.2 0.6 3.2 0.6 3.6 0.5 # kids <6 years-old 36.1 20.7 34.2 18.3 47.7 30.5 Unemployment rate 8.2 3.6 8.2 3.6 7.9 3.7 Foreigners 85.7 35.3 - - - - Mean income 12413.9 3640.6 11796.9 3299.9 16116.6 3570.2 Relative mean income 68.9 20.2 65.4 18.3 89.4 19.8 Observations 56 48 8
Note: figures are in percentage, age in years, household components in units, and mean income in euro. Means and standard deviations are calculated in 56 categories. Categories are formed by 14 immigrant groups in 4 macro regions. There is one group of Nationals, which includes households with at least one foreign member and another representative sample of Italians only, taken from EU-SILC 2009.
27
Table 5. Within-group-region income inequality, migrant features and pull factors
(1) (2) (3) (4) (5) (6)
Gini GE(2) A(2) Gini foreign GE(2)
foreign A(2) foreign Married -0.143 -0.287 -0.672* -0.306§ -0.538 -1.131** (0.1268) (0.3594) (0.3023) (0.1734) (0.5074) (0.3642) Female -0.030 -0.328 -0.353 -0.028 -0.326 -0.376 (0.1548) (0.4387) (0.3690) (0.1755) (0.5135) (0.3686) Female#kids<6 0.360* 1.055* 0.582 0.406* 1.102* 0.941* (0.1720) (0.4881) (0.4105) (0.1912) (0.5597) (0.4017) Secondary education 0.287* 0.735§ 0.822* 0.195 0.584 0.729* (0.1400) (0.3966) (0.3336) (0.1595) (0.4667) (0.3350) Tertiary education -0.268 -1.050* 0.457 -0.452* -1.343* 0.011 (0.1766) (0.5005) (0.4210) (0.2176) (0.6370) (0.4572) Age 16-24 -0.309 -0.280 -0.408 -0.562§ -0.680 -1.041 (0.2629) (0.7448) (0.6265) (0.3171) (0.9281) (0.6661) Age 25-34 -0.272 -0.463 -0.023 -0.447* -0.728 -0.645 (0.1747) (0.4949) (0.4163) (0.2155) (0.6306) (0.4526) Age 35-44 -0.481* -1.244* -0.148 -0.673** -1.535* -0.747 (0.2024) (0.5734) (0.4823) (0.2439) (0.7139) (0.5124) Age 45-54 0.207 1.342 0.026 0.051 1.088 -0.298 (0.2836) (0.8036) (0.6760) (0.3123) (0.9139) (0.6559) Unemployment rate -0.045 -0.076 -0.110§ -0.045 -0.073 -0.159* (0.0266) (0.0754) (0.0634) (0.0301) (0.0881) (0.0632) Foreigners 0.222** 0.504* 0.164 . . . (0.0739) (0.2093) (0.1760) . . .
Relative mean income 0.242*** 0.765*** 0.245 0.283*** 0.835*** 0.286§ (0.0673) (0.1906) (0.1603) (0.0773) (0.2262) (0.1624) North West -0.457* -0.801 -1.150* -0.460§ -0.767 -1.560** (0.2185) (0.6192) (0.5208) (0.2484) (0.7270) (0.5218) North East -0.498§ -0.906 -1.256* -0.476 -0.834 -1.658** (0.2478) (0.7021) (0.5905) (0.2817) (0.8246) (0.5918) Centre -0.330§ -0.593 -0.862* -0.317 -0.540 -1.192** (0.1766) (0.5004) (0.4209) (0.2006) (0.5871) (0.4214) Constant 0.806* 0.761 2.093* 1.280** 1.598 3.640*** (0.3607) (1.0221) (0.8598) (0.4579) (1.3402) (0.9619) Observations 56 56 56 48 48 48 R2 0.557 0.479 0.557 0.589 0.488 0.665 Adjusted R2 0.391 0.283 0.391 0.415 0.271 0.523
Note: Standard errors in parentheses. § p < 0.10, * p < 0.05, ** p < 0.01, *** p < 0.001. All inequality indexes refer to the equivalized-household income. Column (4) to (6) include foreign categories only. Column (1) to (3) include all groups (nationals and foreigners). Immigration group dummies are included in all regressions. Source: Authors’ elaborations on ISTAT CVS-2009 data.
28 Figure legends
Figure 1. Kernel ln-income density for the largest immigration groups in Italy. Young refers to individuals younger than 25 in 2009; adults are older than 24.
Figure 2. . Kernel ln-income density for foreigners residing in the four regions. Four macro-regions of Italy: North West, North East, Centre, and South.
29 Figures
Figure 1. Kernel ln-income density for the largest immigration groups in Italy
Note: Young refers to individuals younger than 25 in 2009; adults are older than 24.