Alma Mater Studiorum – Università di Bologna
DOTTORATO DI RICERCA IN
BIOLOGIA CELLULARE E
MOLECOLARE
Ciclo XXVI
Settore Concorsuale di afferenza: 05/E2
Settore Scientifico disciplinare: BIO/11
Analysis of Two Component Systems in Group B Streptococcus
Shows that RgfAC and the Novel FspSR Modulate Virulence and
Bacterial Fitness
Presentata da: Cristina Faralla
Coordinatore Dottorato
Relatori
Ch.mo Prof. Vincenzo Scarlato Ch.mo Prof. Vincenzo Scarlato
Dott. Robert Janulczyk
Nobody said it would be easy, they just promised it
would most likely be worth it
―
Harvey MacKay
Al mio amato nonno Rosario,
che sarebbe stato fiero di vedermi raggiungere questo traguardo.
Ai miei genitori Massimo e Sissi,
perché è grazie al loro costante supporto e sostegno che sono qui oggi.
Alle mie sorelle Ida e Federica,
perché non smettano mai di creder in loro stesse e possano realizzare
tutti i loro sogni.
Il mio progetto di dottorato, presentato in questo lavoro di tesi, si è focalizzato sullo studio dei sistemi a due componenti in Streptococcus agalactiae. Tali sistemi agiscono da sensori per il batterio percependo particolari stimoli ambientali e attivando di conseguenza una risposta intracellulare specifica (spesso di tipo trascrizionale). Essi rappresentano quindi uno strumento indispensabile per l’adattamento, la sopravvivenza e la patogenesi dei batteri.
Nel presente lavoro, mediante un approccio combinato di bioinformatica e analisi trascrizionale, cinque sistemi, precedentemente poco o per nulla caratterizzati, sono stati scelti come target di studio. Mutanti di delezione in ognuno dei cinque sistemi sono stati quindi ottenuti in S. agalactiae e caratterizzati sia in vitro che in vivo. I risultati di tale studio sono riportati nella seguente tesi ed in un articolo attualmente in revisione dalla rivista MBio.
Faralla C, Metruccio MM, De Chiara M*, Mu R.*, Patras KA*,Muzzi A, Grandi G, Margarit I, Doran KS, Janulczyk R. Analysis of two component systems in Group B
Streptococcus shows that RgfAC and the novel FspSR modulate virulence and bacterial fitness.
Under Review-MBio
*Questi autori hanno contribuito ugualmente al presente lavoro.
Parallelamente a questo progetto ho anche collaborato alla caratterizzazione immunologica e funzionale di uno degli antigeni scelti come candidato vaccino
contro Streptococcus pyogenes dalla Novartis Vaccines & Diagnostic di Siena. In particolare, mi sono occupata della generazione di ceppi ricombinanti di S.pyogenes in cui la Streptolisina-O fosse assente o sostituita con una sua forma mutata. I ceppi generati sono stati quindi caratterizzati in vivo al fine di investigare come questa proteina fosse coinvolta nell’evasione della risposta immunitaria da parte del batterio. Il lavoro svolto è stato oggetto di una pubblicazione scientifica.
Chiarot E, Faralla C, Chiappini N, Tuscano G, Falugi F, Gambellini G, Taddei A, Capo S, Cartocci E, Veggi D, Corrado A, Mangiavacchi S, Tavarini S, Scarselli M, Janulczyk R, Grandi G, Margarit I, Bensi G. Targeted amino Acid substitutions
impair streptolysin o toxicity and Group A Streptococcus virulence. MBio. 2013 Jan
Abstract
Group B Streptococcus (GBS), in its transition from commensal to pathogen, will encounter diverse host environments and thus require coordinately controlling its transcriptional responses to these changes. This work was aimed at better understanding the role of two component signal transduction systems (TCS) in GBS pathophysiology through a systematic screening procedure. We first performed a complete inventory and sensory mechanism classification of all putative GBS TCS by genomic analysis. Five TCS were further investigated by the generation of knock-out strains, and in vitro transcriptome analysis identified genes regulated by these systems, ranging from 0.1-3% of the genome. Interestingly, two sugar phosphotransferase systems appeared differently regulated in the knock-out mutant of TCS-16, suggesting an involvement in monitoring carbon source availability. High throughput analysis of bacterial growth on different carbon sources showed that TCS-16 was necessary for growth of GBS on fructose-6-phosphate. Additional transcriptional analysis provided further evidence for a stimulus-response circuit where extracellular fructose-6-phosphate leads to autoinduction of TCS-16 with concomitant dramatic up-regulation of the adjacent operon encoding a phosphotransferase system. The TCS-16-deficient strain exhibited decreased persistence in a model of vaginal colonization and impaired growth/survival in the presence of vaginal mucoid components. All mutant strains were also characterized in a murine model of systemic infection, and inactivation of TCS-17 (also known as RgfAC) resulted in hypervirulence. Our data suggest a role for the previously
unknown TCS-16, here named FspSR, in bacterial fitness and carbon metabolism during host colonization, and also provide experimental evidence for TCS-17/RgfAC involvement in virulence.
Table of Contents
1. Introduction...8
1.1.
Streptococcus agalactiae...81.2.
Two component systems...111.3.
Two component systems in GBS...131.4.
Aim of the study and importance...142. Results...16
2.1.
Identification and comparative genomics of TCS...162.2.
Domain architecture for TCS in the genome of CJB11...202.3.
Transcriptional analysis of TCS...222.4.
Expression microarray analysis of TCS mutants...242.5.
Phenotype microarray screening shows that TCS-16 influences carbon source utilization...302.6.
TCS-16 gene regulation in response to extracellular Fru-6-P...332.7.
The RR16 recombinant protein is insoluble when expressed in E. coli...362.9.
TCS-17/RgfAC influences virulence in a murine model ofsystemic infection...43
2.10.
TCS-17/RgfAC shows higher duplication rate in human blood...453. Discussion...48
4. Materials and Methods...53
4.1.
Bacterial strains and growth conditions...534.2.
Construction of TCS isogenic mutants...534.3.
Recombinant RR16 cloning, expression and purification...554.4.
Bioinformatics methods...574.5.
Expression microarray analysis...584.6.
qRT-PCR analysis...604.7.
Phenotype Microarray analysis...614.8.
In vivo infection experiments...624.9.
In vitro infection experiments...624.10.
Ex vivo GBS growth experiments...634.11.
Oligo list...651. Introduction
1.1 Streptococcus agalactiae
Streptococcus agalactiae or Group B Streptococcus (GBS) is a β-hemolytic
Gram-positive bacterium first recorded as cause of fatal puerperal sepsis in 1938 (1). This microorganism remained then unknown until the 1970s, when it was indicated as responsible of a dramatic increase in the incidence of septicemia and meningitis in neonates (2-4). GBS was known to cause bovine mastitis before being appreciated as
pathogenic in humans (5), even if substantial biochemical, serologic, and molecular differences exist between human and bovine isolates (5). In this decade, GBS remains the dominant cause of infant morbidity and mortality in the United States (6), and has also been recognized as an important cause of infections in immunocompromised patients and the elderly (7).
GBS expresses a capsular polysaccharide (CPS) that is a major virulence factor contributing to evasion of host immune defense mechanisms (8). GBS CPS can be divided into ten serotypes (Ia, Ib, II–IX), each with unique structural and antigenic features. Nevertheless, all the GBS CPS repeating units share a critical conserved element: a terminally capped sialic acid (Sia). Sia is a nine-carbon backbone sugar present abundantly in the surface glycocalyx of all mammalian cells, and in this manner GBS decorates its surface with a common host epitope – a form of molecular mimicry. The sialylated CPS is recognized as a critical factor for GBS survival in
vivo (9), interfering with host complement system functions to block C3b deposition
and limit C5a production (10, 11).
A number of additional virulence factors that are important for GBS adherence, invasion of host cells and evasion of host immunity have been described (β-hemolysin/cytolysin, CAMP factor, superoxide dismutase, pili, C5α peptidase, serine proteinase, AMP) (12). Despite these advances, one area that deserves greater attention is how the pathogen regulates expression of these virulence factors during infection. GBS is a commensal in the rectovaginal tract of 20–30% of healthy women (13). However, by vertical transmission intrapartum, it may transition to an invasive pathogen, resulting in pneumonia, sepsis and meningitis (14). The physiopathology of GBS infections implies that this bacterium encounters several very different microenvironments during colonization and the infectious process. This indicates that GBS is efficiently able to adapt to changing host environments (Fig. 2). The
FIG 2. Lifecycle of Group B Streptococci as a neonatal pathogen. (A) GBS reside as a
commensal in genital and lower gastrointestinal tracts of women. (B) GBS can infiltrate the intrauterine compartment in pregnant mothers who are asymptomatic carriers. (C) Newborn aspirate GBS in utero or during birth. (D) GBS invades the neonatal lung causing pneumonia. (E) From the lung, GBS gains access into the bloodstream of the neonate causing sepsis and invades multiple neonatal organs including the heart (F) GBS penetrates the blood brain barrier causing meningitis (12).
transition of the organism from a commensal niche (e.g. vaginal tract) to invasive niches (e.g. blood, lung, brain, and other organs) is likely to require adaptive changes, and a well-known way for bacteria to monitor and respond to their environment is by the use of two-component signal transduction systems (TCS).
1.2 Two component systems
TCS are typically organized in operons that encode a sensing histidine kinase (HK) and a response regulator (RR). The HK harbors an N-terminal input domain that recognizes a specific stimulus. The information is then transduced through intramolecular conformational changes, resulting in the phosphorylation and activation of the C-terminal transmitter domain. This domain, in turn, activates its cognate receiver, encoded by the N-terminal domain of the RR. Once activated, the RR gives rise to an intracellular response through the C-terminal effector (or output) domain. This response typically results in differential gene expression (Fig. 3), but it can also result in a protein-protein interaction (e.g., chemotaxis) or protein- DNA/RNA interactions leading to differential gene expression. Stimulus perception mechanisms for well-characterized HKs, can be an indication for trying to predict the biological function of uncharacterized TCSs, even if sequence homology is generally a poor predictor of sensing mechanisms or specific stimuli, while domain architecture may provide clues that assist in assigning HKs to one of three groups: extracellular sensing, membrane sensing and cytoplasmic sensing (15, 16).
Extracellular sensing HKs typically sense stimuli located in the extracellular space, like solutes or nutrients. Examples are represented by the TCSs EnvZ/OmpR (63) and NtrB/NtrC in E. coli. (34). Transmembrane sensing HKs usually respond to membrane associated stimuli such as turgor, mechanical stress, quorum sensing molecules or stimuli derived from membrane-bound enzymes. Classical examples are TCSs such as LiaS/R of B. subtilis (24) and the S. pneumoniae ComD/E (52). Cytoplasmic TCSs respond to diffusible or internal stimuli, such as O2 or H2. They
also sense the presence of intracellular solutes or of proteins signaling the metabolic or developmental state of the cell or of the cell cycle (32). Examples are the CheA/Y TCS of proteobactearia (53) and ArcB/A of E.coli (31) (Fig. 4).
A
B
C
FIG 3 TCS mechanism of action. (A) Autophosphorylation of the histidine residue (H) in
the transmitter domain of the sensor (sensor activation); (B) Transferring of the phosphate group (P) to an aspartic acidic residue in the receiver domain of the RR (receiver activation); (C) Dephosphorylation of the RR to set the system back to the prestimulus state (15).
1.3 Two component systems in GBS
Overall, the role of TCS in GBS pathogenesis is not well understood and so far, only a few TCS have been already studied in Streptococcus agalactiae. In the sequenced NEM316 and 2603 V/R strains, 20 and 17 TCSs have been identified respectively (17, 18). The most studied system is CovRS, an important regulator in Streptococcus spp. In GBS, the CovRS regulon extends to 7-27% of the genome (depending on growth conditions), and includes different functional categories, such as cell envelope, cellular processes, metabolism and virulence factors (19-22). Only a few other TCSs have been studied in GBS. The DltS/DltR has been showed to be involved in the
FIG 4 Schematic representation of the three different mechanisms of stimulus perception.
(A) Periplasmic-sensing HKs. (B) HKs with sensing mechanisms linked to the transmembrane regions. (C) Cytoplasmic-sensing HKs. The stimulus is represented by a red arrow or red star (16).
regulation of D-alanyl-LTA biosynthesis (23), a molecule essential for S. agalactiae virulence (24). The TCS RgfC/RgfA regulates the expression of bacterial cell surface components (ScpB) and is involved in fibrinogen binding (25, 26). In the TCS CiaH/R, the RR CiaR is involved in intracellular survival within neutrophils, murine macrophages, and human BMEC and it is linked to increased bacterial susceptibility to killing by antimicrobial peptides, lysozyme, and reactive oxygen species (27). Moreover, the Sak189 response regulator was shown to be important in controlling virulence properties in vivo as well as the transcription of the β-antigen through the
bac gene (28). And just recently the two-component response regulator LiaR was
shown to regulate expression of genes involved in microbial defence against host antimicrobial systems including genes functioning in cell wall synthesis, pili formation and cell membrane modification. Moreover GBS LiaR mutants are significantly attenuated in mouse models of both sepsis and pneumonia (29).
1.4 Aim of the study and importance
Two component systems have been evolved by bacteria to detect environmental changes and play key roles in pathogenicity. A comprehensive analysis of TCS in GBS has not been previously performed.
In the present study, we aim to better understand the role of TCS in GBS patho-physiology by adopting a step-wise screening strategy. First, inventory, comparative genomics analysis, and sensing mechanism classification were performed through a bioinformatics approach. Second, by transcriptional analysis and identification of
output domains related to virulence, we selected five systems and generated knock-out strains for further study.
In this way we classified 21 TCS and presented evidence for the involvement of two specific TCS in GBS virulence and colonization in vivo. Although pinpointing specific TCS stimuli is notoriously difficult, using a combination of techniques we identified two systems with different effects on GBS pathogenesis. For one of the systems, we propose that fructose-6-phosphate, a metabolite in glycolysis, is sufficient to induce a regulatory response involving a sugar transport system.
Our catalogue and classification of TCS not only give an overview of the TCSs distribution in the world of group B Streptococcus but also provide new evidences of their importance in the fitness and virulence of GBS.
This work is a precious starting point and it may guide further studies into the role of TCS in GBS pathogenicity and biology.
2. Results
2.1 Identification and comparative genomics of TCS
For the purposes of our study, we focused our main attention on serotype V GBS isolates. Type V is the most common capsular serotype associated with invasive infection in non-pregnant adults and has increased among neonatal invasive disease strains in the recent years, accounting for approximately one-third of clinical isolates in the U.S. population (30). To identify possible TCS, genes predicted to encode HKs or RRs in the GBS type V 2603 V/R genome were collected from the P2CS database (http://www.p2cs.org) (31, 32). A total of 38 genes (21 systems) were identified (Table 1). 17 out of these loci contained a cognate pair of HK and RR-encoding genes while an additional 4 TCS genes were orphans. Each TCS locus, whether paired or orphaned, was assigned a number in order of appearance on the chromosome. The predicted TCS proteins were then used as queries to identify corresponding gene loci in 7 other GBS genomes (17, 18, 33). Eight out of 21 TCS were very well conserved (identity>98%) across the genomes. Our analysis was unidirectional, and we do not exclude the presence of additional TCS in the 7 genomes. Thirteen systems had critical polymorphisms in one or more genomes, and the resulting proteins were predicted to be functionally inactive or compromised. However, such variants were especially abundant in draft genomes (pseudochromosomes), and often contained ambiguous nucleotides or contig breaks close to the polymorphism. Therefore, some of the reported polymorphisms may represent sequencing errors, in which case we are underestimating the number of fully functional orthologous systems. TCS-17/RgfAC
presented an interesting case of variability. While TCS-17/RgfAC is complete and conserved in strains CJB111 and COH1 (and O90R), other strains have an orphan 17/RgfAC, where only the RR/RgfA is present. Genomes with an orphan TCS-17 may have undergone recombinatorial events, as they show larger deletions in the locus with short remnants of putative hk or rr genes. Moreover, RR17/RgfA is less similar (80% identity) than typical (>95%) when comparing the orphaned variants with the paired variants. This suggests a subsequent degeneration of the inactive orphaned locus, or that TCS-17 in strains CJB111, COH1 and O90R could represent a functionally different system.
We also searched the NCBI database of non-redundant protein sequences, and excluded hits in GBS. All our best hits were found in organisms that are phylogenetically close to GBS, and all but two were found in Streptococcus spp. Sequence identity varied, and a subset of the TCS may represent a ‘Streptococcal set’, while systems with the lowest degree of homology may perform functions unique for GBS.
TCS 2603 V/R Type Anomalies a CJB111 b Best hit c Id d Ref.e
TCS-1 SAG0123 RR SAM0116 S. uberis 100
SAG0124 HK SAM0117 99
TCS-2 SAG0182 HK SAM0183 S. ratti 82 SAG0183 RR SAM0184 78 TCS-3
(Orphan)
SAG0310 HK 515 SAM0322
S. vestibularis 50 - RR in all strains SAM0323
TCS-4 SAG0321 HK SAM0333 S. iniae 63 liaSR (29)
SAG0322 RR SAM0334 85
TCS-5 SAG0393 RR SAM0401 S. porcinus 77 SAG0394 HK COHI SAM0402 67
TCS-6 SAG0616 RR SAM0583 E. faecalis 95 189 (28) sak188/ SAG0617 HK H36B *, 18RS21* SAM0584 78 TCS-7 (Orphan) SAG0712 RR 18RS21 * SAM0733 R. albus 54 -
TCS-8 SAG0719 RR SAM0741 S. infantarius 90 SAG0720 HK H36B SAM0742 79 TCS-9 SAG0976 RR SAM0983 S. criceti 73
SAG0977 HK SAM0984 54
TCS-10 SAG0984 HK SAM0991 S. mutans 60 ciaRH (27)
SAG0985 RR SAM0992 89
TCS-11 SAG1016 RR SAM1027 S. urinalis 49 SAG1017 HK H36B* SAM1028 67 TCS-12
SAG1327 HK H36B */*** SAM1289
S. gallolyticus 65 SAG1328 RR 515locus) (RR in different SAM1290 73 TCS-13 SAG1624 HK 18RS21 * SAM1583 S. ictaluri 51 covRS (21) SAG1625 RR SAM1584 85 TCS-14 SAG1791 HK SAM1775 S. infantarius 57 dltRS (23) SAG1792 RR CJB111 */***, 515, H36B*/*** SAM1776 73
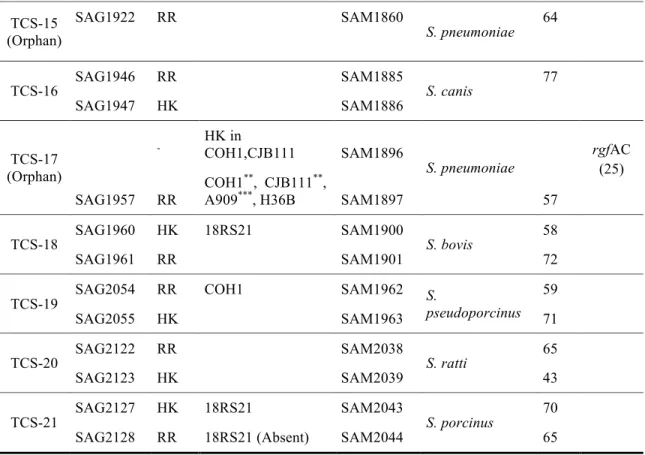
TABLE 1 Comparative genomics of TCS
a
Strains/genomes in which orthologous HK or RR proteins were predicted to be inactivated or exhibited other variations compared to the 2603 V/R strain. Genomes analyzed were A909, 515, H36B, 18rs21, NEM316 , COH1 and CJB111; bNon-GBS species in which the most similar TCS was identified (combined best score for HK and RR proteins, respectively);
c
Percent amino acid identity of HK and RR with the most similar non-GBS putative orthologues. Query cover >95%; dTIGR gene names of hk and rr genes in the CJB111 strain used in the experimental studies; ePreviously reported name (citation); *Reduced sequence quality, **Sequence identity <90%, ***Minor truncation (<40 aa).
TCS-15 (Orphan)
SAG1922 RR SAM1860
S. pneumoniae 64
TCS-16 SAG1946 RR SAM1885 S. canis 77 SAG1947 HK SAM1886 TCS-17 (Orphan) - HK in COH1,CJB111 SAM1896 S. pneumoniae rgfAC (25) SAG1957 RR COH1**, CJB111**, A909***, H36B SAM1897 57 TCS-18 SAG1960 HK 18RS21 SAM1900 S. bovis 58
SAG1961 RR SAM1901 72
TCS-19 SAG2054 RR COH1 SAM1962 S. pseudoporcinus 59 SAG2055 HK SAM1963 71 TCS-20 SAG2122 RR SAM2038 S. ratti 65
SAG2123 HK SAM2039 43
TCS-21 SAG2127 HK 18RS21 SAM2043 S. porcinus 70 SAG2128 RR 18RS21 (Absent) SAM2044 65
2.2 Domain architecture for TCS in the genome of CJB111
For further experimental analysis we shifted our focus to the serotype V strain CJB111 that is more virulent than 2603 V/R in mouse models, and for which a custom microarray was available in-house. The CJB111 TCS gene identified are listed in Table 1. We analyzed the domain architecture of all the HK proteins in the genome of CJB111 and predicted the mechanism of stimulus perception according to criteria reported in the literature (16) (Fig. 5). Nine of the HKs contained an N-terminal domain with two transmembrane helices with a spacer of50-300 aa, typical for extracellular (EX) sensing. Eight HKs contained 2-6 predicted transmembrane-spanning regions separated by short spacers, and were predicted to be membrane sensing (TM). Only one HK was classified as cytoplasmic (C) sensing.
We also observed that all the RR proteins had a DNA-binding output domain, indicating a role as direct transcriptional regulators. Interestingly, the LytTR output domain was the second most common output domain in GBS (15%), while it accounts for a smaller percentage (4%) in prokaryotes in general. LytTR-type output domains have been noted for the control of virulence factors in several important bacterial pathogens (32).
FIG 5 Domain architecture of histidine kinases. Protein sequences were analyzed using SMART
http://smart.embl-heidelberg.de and PFAM domains were included. The scale bar shows the length of sequences in amino acids. Blue vertical bars represent putative transmembrane helices and pink squares represent low complexity regions. Various functional domains are indicated by the remaining colored elements and using the SMART nomenclature (e.g. GAF, PAS, HAMP, PAC). The SMART HATPasec domain in TCS-17/RgfAC is an outlier homolog and was found using the schnipsel database. Sensing mechanisms were manually predicted as TM (TransMembrane), EX (Extracellular) and C (Cytoplasmic).
2.3Transcriptional analysis of TCS
Transcriptional analysis was performed in early logarithmic (EL) and early stationary (ES) phase using a custom microarray chip designed on the CJB111 genome. We noted that several TCS were significantly up-regulated in ES phase, and 3 of these (TCS-2, TCS-16, TCS-21) were up-regulated 4- fold or more (data not shown). As many TCS respond to stress conditions such as those encountered in stationary phase (lack of nutrients, low pH, and accumulation of toxic metabolites), we hypothesized that these systems could be involved in bacterial stress responses and selected them as targets for mutagenesis. To further understand the levels of expression of each selected TCS during bacterial growth in vitro, we measured the gene transcripts of the HKs at four time points (representing early, mid-,
FIG 6 qRT-PCR analysis of selected TCS in four different phases of growth: early (EL), mid
(ML), and late logarithmic (LL), and early stationary phase (ES). Each column represents three biological replicates, and error bars show the SEM. Fold change is relative to the expression level of each system in EL phase.
TCS Name Type Fold change a p-value b TCS-2 SAM0183 HK 6.1 7.4x10⁻⁴ SAM0184 RR* 5.6 6.0x10⁻³ TCS -11 SAM1027 RR* 0.9 n.s. SAM1028 HK 1.5 n.s. TCS -16 SAM1885 RR 4.5 3.8x10⁻³ SAM1886 HK 5.5 1.1x10⁻³ TCS -17 SAM1896 HK 1.1 n.s. SAM1897 RR* 1.6 n.s. TCS -21 SAM2043 HK 37.0 6.0x10⁻⁸ SAM2044 RR 19.5 6.3x10⁻⁵
Table 2 CJB111 expression of selected TCS (a)Relative expression of the TCS in ES
compared to EL growth phase; (b)The fold change was considered not significant (n.s.) if
and late logarithmic and early stationary phases) using a qRT-PCR analysis (Fig. 6). These data confirmed that TCS-2, TCS-16, and TCS-21 are up-regulated only in ES phase.
Transcriptional regulators with the LytTR-type output domains control production of virulence factors in several important bacterial pathogens (32). We consequently selected the three TCS containing RR with a LytTR-type DNA binding domain, i.e TCS-2 (up-regulated at ES phase), TCS-11 and TCS-17/RgfAC, as mutagenesis targets. Thus, a total of five TCS exhibiting either the presence of a LytTR domain and/or up-regulation during ES were selected for further experimentation (Table 2).
2.4 Expression microarray analysis of TCS mutants
The 5 selected TCS loci were modified genetically by in-frame deletion of the genes encoding RRs. There were no apparent differences in colony size, hemolysis, or other macroscopic features between the wild-type strain and the five isogenic mutant strains on blood agar or tryptic soy agar plates (data not shown). Mutant strains grown in complex medium exhibited growth curves identical to the wild-type parental strain (Fig. 7). Global transcriptional analysis was performed by microarray technology. Gene expression of all the predicted genes (n=2,232) in the CJB111 genome was performed by comparing the WT strain with each of the 5 mutant strains in ES phase (Fig. 8A). Experimental design, chip validation, quality control and data analysis were performed as described (see Materials and Methods).
FIG 7 Growth curves of WT and isogenic mutant strains in THB medium. Curves represent
the mean of triplicate samples.
A
B
B
FIG 8 Microarray analysis of TCS mutant strains. Columns represent the number of up-
(green) or down-regulated (red) genes in early stationary (ES) phase, compared to the WT strain. Threshold used is ± 2-fold change and p≤0.05 (A). Venn Diagram showing overlap of gene regulation between the mutants (B).
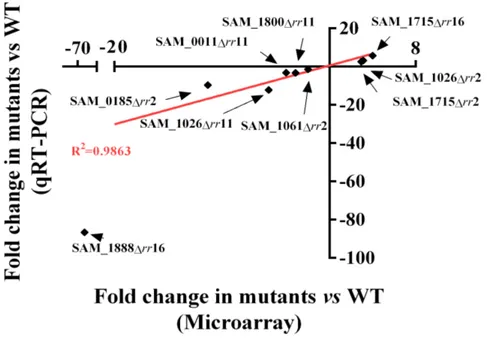
Further validation of the microarray data was performed by qRT-PCR using probes for 9 independent transcriptional units (Fig. 9). Overall, all five mutants exhibited differentially transcribed genes compared to the wild type when using a permissive threshold (+/- 2-fold change and p<0.05). The number of regulated genes ranged from 2 (Δrr17) to 66 (Δrr11). Two mutants (Δrr11 and Δrr21) showed predominantly down-regulated genes, suggesting that these RRs act as activators. We observed that some genes appeared regulated in two or more independent mutant strains (Fig. 8B). In particular, 20 genes were regulated in both Δrr21 and Δrr11 (19 genes down-regulated and 1 gene up-down-regulated in both strains). A more stringent threshold was applied to identify the most highly regulated genes (+/- 4-fold change and p<0.05). Three mutants (Δrr2, Δrr11 and Δrr16) showed a total of 18 highly regulated genes and in two of them such genes were identified adjacent to the TCS locus (Table 3). In particular, the mutant Δrr2 exhibited down-regulation of SAM0185 and SAM0186, encoding two proteins similar to LrgAB in Streptococcus mutans. In this species LrgAB is reported to be under the control of an adjacent TCS (homologous to TCS-2) and was suggested to have a role in the control of virulence and biofilm formation (34, 35). The mutant Δrr16 showed strong down-regulation of an adjacent phosphotransferase system (PTS), and concomitant up- regulation of another PTS system in a different locus. All the highly regulated genes were subjected to confirmation by qRT-PCR, using one probe set per transcriptional unit (Table 3). Moreover, qRT-PCR experiments were repeated on chromosomally complemented
strains where the deleted rr gene was replaced with the WT form, which confirmed that the WT phenotype was restored (Table 3).
FIG 9 Correlation between microarray and qRT-PCR. Values obtained for the two methods
were plotted on the x and y axes. Each dot represents the fold change of mutant versus WT for a highly regulated gene indicated with an arrow. The mutant strains used were Δrr2 (red), Δrr11 (green) and Δrr16 (blue).
Mutant Name Annotation Gene Fold change microarray p-value a Fold change qRT-PCRb Δrr2 SAM0185 LrgA family subfamily,putative lrgA -‐11.5 4.0x10⁻⁵ -6.14/-1.18
SAM0186 LrgB family protein lrgB -‐8.8 1.2x10⁻⁴
Δrr11 SAM0011
Phosphoribosylform yl- glycinamidine
synthase -‐4.0 2.2x10⁻⁴
SAM0012 Amidophosphoribosyl-transferase purF -‐4.0 3.0x10⁻³ -2.23/+2.98
SAM0013 Phosphoribosylform yl-glycinamidine cyclo-ligase purM -‐4.3 2.4x10⁻⁴ SAM0014 Phosphoribosylglyci namide formyltransferase purN -‐4.3 1.8x10⁻³
SAM0064 Ribosomal protein S5 rpsE -‐4.4 1.8x10⁻⁵ -2.01/+1.56 SAM1026 Carbon starvation protein, putative cstA -‐5.7 1.6x10⁻⁵ -10.95/+2.11 SAM1057 Conserved hypothetical protein -‐5.1 1.8x10⁻⁵
SAM1058 Conserved hypothetical protein -‐5.2 5.8x10⁻⁵
SAM1059
Carbamoyl-phosphate synthase,
large subunit carB -‐7.4 3.0x10⁻⁷ -4.72/-1.69
SAM1060
Carbamoyl-phosphate synthase,
small subunit carA -‐4.2 4.2x10⁻² Δrr16 SAM1715
PTS system, IIC
component fruA-2 +4.0 1.4x10⁻⁴ +3.25/-1.06 SAM1716 PTS system, IIA component fruA-2 +4.1 2.6x10⁻⁴
SAM1887
PTS system, IID
component -‐31.6 1.6x10⁻⁷ -324.0/+1.72 SAM1888 PTS system, IIC component -‐72.0 1.0x10⁻⁷
SAM1889
PTS system, IIB
SAM1890
PTS system, IIA
component, putative -‐52.0 1.8x10⁻⁷
TABLE 3 Highly regulated genes in early stationary phase. (a)Inclusion threshold is p ≤
0.05 and fold change ± 4 (compared to WT strain). (b)Fold change of knockout/complemented strains compared to the WT strain.
2.5 Phenotype microarray screening shows that TCS-16 influences carbon source utilization
Our microarray analysis showed differential regulation of two different PTS (SAM1715-1716 and SAM1887-1890) in the Δrr16 mutant strain, suggesting a possible involvement in the monitoring of carbon source availability. The WT and Δrr16 strains were grown on 192 different single carbon sources using the phenotype microarray technology (Fig. 10). One compound showed a clear difference between the WT and mutant strain. The WT strain exhibited growth comparable to the positive control when supplied with fructose-6-phosphate (Fru-6-P), while the Δrr16 strain showed no growth. The experiment was repeated using the complemented strain KIrr16, showing a growth profile indistinguishable from the WT strain (Fig. 10). To confirm this phenotype in an independent system, and to understand if it could be extended to other hexose-6-phosphate sugars, we used a chemically defined medium (36) where glucose, fructose, mannose, or their corresponding hexose-6-phosphate counter parts were used as the primary carbon source (Fig. 11). The WT, Δrr16 and KIrr16 strains grew well on glucose, fructose and mannose while only the WT and KIrr16 strains grew on Fru-6-P. The other phospho-sugars did not allow any bacterial growth. We concluded that TCS-16 is necessary for growth of strain CJB111 on Fru-6-P as the primary carbon source.
FIG 10 Phenotype microarray analysis on WT, Δrr16 and KIrr16 was performed using PM1 and
PM2A plates (http://www.biolog.com/pdf/pmlit/PM1-PM10.pdf). Kinetic plots are shown in red (WT) or in green (mutant and complemented strains), and superimposition is shown in yellow. Metabolic differences between WT and Δrr16 or WT and ΚΙrr16 mutant are shown in superimposed kinetic plots obtained by growing bacteria on PM1 (A and C) or PM2A (B and D).
FIG 11 Growth curves of WT (blue), Δrr16(red) and KIrr16 (green) in CDM
supplemented with 10 mg/ml of glucose (left) or glucose-6-P (right) (A), fructose (left) or fructose-6-P (right) (B), mannose (left) or mannose-6-P (right) (C). Growth curves are from triplicate samples, and background (negative control, no sugar added) was subtracted.
2.6 TCS-16 gene regulation in response to extracellular Fru-6-P
We subsequently investigated the impact of Fru-6-P on transcription of TCS-16 and its adjacent PTS system by qRT-PCR. Bacteria grown in CDM were subjected to a substitution of glucose for Fru-6-P upon entry in mid-logarithmic phase (see materials and methods). The hk16 gene transcription increased 22-fold when bacteria are exposed to Fru-6-P compared to glucose (Fig. 12A). This response was observed in the WT, absent in Δrr16, and partially restored in the complemented KIrr16 strain. Concomitantly (Fig. 12BC), a similar pattern was observed for the adjacent PTS system (3,000-fold up-regulation) and for SAM1402 (2.5-fold up-regulation), a putative hexose-6-P transporter that we identified in the genome of CJB111. A down-regulation of sam1402 gene (1.5-fold) in the Δrr16 strain was also observed in the microarray. Fru-6-P is an intracellular metabolic intermediary of the glycolytic pathway. Bacterial lysis constitutes a possible scenario where Fru-6-P would be found in the extracellular space. We wanted to investigate if TCS16 would respond under such conditions. Bacteria were grown in CDM until mid-logarithmic phase, and the medium was changed to CDM without glucose in the presence or absence of bacterial lysate (see materials and methods). The transcriptional levels of TCS-16, of its adjacent PTS system and of the putative hexose-6-P transporter were then analysed by qRT-PCR. The hk16 gene transcription increased 10-fold when bacteria were exposed to bacterial lysate compared to the control (Fig. 12D). Concomitantly, an up-regulation of the PTS system (200-fold) and sam1402 gene (5-fold) was
observed (Fig. 12E-F). These responses were absent in Δrr16, and totally restored in the complemented KIrr16 strain.
FIG 12 qRT-PCR with probes for SAM1885 (HK) (A, D), SAM1888 (PTS, IIC
component) (B, E), and SAM1402 (putative hexose-phosphate transporter) (C, F), using RNA extracted from WT (black), Δrr16 (gray) and KIrr16 (white). In the top panel (A-C), bacteria grown in CDM were subjected to a pulse of either glucose (Glu) or fructose-6-P (Fru-6-P) as the main carbon source for 30 min prior to RNA extraction. Columns represent relative gene expression when exposed to Fru-6-P, compared to when grown in glucose. In the bottom panel (D-F), bacteria grown in CDM were subjected to a pulse of PBS or bacterial lysate for 30 min prior to RNA extraction. Columns represent relative gene expression when exposed to bacterial lysate, compared to the PBS control. The experiment was performed twice. Columns represent technical triplicates, and error bars show the SEM.
2.7 The RR16 recombinant protein is insoluble when expressed in E. coli
To test if the PTS system and the putative hexose-phosphate transporter where direct targets of the RR16 protein, we decided to perform an electrophoretic mobility shift assay (EMSA). For this purpose the recombinant RR16 protein (rRR16) was expressed in E. coli with a His-tag and purified using the classical affinity chromatography approach. We tested different temperatures (37-25°C), different induction times (2-6-8 hours), different E. coli strains (BL21 DE3, T7 express), different growth media (LB, Biosilta, HTMC) and different lysis condition (mechanical and chemical) and we set up the best conditions to obtain a soluble rRR16 protein. E. coli T-7 express cells transformed with pET15TEV-rRR16-His plasmid were grown in the Biosilta medium at 30°C and induced for 2 hours at 25°C. Cells were then chemically lysed and 20% of the rRR16-His protein (33 KDa) was found in the soluble fraction (Fig. 13A).
The rRR16-His was then purified from the soluble fraction using a His-tag affinity purification strategy (Fig. 13B). Eluted fractions were then pooled, concentrated up to 1/6 of the initial volume and quantified using the BCA method. Samples showed a final concentration of 0.6 µg/µl but a high number of contaminant proteins were also detected on the Coomassie gel. The rRR16-His protein seemed to represent only the 20% of the total proteins in the sample (Fig. 13C). The concentration obtained was then too low to be used for an EMSA.
Figure 13 Expression and purification of the rRR16-His protein. E. coli T-7 express
cells expressing rRR16-His protein were lysate before (NI) and after (I) IPTG induction. Fraction representing the total lysate (T) and the soluble part are displayed on an SDS/PAGE gel and stained with Coomassie blue (A). The elution profiles of rRR16-His protein from a Ni2+ column. Purification was performed only on the soluble fraction obtained after induction. T, the total extract; FT, flow-through fraction; W1-2, wash
fractions; E1-2, fractions eluted with imidazole. Fractions are displayed on an
SDS/PAGE gel and stained with Coomassie blue (B). Protein profile in the elution fractions after Amicon concentration. T, total extract; lane 3-4 show different amount of the same sample (C).The red arrow shows the 33 KDa rRR16-His protein.
To improve the purification protocol we needed to obtain more soluble protein. For this reason we decided to express the rRR16 protein fused with the His-tag and also with a solubility carrier, the MBP (maltose binding protein).
E. coli BL21-DE3 cells transformed with pMal-rRR16-MBP-His plasmid were grown
in the Biosilta medium at 30°C and induced for 8 hours at 25°C. Cells were then chemically lysed and almost 90% of the rRR16-MBP-His protein (70 KDa) was found in the soluble fraction (Fig. 14A).
Using a His-tag affinity purification strategy the 50% of the rRR16-MBP-His protein was purified from the soluble fraction and treated with the TEV protease to remove the carrier protein (Fig. 14B). Unexpectedly, only 10% of the rRR16-MBP-His was successfully cleaved by the TEV, suggesting that the cleaving link was not well accessible for the protease (Fig. 14C).
To then examine the presence of aggregates (or micelles), the samples obtained after the His-tag purification were loaded on a size exclusion chromatography column (SEC). As showed in Fig. 14DE two fractions were obtained. The fist one (Fig. 14D) was obtained at a retention time typical of 400 KDa proteins. We then hypothesized that in this fraction were present aggregates of rRR16-MBP-His proteins, as the main band on the SDS gel is a 70 KDa protein. The second one, obtained at a retention time typical of 40 KDa proteins, contained the MBP (arrow1 Fig. 14E) and two unknown smaller proteins (arrow 2-3 Fig. 14E).
39 MS analysis was unsuccessful and for some reason we were not able to identify the unknown proteins. In any case also this second purification approach did not allow us to obtain a good amount of soluble rRR16 protein.
Figure 14 Expression and purification of the rRR16-MBP-His protein. SDS/PAGE gel and
stained with Coomassie blue E. coli BL21 DE3 cells expressing rRR16-MBP-His protein were lysate before (NI) and after (I) IPTG induction. Fraction representing the total lysate (T) and the soluble part are displayed. The red arrow shows the rRR16-MBP-His protein
(A). The elution profiles of rRR16-His protein from a Ni2+ column. Purification was
performed only on the soluble fraction obtained after induction. S, soluble part; FT, flow-through fraction; W, wash fraction; E1-2, fractions eluted with imidazole. The red arrow
shows the rRR16-MBP-His protein (B). Protein profile of the E1 fraction before (lane 2) and
after (lane 3) TEV treatment. Arrow1, rRR16-MBP-His; arrow 2, MBP-His; arrow 3 rRR16
(C). The elution profiles of rRR16-His protein from a SEC column obtained with 130 ml of
elution volume. Red arrows shows the rRR16-MBP-His protein (D). The elution profiles of rRR16-His protein from a SEC column obtained with 200 ml of elution volume. Arrow1, MBP; arrow 2-3, unknown proteins analyzed using MS (E).
2.8 TCS-16 influences vaginal persistence in mice
In a recent work, carbon catabolite repression in S. pyogenes was shown to influence asymptomatic colonization of the murine vaginal mucosa, suggesting that availability of carbon sources may be subject to monitoring by the bacteria (37). We subsequently investigated whether TCS16 could play a role in bacterial survival during colonization, and utilized the Δrr16 mutant strain in a mouse model of GBS vaginal colonization (38, 39). CD-1 mice in estrus were inoculated with ~1×10⁷
CFU in the vaginal lumen and, on successive days, bacteria were recovered by swabbing and quantified by serial dilution and plating on selective media. Interestingly, the Δrr16 mutant exhibited decreased persistence in the vaginal tract (Fig. 15A). The statistically significant differences were observed at later time points during the experiment (p=0.004, day 5; p=0.02, day 7), and suggested a gradual decline in colonization with the mutant strain while the WT remained relatively stable throughout the experiment. Identical experiments were performed with the remaining mutant strains, and results were similar to those of the WT strain, underlining that the phenotype seen in the Δrr16 mutant was unique among the strains tested.
The phenotype observed above may be due to reduced fitness at the vaginal mucosa and/or reduced adhesion. To test the latter, we investigated bacterial adhesion to vaginal epithelial cells, using a previously described method (39, 40). Bacteria were incubated with confluent HVEC for 30 min, washed extensively, and following cell lysis the bacteria were enumerated. No differences were observed between the WT and Δrr16 strains (Fig. 15B).
In order to test our alternative hypothesis, we attempted to at least partly mimic the ecological niche. Vaginal lavages were collected from CD-1 mice and inoculated
with ~1×10⁶
CFU of WT or Δrr16 strains. Bacterial growth in vitro was followed by viable counts, and after 26 hours a statistically significant (p=0.028) difference was observed (Fig. 15C). The results suggested that Δrr16 exhibited impaired growth/survival compared to the WT strain. In a parallel control experiment, bacteria were incubated in PBS without any vaginal mucoid components (Fig. 15D). Both WT and mutant strains showed a rapid decline in viable counts and after 26 h the vast majority (>99.9%) of bacteria were no longer viable. This clearly showed that the limited presence of vaginal mucoid components was necessary to sustain survival and/or growth of the bacteria during the course of the experiment.
FIG 15 Murine vaginal colonization model. The vaginal lumen of CD-1 mice was
inoculated with 107 CFU of WT or Δrr16 bacteria and bacterial persistence was followed
by viable counts. Results shown are from two independent experiments. The detection limit is represented by a dashed line. Horizontal bars represent medians, and the Mann-Whitney U test was used for statistical analysis (A). Adherence to HVEC cells by WT and Δrr16 strains. Data are expressed as the total adherent CFU recovered compared to the input inoculum (MOI of 1; ~1 × 10⁵ CFU) (B). In vitro growth of WT and Δrr16 strains
in PBS containing vaginal fluid (C) or in PBS (D). Triplicate samples were used and error bars show the SEM. Statistical analysis was performed by 2-way ANOVA.
2.9 TCS-17/RgfAC influences virulence in a murine model of systemic infection
To further investigate the role of the selected TCS in GBS pathogenesis, we compared the relative virulence of CJB111 with the Δrr mutants using an in vivo mouse model of infection (40, 41). CD-1 mice were infected intravenously with 1.5 x 10⁷ CFU of the WT or mutant strains. Bacteremia was confirmed in all mice by viable counts on blood samples collected 24 h post-infection, and there was no significant difference in bacterial loads between WT and mutant strains (data not shown). Over the course of infection, animals were sacrificed at individual end-points (when moribund) or upon termination of the experiments, and blood, brain and lung tissues were collected for bacterial counts. Overall, the only mutant strain with a virulence phenotype was Δrr17, which exhibited a significantly higher mortality compared to that observed during infection with the WT strain (p=0.003, Log Rank test) (Fig. 16A). Interestingly, no significant differences in bacterial loads were observed in brain, blood and lung tissues when comparing the WT and Δrr17 strain (Fig. 16B-D). Blood and brain tissues from mice infected with the Δrr17 strain contained more individual samples with very high bacterial counts, but such samples were exclusively from moribund mice (Fig. 16BC). None of the other mutant strains showed an appreciable difference compared to the WT strain (data not shown).
FIG 16 Murine intravenous challenge model. Kaplan-Meyer survival plot of mice infected with
1.5×10⁷ CFU of bacteria (A). The Log-rank test was used for statistical analysis. Bacterial counts (CFU) in blood (B), brain (C), and lung tissue (D) from individual mice. Horizontal bars represent medians. Mice were euthanized when moribund (red) or at the endpoint (black).
2.10 TCS-17/RgfAC shows higher duplication rate in human blood
Our in vivo data showed no differences in the ability of WT and Δrr17 strains to invade the blood brain barrier (Fig.16C). This observation was also confirmed in vitro, using a previously described method (40). Bacteria were incubated with confluent hBMEC for 30 min (adherence) or for 2 hours (invasion), washed extensively, and following cell lysis the bacteria were enumerated. For the invasion experiment, bacteria and cells were incubated for other 2 hours with antibiotic before the cell lysis. As expected, no differences were observed between the WT and Δrr17 strains (Fig. 17A).
Our in vivo data showed that the Δrr17 strain is more virulent then the WT strain in a systemic model of infection. Moreover a higher number of CFU was detected in the blood of mice infected with the Δrr17 strains compared with those infected with the WT (Fig. 16B). Even if this difference was not statistically significant. To further investigate this phenotype, we compared WT and Δrr17 strains for their ability to grow in human blood in vitro.
Human blood was freshly collected and inoculated with ~1×10⁷
CFU of WT, Δrr17 or KIrr17 strains. Bacterial growth in vitro was followed by viable counts, and after 300 minutes a statistically significant difference was observed between WT and Δrr17 (Fig. 17B). In this condition, the Δrr17 strain showed a higher number of CFU then the WT and complemented strains suggesting a role for this TCS in bacterial duplication in blood. As after 300 minutes most of the blood cells should be dead, we wondering if the same difference could be observed at earlier time point in human plasma.
For this experiment human blood was freshly collected and then fractionating by centrifugation to separate the plasma. Plasma was later inoculated with ~1×10⁷
CFU of WT and Δrr17 and bacterial growth in vitro was followed by viable counts. After 60 and 180 minutes of incubation in plasma a significant difference in the duplication ability of Δrr17 strain was observed (Fig. 17C).
Taken together these data suggest that the higher duplication rate of the mutant strain in human blood could not be due to its ability to better escape the immune system. In fact the Δrr17 strain seems to have an advantage in its duplication rate only when the blood cells are mostly dead or totally absent.
Data shown are preliminary as they are representative of one single experiment. To confirm our hypothesis experiments should be repeated at least other two times with two different donors.
FIG 17 Adherence and invasion of hBMEC cells by WT and Δrr17 strains. Data are expressed as the total adherent CFU recovered compared to the input inoculum (MOI of 1; ~1 × 10⁵ CFU) (A). Percent survival of WT (black), Δrr17 (gray) and KI Δrr17 (white) in human blood. Data are expressed as the total CFU recovered compared to the input inoculum (B). Multiplication factor of WT (black) and Δrr17 (gray) in human plasma. Data are expressed as the total CFU recovered compared to the input inoculum (C). Triplicate samples were used and error bars show the SEM. Statistical analysis was performed by Student’s T-test.
3. Discussion
In the present study, we conducted genome-wide inventory, classification, and comparative genomics of TCS in GBS, and can conclude that they are mostly conserved intra-species. For several of the TCS, putative orthologues were identified in other Streptococcus spp. For the remaining systems, the best hits were always identified in bacteria that are relatively close phylogenetically. However, the degree of sequence identity was more limited and closer scrutiny of gene context and domain architecture would be required to determine the likelihood of such TCS being true orthologues. Such an analysis could result in the identification of TCS that are unique for GBS biology. In our classification of sensing mechanisms, only one HK was classified as cytoplasmic sensing, while this is typically a more frequent category (16). A comparison of the number of TCS (corrected for genome size) in various pathogenic and non-pathogenic Lactobacillales spp. was also performed. In the nine species examined, GBS and S. pyogenes showed the highest frequency of TCS with a median of 38 and 36 TCS components respectively (data not shown), compared to a typical range of 15-32 for the other Lactobacillales. This suggests that the two pathogens may require particular fine-tuning of transcription in response to changing environments.
Transcriptome analysis was performed on five selected systems, and we observed a limited number of genes that were highly regulated for three TCS. TCS-2 regulates the adjacent lrgAB operon, similar to what has been described for S. mutans (35). 11 regulates genes involved in purine metabolism and carbon starvation. TCS-16 highly regulates two PTS operons, and is discussed in more detail below.
TCS-17/RgfAC has already been described in GBS strain O90R, where it negatively regulates transcription of C5a peptidase (scpB), a known virulence factor (25). Moreover, an independent group demonstrated that in CC17 strains RgfAC negatively regulated the fbsA gene, encoding fibrinogen binding proteins (26). FbsA may have a role in protecting the bacteria against opsonophagocytosis, promoting adhesion to lung epithelial cells, and increasing survival in human blood (42, 43). We did not observe any up-regulation of the above genes in the Δrr17 strain, which may be due to differences in the experimental protocol (time points) or in the genetic background (CJB111 belongs to CC1 (44)). Nonetheless, the Δrr17 strain was hypervirulent in our murine model of systemic infection, consistent with a potential up-regulation of virulence factors in the absence of this transcriptional regulator. The second system of particular interest was TCS-16. Transcriptome analysis showed prominent down-regulation of an adjacent operon that encodes a putative PTS (Man/Fru/Sor family) and concomitant up-regulation of another PTS (Fru family). TCS-16 was classified as an extracellular sensing system, and we hypothesized that it may be involved in monitoring and responding to the availability of nutrients (16). When bacteria were subjected to a large variety of different carbon sources in chemically defined medium, one compound, Fru-6-P, resulted in a complete growth defect, which was fully restored when the Δrr16 was complemented. Further experiments in vitro, using phosphorylated and non-phosphorylated hexose sugars confirmed these results. We thus conclude that a functional TCS-16 is necessary for growth on Fru-6-P. Investigation of the transcriptional events in the locus showed
that there is induction of TCS-16 upon exposure to extracellular Fru-6-P, and concomitantly a drastic up-regulation of the adjacent PTS operon. As the Δrr16 strain showed no such response, while the complemented strain exhibited a partial restoration, we conclude that a functional TCS-16 is necessary for autoinduction and regulation of the adjacent PTS operon. We propose that extracellular Fru-6-P is a signal for TCS-16, and that the gene locus be named fspSR, for fructose-six-phosphate sensor histidine kinase and response regulator. Despite the magnitude of the influence on PTS transcription, the growth defect observed in Δrr16/ΔfspR is difficult to explain in terms of a direct link between the up-regulated PTS and utilization of Fru-6-P as an energy source. To our knowledge, PTS-dependent import of phosphorylated sugars has not been described. However, other such uptake mechanisms are known, and UhpT (major facilitator superfamily) in E.coli represents an example where the controlling TCS (UhpAB) is necessary for growth of E. coli upon Glu-6-P and Fru-6-P (45, 46). We identified a homologue of UhpT in the genome of CJB111 (SAM1402), and analysis of the protein suggests it could function as a hexose-6-P transporter (http://www.tcdb.org/). SAM1402 was among the genes significantly down-regulated in the Δrr16/fspR transcriptome and subsequent experiments confirmed that TCS-16/FspSR up-regulates sam1402 in response to extracellular Fru-6-P. The biological relevance of our link between Fru-6-P and TCS-16/FspSR is difficult to ascertain, as the availability of Fru-6-P in the extracellular milieu is presumably limited or unknown. Nevertheless, our in vivo screening showed reduced vaginal persistence of the Δrr16/ΔfspR strain in mice, and a slight but
significant decrease in overall fitness when exposed to vaginal fluid components ex
vivo. Interestingly, the presence of such unknown mucoidal components was
necessary for survival/growth of the bacteria in vitro, when compared to the PBS control. PTS and associated carbon metabolism pathways may have an impact on in
vivo fitness and virulence, as previously demonstrated for several different pathogens
(47-51). One possibility is that Fru-6-P may be released from dying microorganisms in the complex microbiota of the vagina, or in stationary phase in vitro cultures, and GBS could consequently initiate a scavenging response involving up-regulation of sugar transporters. This hypothesis was supported by our data showing that there is an induction of the TCS-16 response upon exposure to bacterial lysate. This response was observed in the WT and complemented strains but not in the Δrr16/ΔfspR strain, confirming that a functional TCS-16 is necessary to up-regulate sugar transporters in the presence of lysed GBS components. Moreover in a previous work using a different strain, the PTS operon above, together with several other PTS were highly down-regulated in high-glucose conditions, supporting a role for this and similar systems in conditions where nutrients are relatively scarce (20). Another speculative possibility is that FspSR may be activated upon entry/invasion of eukaryotic cells, through the presence of Fru-6-P as a central metabolite in glycolysis.
We have listed and classified TCS in GBS for further study and conclude that these TCS are very well-conserved intra-species. Our results provide new insights on four previously unknown TCS, but also provide the first in vivo data supporting a role for RgfAC in virulence. Finally we identified FspRS, a new TCS involved in vaginal persistence and that responds to fructose-6-phosphate by the up-regulation of genes involved in sugar transport.
4. Materials and Methods
4.1 Bacterial strains and growth conditions
GBS CJB111 (Carol Baker Collection, Division of Infectious Diseases, Baylor College of Medicine, Houston). and its isogenic derivatives were grown in Todd-Hewitt broth (THB medium; Difco Laboratories) at 37°C, 5% CO2. Tryptic soy broth
(Difco Laboratories), 15 g/L agar (TSA) was used as solid medium. MAX Efficiency® DH5α™ Competent Cells (Invitrogen) were used for transformation, propagation, and preparation of plasmids. E. coli was grown at 37°C with agitation (180 rpm) in Luria-Bertani (LB, Difco laboratories) broth, or on 15 g/L agar plates (LBA) Erythromycin (Erm) was used for selection of GBS (1 µg/ml) or E. coli (100 µg/ml) containing the pJRS233-derived plasmids used for mutagenesis (see below). Strains CJB111, CJB111Δrr16 and CJB111ΚΙrr16 were also grown in CDM (36), or CDM where glucose was substituted with 10 g/L glucose-6-phosphate, fructose, fructose-6-phosphate, mannose or mannose-6-phosphate (Sigma). Briefly, bacteria grown on THB plates were suspended in 5 ml of PBS until optical density at 600 nm (OD600) reached 0.3. Samples were then diluted 1:10 in PBS and 88 µl of bacteria
were added to 1.2 ml of medium with or without different carbon sources. Bacteria were grown in 96-well plates with 200 µl per well for 48 h at 37°C and OD600 was
monitored automatically every 20 min in an automated reader (Sunrise, Tecan).
To construct each knock out strain, the shuttle vector pJRS233 (52) containing the TCS locus with an in-frame deletion in the response regulator gene (rr) was constructed using a splicing by overlap extension PCR (SOEing-PCR) strategy (Table 4) (53). Briefly, the up- and downstream region of a rr gene were produced from CJB111 gDNA and then joined. The resulting fragment was cloned into pJRS233 using BamHI and XhoI restriction sites.
Five plasmids, each containing an insert with 700-800 bp upstream and downstream of the in-frame deleted rr gene were obtained: pJRS233Δrr2, pJRS233Δrr11, pJRS233Δrr16, pJRS233Δrr17 and pJRS233Δrr21. The CJB111 genes thus inactivated were SAM0184 (rr2), SAM1027 (rr11), SAM1885 (rr16), SAM1897 (rr17), and SAM2044 (rr21).
To construct the respective chromosomally complemented knock-in (KI) strains, the wild type locus was amplified and cloned into pJRS233 using BamHI and XhoI restriction sites (Table 4). These plasmids were designated pJRS233KIrr2, pJRS233KIrr11, pJRS233KIrr16, pJRS233KIrr17 and pJRS233KIrr21.
An insertion/duplication and excision mutagenesis strategy was used to obtain either the in-frame deletion in the response regulator genes or the chromosomal replacement in the knockout mutants. In brief, pJRS233Δrr2/Δrr11/Δrr16/Δrr17/Δrr21 purified from E. coli were used to transform CJB111 by electroporation as previously described (54), except that we used M9 medium without glycine and casamino acids. Transformants were selected by growth on TSA + Erm at 30°C for 48 hours. Integration was performed by growth of transformants at 37°C (non-permissive
temperature for the suicide shuttle vector) with Erm selection. Excision of the integrated plasmid was performed by serial passages in THB at 30°C, and parallel screening for Erm-sensitive colonies on plate. Mutants were verified by PCR sequencing of the TCS loci. We thus obtained five knockout strains, each having an inactivated response regulator gene of a specific TCS: CJB111Δrr2, CJB111Δrr11, CJB111Δrr16, CJB111Δrr17 and CJB111Δrr21. Or, in short, Δrr2 etc.
To obtain the chromosomally complemented strains, plasmids PJRS233ΚΙrr2/KΙrr11/ΚΙrr16/ΚΙrr17/ΚΙrr21 were purified from E. coli and complementation of the respective mutant strains was performed as described above. The end result was replacement of the deleted rr gene with the WT form. The complemented strains were designated CJB111ΚΙrr2; CJB111ΚΙrr11; CJB111ΚΙrr16; CJB111ΚΙrr17; CJB111ΚΙrr21. Or, in short, KIΔrr2 etc.
4.3 Recombinant RR16 cloning, expression and purification
The expression plasmids pET15TEV (Novagen) and pMAL-c4X (Invitrogen vector modified in house) were used to clone the rRR16 protein fused respectively with a His tag and a His-MBP-TEV tag at its N-terminal region. Plasmids were previously modified in house to clone proteins using the PIPE strategy (55). Briefly, rr gene was produced from CJB111 gDNA (i-PCR). Plasmids were linearized by PCR (v-PCR), mixed with the insert in a ratio of 1:3 and used to transform E. coli HK-100 competent cells (Table 4). The resulting constructs were analyzed by DNA
sequencing and expressed in E. coli T7 express (pET15TEV-rRR16-His) (Invitrogen) or E. coli BL21(DE3) (pMal-rRR16-MBP-His) cells resistant to phage T1 (NEB). The cells were grown in EnBase (Biosilta) medium in shaking flasks at 30°C for 16 hours of cultivation, until OD600 about 15, and then induced with 1 mM IPTG for 2
hours (pET15TEV-rRR16-His) or 8 hours (pMal-rRR16-MBP-His) at 25°C. Afterwards the cells were harvested by centrifugation at 6000 rpm for 30 min. The soluble proteins were extracted using the cell lytic buffer (Sigma) and centrifuged 40 min at 9000 rpm to remove the cell debris. Protein affinity purification was performed on a FF-Crude His-Trap HP nickel chelating column (GE Healthcare) pre-equilibrated with the binding buffer (Tris-HCl (pH=8) 20 mM, NaCl 300 mM, Imidazole 10 mM).
The proteins were eluted with 300 mM imidazole; at the end of the Immobilized Metal Ion Affinity Chromatography (IMAC) all the fractions obtained were analyzed by SDS-PAGE.
For the pMal-rRR16-MBP-His purification, the eluted protein was concentrated by ultrafiltration with amicon (Millipore) and the buffer was exchanged using a PD-10 desalting column (GE Healthcare) equilibrated with TEV cleavage buffer (Tris-HCl 50 mM (pH 8), DTT 1 mM, EDTA 0.5 mM). His-MBP-tag was cleaved by incubation with TEV protease. The second step of purification was performed by size exclusion chromatography using HiLoad 26/60 Superdex 200 (GE Healthcare) equilibrated in Tris-HCl 25 mM (pH=8) and NaCl 150 mM. The proteins were quantified with the BCA assay (Pierce).