Back to simplicity: a four- marker blood
cell score to quantify prognostically
relevant myeloid cells in melanoma
patients
Veronica Huber ,1 Lorenza Di Guardo,2 Luca Lalli,1 Daniele Giardiello,1,3 Agata Cova,1 Paola Squarcina,1 Paola Frati,1 Anna Maria Di Giacomo,4 Lorenzo Pilla,5,6 Marcella Tazzari ,7 Chiara Camisaschi,1,8 Flavio Arienti,9 Chiara Castelli,1 Monica Rodolfo,1 Valeria Beretta,1,10 Massimo Di Nicola,2 Michele Maio,4 Michele Del Vecchio,2 Filippo de Braud,2 Luigi Mariani,11 Licia Rivoltini1
To cite: Huber V, Di Guardo L, Lalli L, et al. Back to simplicity: a four- marker blood cell score to quantify prognostically relevant myeloid cells in melanoma patients. Journal for ImmunoTherapy of Cancer 2021;9:e001167. doi:10.1136/ jitc-2020-001167
►Additional material is published online only. To view, please visit the journal online (http:// dx. doi. org/ 10. 1136/ jitc- 2020- 001167).
Accepted 11 October 2020
For numbered affiliations see end of article.
Correspondence to
Dr Veronica Huber; veronica. huber@ istitutotumori. mi. it
© Author(s) (or their employer(s)) 2021. Re- use permitted under CC BY- NC. No commercial re- use. See rights and permissions. Published by BMJ.
ABSTRACT
Background Myeloid- derived suppressor cells (MDSC),
a cornerstone of cancer- related immunosuppression, influence response to therapy and disease outcomes in melanoma patients. Nevertheless, their quantification is far from being integrated into routine clinical practice mostly because of the complex and still evolving phenotypic signatures applied to define the cell subsets. Here, we used a multistep downsizing process to verify whether a core of few markers could be sufficient to capture the prognostic potential of myeloid cells in peripheral blood mononuclear cells (PBMC) of metastatic melanoma patients.
Methods In baseline frozen PBMC from a total of 143
stage IIIc to IV melanoma patients, we first assessed the relevant or redundant expression of myeloid and MDSC- related markers by flow cytometry (screening set, n=23 patients). Subsequently, we applied the identified panel to the development set samples (n=59 patients undergoing first/second- line therapy) to obtain prognostic variables associated with overall survival (OS) and progression- free survival (PFS) by machine learning adaptive index modeling. Finally, the identified score was confirmed in a validation set (n=61) and compared with standard clinical prognostic factors to assess its additive value in patient prognostication.
Results This selection process led to the identification
of what we defined myeloid index score (MIS), which is composed by four cell subsets (CD14+, CD14+HLA- DRneg,
CD14+PD- L1+ and CD15+ cells), whose frequencies
above cut- offs stratified melanoma patients according to progressively worse prognosis. Patients with a MIS=0, showing no over- threshold value of MIS subsets, had the best clinical outcome, with a median survival of >33.6 months, while in patients with MIS 1→3, OS deteriorated from 10.9 to 6.8 and 6.0 months as the MIS increased (p<0.0001, c- index=0.745). MIS clustered patients into risk groups also according to PFS (p<0.0001). The inverse correlation between MIS and survival was confirmed in the validation set, was independent of the type of therapy and was not interfered by clinical prognostic factors. MIS HR
was remarkably superior to that of lactate dehydrogenase, tumor burden and neutrophil- to- lymphocyte ratio.
Conclusion The MIS >0 identifies melanoma patients
with a more aggressive disease, thus acting as a simple blood biomarker that can help tailoring therapeutic choices in real- life oncology.
BACKGROUND
Never like in the last decade the role of the immune system in cancer cure has been so
strongly emphasized.1 Indeed, emerging
evidence indicates that the level and the type of tumor immunity mounted by the host can profoundly influence disease progression and response to treatment in most human malig-nancies and in the majority of cancer thera-pies.2 Patients with pre- existing antitumor immunity, indicated by the presence of a rich and prevalent T- cell infiltrate,3 4 are generally endowed with a better prognosis and have higher chance of benefiting from
chemo-therapy, radiotherapy and immunotherapy.5–7
In contrast, cancers with scant T- cell infil-trates, also defined as ‘immune excluded’ and ‘immune deserts’,8 often display a prevalence of immunosuppressive myeloid cell subsets,
such as myeloid- derived suppressor cells
(MDSC) and tumor- associated macrophages (TAM). This milieu represents the hallmark of a more aggressive disease and reduced sensi-tivity to treatment.9–11 Thus, defining the level and the type of spontaneous tumor immunity can help in implementing patient prognosti-cation and tailoring treatment intervention. Preclinical models clearly proved that the onset of protective tumor immunity requires the coordination of multiple cell types and tissues at organism- wide level.12 However, the
assessment of tumor immunological features has been largely focused on tumor biopsies through the quantifi-cation and the spatial distribution of the immune
infil-trate.13 Systemic immune responses, which influence
tumor rejection or tolerance, may be detectable in the peripheral circulation and hence exploitable to profile immunological cancer features at individual patient level.
This holds particularly true for MDSC, which are gener-ated in the bone marrow by myelopoiesis, enter periph-eral blood and then colonize tumor and immune- relevant sites to exert their regulatory functions.14 MDSC are noto-riously a marker of cancer- associated immunosuppres-sion and the hallmark of a poorly controllable disease in most human cancers.15–17 Preclinical studies have proved these cells to exert a broad array of protumor functions ranging from blunting T- cell immunity to promote neo- angiogenesis, local fibrosis, extracellular matrix remod-eling, epithelial- to- mesenchymal transition and metastatic dissemination.18 Their systemic accrual is associated with aggressiveness and anticipated resistance to treatment ranging from standard chemotherapy and targeted ther-apies to immune checkpoint inhibitors (ICI).18 19 Despite the massive evidence of the role of MDSC as a corner-stone in cancer progression, these cells remain a yet- to- be- exploited biomarker in real- life clinical practice.20 Among the multiple potential reasons the complexity of the phenotypic signatures required for MDSC
quantifica-tion may represent a concrete obstacle.20 Indeed, MDSC
comprise heterogeneous cell subsets clustered by the expression of myeloid markers and a still growing panel of molecules associated with their functional properties.
Canonically, in PBMC, they divide into CD11b+CD33+
C-D14+HLA- DR−/low monocytic (M)- MDSC,21 22 CD14−
C-D15+CD11b+ polymorphonuclear (PMN)- MDSC,23 and
CD14−CD15−CD3−CD19−CD56−HLA- DR−CD11b+CD33+
early- MDSC (eMDSC).24 Additional markers that
distin-guish MDSC subsets from their non- suppressive counter-parts are continuously emerging, such as LOX-1, FATP2,
CD10 or CD16 for PMN- MDSC,25–28 or S100A9, IL- 4Rα,
PD- L1 as well as STAT1 and STAT3 in monocytic MDSC
(M- MDSC).24 29 This indicates a dynamic scenario hardly
reconcilable with clinical practice biomarkers.
Further-more, the recent introduction of high- dimensional
single- cell mass cytometry as a tool for blood immune cell profiling is providing extraordinary insights into the func-tional properties of circulating myeloid cells.30 However, defining a stable, simple but also comprehensive marker panel for translating MDSC quantification into real- life oncology compatibly with these findings is becoming a goal even harder to achieve.
Given these premises, we deemed it essential to investi-gate whether a simple and easy- to- apply approach for the standardized quantification of MDSC could be identified. By a multistep process of marker screening and by the application of a machine learning statistical analysis, we sought to identify a ‘minimal marker core’ that captures the prognostic value of blood myeloid cells and that may be applied in management of melanoma patients.
METHODS Study design
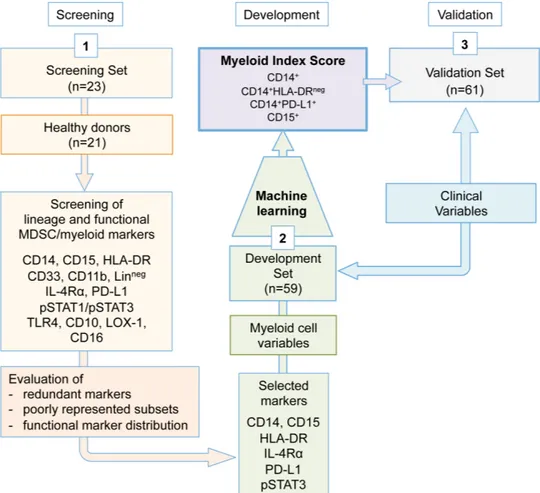
To identify the minimal marker core for myeloid/MDSC quantification in peripheral blood by flow cytometry, we relied on separate case sets of frozen PBMC collected from advanced melanoma patients, whose complete clin-ical information were available. The choice was based on the aim of identifying, through standardized flow cytom-etry staining, myeloid- related immune variables signifi-cantly associated with different disease outcomes. To progressively cut down the required markers, we applied a three- step approach (figure 1). In step 1, the expres-sion of canonical and functional MDSC- related markers was assessed by flow cytometry in PBMC obtained from the melanoma patients of the screening set (n=23), in comparison with healthy donors (n=21). The goal here was to eliminate redundant lineage markers or under- represented cell subsets. In this step, the following markers were applied: CD14, CD15, HLA- DR, CD33, CD11b, homemade lineage pool (CD3, CD56, CD19, CD20), IL- 4Rα, PD- L1, phospho (p)STAT1, pSTAT3, TLR4, LOX-1, CD10 and CD16. In step 2, the selected marker panel (CD14, CD15, HLA- DR, PD- L1, IL- 4Rα and pSTAT3) was applied to baseline PBMC samples of the development set melanoma patients (n=59) to obtain potentially relevant myeloid variables. Thirteen variables (online supplemental table S1) were identified in PBMC based on their lineage CD14 or CD15 marker
expres-sion and the relative frequencies of CD14+ cell subsets
expressing low HLA- DR or positivity for PD- L1, IL- 4Rα or pSTAT3. Additionally, the geomean and the mean fluorescence intensity (GMean and Mean) of pSTAT3 expression were introduced for a more extensive assess-ment of this relevant hallmark for MDSC activity.31 These myeloid variables were then analyzed by the machine learning multivariate approach to verify whether patients could be divided into prognostic groups according to the above cut- off expression of any of these variables. Based on the ranking and on the optimal number of variables (n=4) most frequently selected by the adaptive index modeling (AIM) to fit the prognostic model, the analysis selected four of the 13 variables, that is, CD14+, CD15+,
CD14+PD- L1+ and CD14+HLA- DRneg cells quantified as
percentage in PBMC, referred from now on as ‘MIS’. In step 3, the prognostic value of MIS was then tested in baseline PBMC of the validation set patients (n=61).
Clinical information on melanoma patients and healthy donors
Melanoma patients were enrolled within a multicenter observational study conducted from 2010 to 2016 and comprised a total of 143 patients with unresectable stage IIIc to IV melanoma, Eastern Cooperative Oncology Group performance status scores of 0 to 2 and measur-able disease, including brain metastases. Clinical data including demographics, disease stage, treatment, standard blood tests and other, are depicted in online supplemental table S2. High versus low tumor burden was defined according to the presence or absence,
respectively, of at least one of the following features: (1) high lactate dehydrogenase (LDH; more than 460 U/L); (2) metastases in three or more organs; and (3) sum of the longest diameters of metastatic lesions more than
250 mm.32 The median follow- up period was 37.1
(devel-opment set) and 19 (validation set) months. Patients received treatment until progression or discontinua-tion for excessive side effects. Radiological (MRI or CT scans of brain, bone, chest, abdomen, pelvis and other soft tissue as applicable) and visual (skin lesion) tumor assessments were undertaken at baseline, weeks 12, 20, 28, 36 and then every 12 weeks. Overall survival (OS) was defined as the time from baseline visit (day 0 of treat-ment) to death from any cause. Progression- free survival (PFS) was the time from baseline visit to documented disease progression or death. The events observed were 76 deaths (40 in the development and 36 in the valida-tion sets) and 94 recurrences (45 in the development and 49 in the validation sets). In terms of treatment,
development set patients received first- line/second-
line BRAF inhibitor (BRAFi) (n=34) according to the
MO25515 multicenter phase II study (NCT01307397)33
or ipilimumab+fotemustine (n=25) within the NIBIT- M1
multicenter phase II study (EudraCT 2010-019356-50),32
while the validation set patients were treated according
to current clinical practice (BRAFi ±MEKinhibitor, MEKi, 11/61; ipilimumab, 32/61; nivolumab, 17/61) or with ipilimumab+nivolumab (1/61) within the NIBIT- M2 trial, (EudraCT 2012-004301-27) (online supplemental figure S1). Patients received different schedules and combina-tions based on the experimental and standard therapies available during the enrollment period.
Control PBMC from age- matched and gender- matched healthy blood donors were obtained from the Immuno-hematology and Transfusion Medicine Service (SIMT) at Fondazione IRCCS Istituto Nazionale dei Tumori, Milan, Italy. All patients and healthy donors signed an informed consent to donate blood for immunological analyses (protocols approved by the Institutional Ethical Commit-tees INT39/11 and INT40/11).
Flow cytometry myeloid cell profiling in frozen PBMC
Blood samples (30 mL) were obtained from all mela-noma patients in vacutainer EDTA (Becton Dickinson) and PBMC were isolated by Ficoll gradient (Leuco- sep polypropylene tubes, Thermo Fisher Scientific) within 2 hours of blood collection. Isolated PBMC were frozen in Roswell Park Memorial Institute (RPMI) 1640 (Lonza) containing 10% dimethylsulfoxide (DMSO, Sigma) and 30% fetal calf serum (Euroclone) in a cryobox (CoolCell,
Figure 1 Study design. A three- step approach was applied. Step 1 served in the identification of the minimal myeloid cell variable core. Step 2 comprised the quantification of the myeloid cell variables in the development set samples and the definition of the MIS by adaptive index modeling. In step 3, the MIS was validated in the validation set samples. MDSC, myeloid- derived suppressor cells; MIS, myeloid index score.
BioCision) and stored in liquid nitrogen to be then simul-taneously tested by multicolor flow cytometry within each of the three, screening, development and validation steps
of the study (figure 1). The monoclonal fluorochrome-
conjugated antibodies (mAbs) applied throughout the study are listed in online supplemental table S3. Thawed PBMC were incubated with live/dead (Thermo Fisher Scientific) staining for 30 min on ice and washed, treated with Fc blocking reagent (Miltenyi Biotec; 10 min at room temperature), before incubating with the different mAbs for 30 min at 4°C. Thereafter, samples were washed, fixed and acquired. For intracellular pSTAT1 and pSTAT3 detection, PBMC were permeabilized using fixation buffer and perm buffer III (Becton Dickinson), according to manufacturer’s instructions. For each staining tube,
0.5×10⁶ cells per sample/matrix were used for all mAbs,
apart from pSTAT intracellular detection that required
1×10⁶ cells per sample. However, according to our
expe-rience, the minimal need of biological material for MIS
assessment was 0.5×10⁶ cells, which could be generally
obtained from about 1×10⁶ fresh PBMC usually
retriev-able from 1 mL to 2 mL of peripheral blood.
Samples were acquired by Gallios FC 500 and Cytoflex flow cytometers, while obtained data were analyzed with Kaluza software (all Beckman Coulter), according to the gating strategies depicted in online supplemental figure S2. Gates were set based on isotype- matched control Abs for IL- 4Rα, HLA- DR, PD- L1 and pSTAT3, while internal references were usually applied for lineage markers. Isotype control panels with the respective IgGs were included on basis of cell recovery after thawing, with generally 60% of patients in each experiment day having enough cells to allow isotype control inclusion. For intra-cellular detection of pSTATs, the control IgGs were always included for each patient. Distinct cell subsets repre-senting the myeloid variables were quantified in terms of frequency within PBMC and parent populations. As for the evaluation of GMean and Mean, these parameters were introduced only for the pSTAT3 marker, in addi-tion to the percentage of positive cells to try capture any potential prognostic impact of a pathway highly reflecting
MDSC activation and immunosuppressive activity.31
To standardize the values of GMean and Mean here reported, instrument detector setup for FL2 channel was set so that the PE- Flow- set Pro bead peak gave the expected linear units in log- scale amplification. Given the crucial role of quality control (QC) in our standardized flow cytometry analyses, frozen PBMC of the same cohort (screening, development and validation sets) were evalu-ated simultaneously or within a very limited time frame, in three separate experimental sessions, with samples randomized within the same session. Every experi-ment included frozen PBMC from one or two healthy donors, stained with all single mAbs plus the mix, to set flow cytometer compensation. Daily QC included the use of Flow- Set Pro (Beckman, A69184) to standardize multiple lasers (blue, red and violet) applications, Flow- Check Pro (Beckman, A63493) and CytoFLEX Daily QC
Fluorospheres (Beckman, B53230), fluorescent micro-spheres for optical alignment and fluidics system verifi-cation. All samples of the development set were acquired with a Gallios FC500 flow cytometer, while the validation set samples were acquired using a Cytoflex flow cytometer. All used Abs were titrated to reach the optimal concen-tration to use in the antibody panel mixes. Single mAb lots were used within the same experimental session. As PMN- MDSC, similar to PMN, are susceptible to freezing procedures, guidelines indicate that their reliable detec-tion is confined to fresh cells.24 However, we verified that
CD15+ cells could be reliably quantified in thawed PBMC
using the ‘doublet exclusion gate’, without the live/dead exclusion (online supplemental figure S3A). Indeed, the testing of fresh versus frozen PBMC (performed in n=25 matched samples from melanoma patients) revealed that, despite the significant number of reduced events, PMN- MDSC cell morphology in terms of FSC/SSC is retained after thawing. Likewise, the positivity of cells for CD15 is specific with respect to isotype controls or other lineage markers, such as CD14 (online supplemental figure 3A‒C). Interestingly, PMN- MDSC loss on freezing, that we estimated to be around 45%, seemed proportional to the initial cell frequency, as indicated by the direct
correla-tion (R2=0.8) observed between CD15+ in fresh versus
matched frozen samples (online supplemental figure
3D,E). In contrast, CD14+ monocytes appeared to be less
sensitive to freezing, so that live/dead exclusion, which was performed based on guidelines, did not significantly
impact the CD14+ cell frequencies (online supplemental
figure 3A).
Statistical analyses
Standard descriptive statistics (absolute numbers of observed values and relative frequencies for categorical variables, medians and IQR for continuous variables) were used to describe the sample characteristics. OS and PFS were calculated as the intervals between the date of treatment start and the date of death for any cause/ relapse, with censoring occurring at the date of the last follow- up visit for event- free patients. These endpoints were described by Kaplan- Meier curves and analyzed with univariable and multivariable Cox regression models. As one of the studies (NIBIT- M1) of the development set was multicentric, the LDH values were standardized over the upper normal limit of the laboratories and the
ratio so obtained was log- transformed, log(LDH), to
moderate the markedly skewed ratio distribution.
Multi-variable models were built by AIM,34 a machine learning
method incorporating variable selection and dichotomi-zation. Briefly, a set of binary rules such as ‘marker X>c’ (or ‘marker X<c’) for each of the K markers was identi-fied, where the chosen cut- off was the value c that maxi-mizes the score test statistics. Variables were sequentially added according to a forward selection procedure, each time selecting the variable with the highest statistic score. The overall number of variables retained in the model was chosen by means of cross- validation. The output was
an index score that, based on the AIM algorithm, selects a subgroup of variables exceeding the identified cut- offs at the individual patient level. For univariate and multi-variate analyses, missing data imputation was applied, as the values for some clinical variables (such as LDH, neutrophil- to- lymphocyte ratio, NLR, absolute neutro-phil count, ANC and white blood cells, WBC) were not available in about 20% patients. We applied ‘missForest’, a random forest approach that allows to handle multivar-iate data consisting of continuous and categorical vari-ables simultaneously, while consenting the assessment of the quality of imputation by estimating out- of- bag
(OOB) imputation error.35 OOB performance estimates
quantifying the quality of imputation were: NRMSE=0.93 (normalized root mean squared error) for continuous variables and PFC=0.03 (proportion of falsely classified entries) for categorical variables.
Cox model performance was assessed by computing bootstrap- adjusted Harrell’s concordance c- index. Anal-yses on the pooled set of 120 melanoma patients were performed after 10- fold multiple imputation of missing data using a random forest approach.35 Longitudinal anal-ysis of myeloid populations was based on pairwise t- tests. Statistical analyses were performed with SAS (V.9.2, SAS Institute) and R software (V.3.1.1, R Foundation for Statis-tical Computing). The conventional two- sided 5% level was chosen as the threshold of statistical significance.
RESULTS
Identification of the minimal core of myeloid cell variables
Despite the existing guidelines, the continuous identifi-cation of a still growing number of markers aimed at a more specific discrimination of MDSC subsets compli-cates the achievement of a definitive consensus on MDSC signatures. This could represent one main reason for the scarce implementation of peripheral blood MDSC ment in real- life clinical practice. Indeed, MDSC assess-ment involves the detection of complex and technically challenging flow cytometry signatures. To overcome this limit, we sought to investigate whether a ‘minimal myeloid cell variable core’ could capture the global prognostic value of blood MDSC accrual. To this aim, we designed a study based on PBMC frozen samples collected from advanced melanoma patients, whose clinical information, including disease outcome, were available. The choice of using frozen samples was motivated by the possibility of identifying prognostic variables, while minimizing inter- assay variability by running simultaneous flow cytometry within the same experimental case set. The use of thawed samples could be associated with a potentially heteroge-neous loss of cells depending on the type of myeloid cell subset, referring in particular to the highly susceptible PMN/PMN- MDSC population. For this reason, a consis-tent comparison of matched frozen versus fresh PBMC was performed to develop reliable staining procedures, as reported in the Methods section.
To define the minimal myeloid marker core, stored PBMC were submitted to a multistep process finalized to first define a panel of essential MDSC- related markers, which were then evaluated for their prognostic value, singly and jointly, by a machine learning multivariate approach, to provide the most potent myeloid score with the lowest possible number of myeloid cell variables (figure 1).
In step 1 screening phase, we defined an essential
MDSC- related marker panel using PBMC from n=23
stage IIIc to IV melanoma patients and n=21 age and
gender- matched healthy donors as a platform. We
observed that the canonical myeloid markers CD33 and
CD11b24 were redundant with respect to CD14 expressed
by monocytes and M- MDSC, as well as CD15 expressed
by PMN- MDSC. Indeed, CD14+ and CD14+HLA- DR−
cells showed completely overlapping frequencies when the gating strategy included or not CD33 and CD11b markers (online supplemental figure S4A,B). Similarly,
PMN- MDSC quantified as CD15+ or CD15+CD11b+ cells
provided analogous percentages (online supplemental figure S4C). We also observed that the subset of e- MDSC, which is defined by the lack of most lineage markers as CD14−CD15−CD3−CD19−CD56−HLA- DR−CD11b+CD33+
cells, was substantially undetectable (<1%) in our case set (data not shown). Based on this observation and given our goal to minimize the MDSC- related marker panel, we decided to exclude eMDSC from subsequent analyses.
To enrich our phenotypic analysis with functional molecules that have been reported in literature to poten-tially associate with MDSC activation and differentiation pathways, the expression levels of PD- L1, IL- 4Rα, TLR4, pSTAT1 and pSTAT3 was also explored in the screening melanoma set of patients with respect to a group of age
and gender- matched healthy donors. Results showed
that while TLR4 and pSTAT1 were expressed either by
the totality of CD14+ cells and/or with no significant
differences between melanoma patients and donors,
the percentages of PD- L1, pSTAT3 and IL-
4Rα-posi-tive monocytes displayed significant differences (online supplemental figure 4D), suggesting potential prognostic implications. For the definition of PMN- MDSC, we used a gating procedure that allowed reliably detecting these
cells in thawed PBMC by their CD15+ expression, as
detailed in the Methods section. Cells expressing other PMN- MDSC markers such as LOX-1, CD10 and CD16 consistently expressed also CD15 and were represented in different and heterogeneous proportions within the
CD15+ PMN- MDSC gate, as shown in the representative
plots of online supplemental figure 4E. This suggested that CD15 could sufficiently encompass the diverse PMN- MDSC subsets in our setting.
In sum, the panel of essential MDSC markers emerging
from the screening included CD14, CD15, HLA- DR,
PD- L1, IL- 4Rα and pSTAT3, leading to the definition of the myeloid cell variables (online supplemental table S1) to be then assessed in the development set for prognostic impact by machine learning multivariate analysis.
Development and validation of the MIS
Steps 2 and 3 of the study (figure 1) were performed
with samples of a total of 120 stage IIIc to IV metastatic melanoma patients, whose clinical features are depicted in online supplemental table S2. Divided into develop-ment (n=59) and validation (n=61) sets, these patients were enrolled at baseline of first or second line therapy with BRAFi±MEKi (n=45) or ICI- based treatments (ipili-mumab, nivolumab or both; n=75) (online supplemental figure 1). In step 2, PBMC samples from melanoma patients of the development set were evaluated for the frequencies of the myeloid cell variables selected in the screening phase and comprising CD14+, CD15+, CD14+
H-LA- DR−, CD14+PD- L1+, CD14+IL- 4Rα+ and CD14+pSTAT3+
(online supplemental table S1). pSTAT3 expression was also evaluated as GMean and Mean for a deeper
assess-ment of this relevant MDSC activity pathway.31 Obtained
data was then crossed with patient disease outcome eval-uated as PFS and OS. The AIM was applied to build a prognostic score, which incorporated the joint contribu-tion of all myeloid cell variables to the clinical outcome. The machine learning approach produced a ranking of the immune variables associated with disease outcome and showed that four of them were most frequently retrieved as fitting the predictive model (online supple-mental figure S5A). The four selected variables were those included in the MIS and were represented by CD14+, CD15+, CD14+HLA- DRneg and CD14+PD- L1+ in
PBMC. As depicted in online supplemental figure S5B, the frequency of the CD14+HLA- DRneg and CD14+PD- L1+
in the CD14+ population ranked right after the first four
variables, with Max score values (the observed partial like-lihood score test statistics for the main effect, whose lower values indicate a better fitting) slightly higher than those displayed by the same cell subsets in PBMC. The MIS stratified melanoma patients according to progressively shorter OS (figure 2A). These variables showed different
cut- off points but always corresponded to relatively
high percentiles (75% for CD15+, 89% for CD14+ and
CD14+PDL-1+ cells, 85% for CD14+HLA- DRneg, table 1).
The levels above cut- off of any of the identified cell subsets consistently implied a higher risk of progression, indicating the existence of positive association patterns.
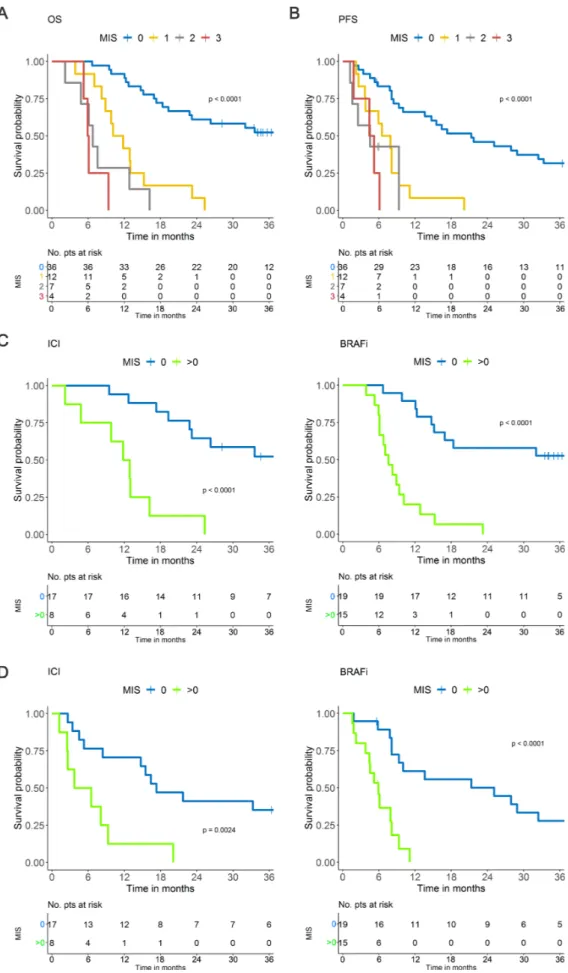
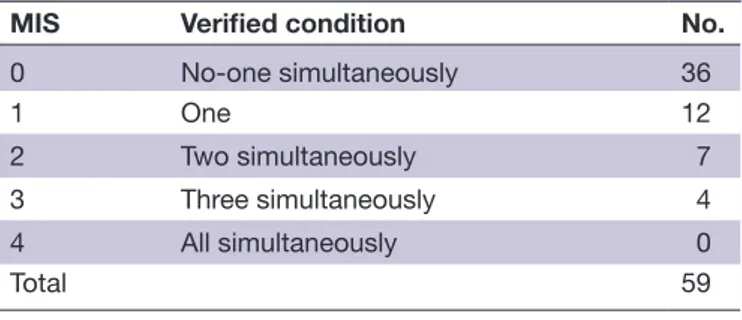
The MIS allowed the detection of four melanoma patient groups characterized by 0, 1, 2 or 3 variables exceeding their respective cut- off values (table 2). There was a notable difference in OS between patients with no factors exceeding the cut- off values (MIS=0, 36 patients, median OS >33.6 months) and the remaining patients (MIS 1→3, 23 patients), whose median OS progressively deteriorated from 10.9 (MIS 1) to 6.8 (MIS 2) and 6.0
months (MIS3) (figure 2A). The degree of divergence
among the curves was statistically significant (p<0.0001) and HR rose from 5.85 for MIS 1 to 12.7 and 32.6 for MIS 2 and 3, respectively, with respect to MIS 0 (c- index=0·745,
table 3).
MIS divided melanoma patients into four groups also
in terms of PFS (p<0.0001) (figure 2B), indicating a
potential impact of the score on response/resistance to therapy as well. When we stratified the patients according to the type of therapy applying a dichotomized MIS (with MIS=1 to 3 groups collapsed to avoid sparse data), MIS>0 was strongly associated with worse OS and PFS with respect to MIS=0 in both BRAFi- treated (p<0.0001) and ICI- treated (p<0.0001, p=0.0024) patients (figure 2C,D). This evidence suggests that MIS has a prognostic value, indicating that systemic myeloid cell dysfunctions contribute to the treatment resistance not only for ICI but also for targeted therapies, as already indicated in multiple preclinical and clinical settings.
In step 3, MIS variables were then tested in the valida-tion set (n=61) applying the above selected cut- offs. MIS=0 was less represented with respect to the development set (36/59 development versus 13/61 validation), while a MIS=4 group displaying all the variables above the cut- offs appeared (online supplemental table S4 and online supplemental figure S6A,B) in line with the worse clinical outcomes observed for validation set patients with respect to those of the development set (online supplemental table 2 and online supplemental figure 7). As expected, also in the validation set MIS stratified melanoma patients into groups with progressively worse disease outcomes as the MIS increased, both in terms of OS (p<0.0001) and PFS (p<0.0001) and again independently of therapy with ICI or BRAFi/MEKi (online supplemental figure S6A- C).
Altogether, these analyses point to MIS as a potent biomarker for capturing the negative prognostic value of circulating myeloid cells in advanced melanoma patients based on the expression of four phenotypic targets.
Prognostic effect of MIS with respect to clinical variables and biomarkers
Even if based on a simple test strategy, MIS assessment requires some technical efforts related to PBMC isolation and the use of flow cytometry, a detection approach not so frequently applied in oncological diagnostics. To prove the additive value of MIS quantification in management of melanoma patients, we compared its prognostic effect with respect to that of clinical variables routinely used in standard practice, including the NLR recently revis-ited as a reliable prognostic factor potentially related to
PMN- MDSC.23
To match the prognostic effects of MIS with respect to the clinical variables, we analyzed the whole case set of 120 melanoma patients, by pooling development and validation set patient data to consent a more solid model tuning and re- estimated the MIS on the basis of
optimized cut- offs (figure 3A–C, (online supplemental
table 5A). The distribution of dichotomized MIS in the global population showed that a MIS>0 intercepted about 45% of advanced stage IIIc to IV melanoma patients, with n=31, 13, 7 and 4 patients displaying MIS 1, 2, 3 and 4,
respectively (figure 3D and online supplemental table
5B). Of note, the analysis of the entire cohort with the original cut- offs defined in the development set showed overlapping results (online supplemental figure S8).
Figure 2 MIS in the development set. (A) MIS in the OS and (B) in the PFS. (C) MIS in the OS of patients receiving ICI (left panel) or BRAFi (right panel) based on dichotomized classification (0; >0). (D) MIS in the PFS of melanoma patients receiving ICI (left panel) or BRAFi (right panel) based on dichotomized classification (0; >0). BRAFi, BRAF inhibitor; ICI, immune checkpoint inhibitors; MIS, myeloid index score; OS, overall survival; PFS, progression- free survival; pts, patients.
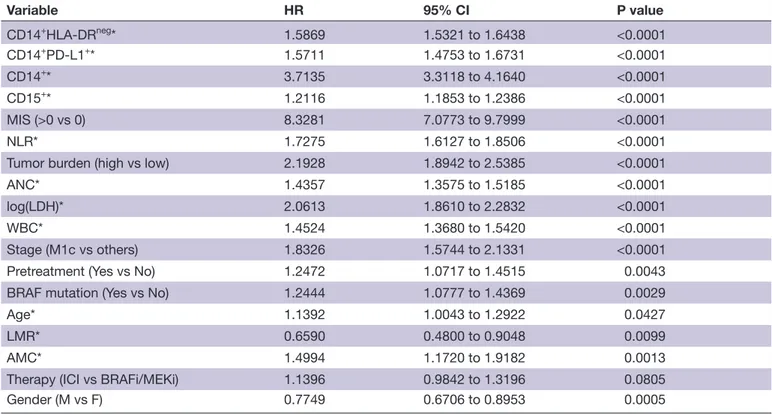
table 4 depicts the results of the univariate Cox model analysis of the whole patient case set, with MIS and clin-ical variables analyzed as continuous parameters or dichotomized as indicated. This analysis revealed that MIS displayed the highest HR (HR 8.3, p<0.0001) among all the variables, including LDH, WBC, ANC, tumor burden, stage and NLR. HR estimate for NLR (HR 1.73, p<0.0001) is consistent with published data and recent
meta- analyses.36 In addition, other blood cell count
parameters such as absolute monocyte count (AMC) and lymphocyte- to- monocyte ratio (LMR), showed significant HRs although with lower P values. Of note, the single MIS variables (CD14+, CD15+, CD14+PD- L1+ and CD14+HLA- DRneg) displayed statistically significant correlations with OS, but their HRs (ranging from 1.2 to 3.7) were lower than that displayed by MIS (HR 8.3), indicating the potentiating effect of our score with respect to the single MDSC subset quantification (table 4). Notably, univariate analyses of MIS variables according to dichotomization, calculated based on new cut- offs optimized on univariate analyses with the same criteria used for the construction of MIS, showed that all four variables retained significant HR estimates (table 5).
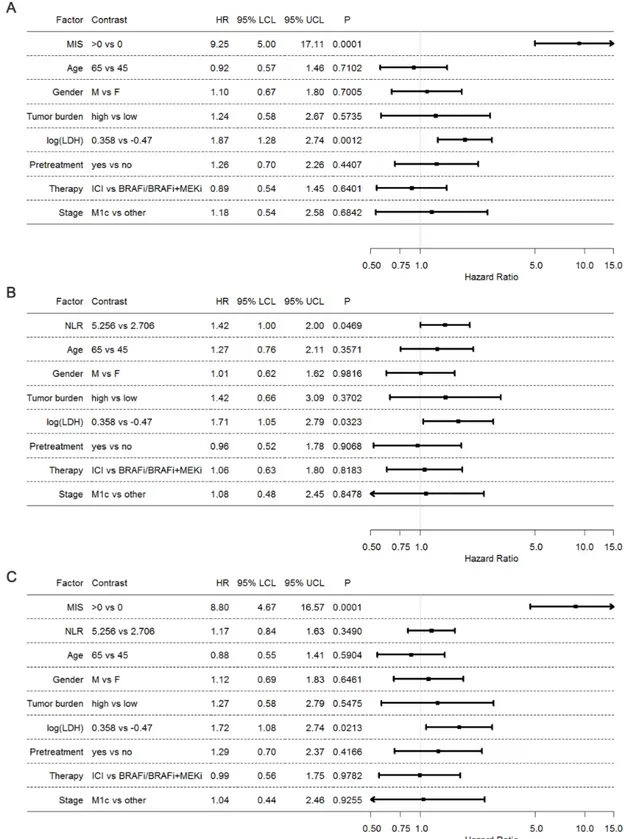
Finally, we assessed by multivariate joint modeling the independence and the implementing contribution of MIS with respect to prognostic clinical biomarkers commonly applied in melanoma patients such as LDH, tumor burden and NLR. The results obtained by this analysis showed a still high HR of the MIS (HR 9.25, p=0.0001), confirming that the prognostic effect of our score is solid despite the
adjustment of the other variables (figure 4A). A
compa-rable analysis including instead NLR, showed a weaker
association with OS (HR 1.42, p=0.0469), indicating that in this case, the addition of the other variables influences and reduces the prognostic effect of the NLR (figure 4B).
Thus, the overall performance of the multivariate anal-ysis was better when the model included MIS (Harrell c=0.81) rather than NLR (Harrell c=0.71), supporting the implementing value of the MIS as clinical parameter for prognostication of melanoma patients. When both MIS and NLR were incorporated in the multivariable model (figure 4C), only MIS retained its prognostic effect, while the effect of NLR was even more attenuated and lost its statistical significance. These findings further demon-strate that NLR could not be a valid competitor of our MIS as a predictive tool.
DISCUSSION
Although cancer survival rate has significantly improved over the years, it is well established that patients displaying
specific tumor- related immune dysfunctions, such as
systemic myeloid cell accrual or lack of local immune surveillance, rapidly progress and poorly respond to
treatment.17 Nevertheless, standardized biomarkers to
intercept these patients in real- life clinical practice are still scanty. Here we propose to exploit the MIS to fill this gap in melanoma. The MIS represents a relatively simple flow cytometry blood test that could be applied to metastatic melanoma patients for implementing stan-dard prognostic factors and plan therapeutic choices also on the basis of individual immunological features. MIS is built on the combined expression of four lineage and functional myeloid markers that emerged to sufficiently surrogate MDSC prognostic value. Indeed, MIS stratifies melanoma patients into groups with progressively shorter OS and PFS and when >0, it identifies patients with 8.3 HR of treatment failure, as assessed in univariate analysis (table 4). The prognostic effect of MIS is independent of clinical parameters, such as tumor burden, stage, LDH, line of treatment and NLR.37 Interestingly, MIS ability to intercept poor outcome of patients is significantly higher than that displayed by all the tested clinical and biological factors, providing its additive value in melanoma patient clinical management.
Myeloid cells are a plastic population, whose role in cancer can be complex and divergent depending on the functional state and which is regulated by fine metabolic
Table 1 MIS cut- offs and quantiles in the development set
Variable
(in PBMC, %) Cut- off Quantile No. >cut- off
CD14+HLA- DRneg >2.90 85.00 26
CD14+PD- L1+ >4.50 89.00 15
CD14+ >20.00 89.00 29
CD15+ >1.87 75.00 20 PBMC, peripheral blood mononuclear cells.
Table 2 Classification and distribution according to MIS variables in the development set
MIS Verified condition No.
0 No- one simultaneously 36
1 One 12
2 Two simultaneously 7 3 Three simultaneously 4 4 All simultaneously 0
Total 59
MIS, myeloid index score.
Table 3 Multivariable Cox model of HR stratified by MIS on OS
MIS (reference) HR (95% CI) P value*
1 (0) 5.85 (2.63 to 13.00) <0.0001 2 (0) 12.71 (4.75 to 34.00)
3 (0) 32.63 (8.73 to 122.02)
c- index: 0·745.
*P value with two- sided Wald test. MIS, myeloid index score.
pathways that are becoming a target of emerging anti- inflammatory and anti- cancer strategies.38 Nevertheless, their central role in virtually all treatment modalities, including surgery, chemotherapy, radiotherapy, immu-notherapy and targeted therapy, is still largely unex-plored. Our study proves that few and general markers encompassing both monocytic and granulocytic cells, including MDSC, provide an overview on the prognostic impact that myeloid blood cells can exert in melanoma patients. Indeed, MIS includes CD14+, CD14+HLA- DRneg,
CD14+PD- L1+ and CD15+ cells, which are all cell subsets
largely proved to be involved in cancer- related immuno-suppression and disease aggressiveness.21 27 39–42
The AIM sequentially includes variables to the extent that they provide additional predictive information. Our MIS, in which three of the four selected features include total CD14+ cells and two CD14+ subsets (HLA- DRneg and
PD- L1+) can be potentially explained by the existence of
one or more additional underlying and still unknown
subpopulation(s) of CD14+ cells, which is/are better
Figure 3 MIS in the global population. (A) MIS in OS. (B) MIS in PFS according to optimized cut- offs. (C) MIS in the OS of melanoma patients receiving ICI (left panel) or BRAFi/BRAFi+MEKi (right panel) based on dichotomized classification (0; >0). (D) Distribution of the 120 melanoma patients stratified by MIS (0 to 4) calculated according to optimized cut- off levels. Red, positive; white: negative. BRAFi, BRAF inhibitor; ICI, immune checkpoint inhibitors; MEKi, MEK inhibitor; MIS, myeloid index score; OS overall survival; PFS, progression- free survival; pts, patients.
quantified by the combination of all subsets rather than by any single CD14+ feature.
Levels above the cut- offs of any of these subsets are sufficient to predict significantly poorer OS and PFS on therapy. This implies that melanoma- associated myeloid alterations may be phenotypically heterogeneous even among patients with the same malignancy and stage, due to different myelo- conditioning tumor properties and likely inter- individual variability.
The fact that the frequencies of CD14+HLA- DRneg and
CD14+PD- L1+ subsets appeared to be more prognostically
relevant when referred to total PBMC than when
calcu-lated within CD14+ cells should not be ascribed to the
indirect prognostic influence of CD14+ population per
se, since the AIM is supposed to select only independent
and non- redundant variables. Rather, these data suggest that a potential impact could be displayed by the non- myeloid population present in PBMC, for instance lymphocytes. Indeed these cells, representing the vast majority of PBMC, are not included in the present algo-rithm, but they could still indirectly influence prognosis.
For instance, the frequency of CD14+HLA- DRneg and
CD14+PD- L1+ cells could impact on the frequency in
PBMC of selected lymphocyte cell subsets that, in turn, have also prognostic relevance. This hypothesis is in a way suggested by the evidence that T- cell subsets such as CD8+PD-1+ T cells inversely correlate with the frequency
of CD14+HLA- DRneg cells, as assessed in a group of the
MIS patients (data not shown).
Table 4 Univariate analyses of the MIS and other clinical variables
Variable HR 95% CI P value CD14+HLA- DRneg* 1.5869 1.5321 to 1.6438 <0.0001 CD14+PD- L1+* 1.5711 1.4753 to 1.6731 <0.0001 CD14+* 3.7135 3.3118 to 4.1640 <0.0001 CD15+* 1.2116 1.1853 to 1.2386 <0.0001 MIS (>0 vs 0) 8.3281 7.0773 to 9.7999 <0.0001 NLR* 1.7275 1.6127 to 1.8506 <0.0001 Tumor burden (high vs low) 2.1928 1.8942 to 2.5385 <0.0001 ANC* 1.4357 1.3575 to 1.5185 <0.0001 log(LDH)* 2.0613 1.8610 to 2.2832 <0.0001 WBC* 1.4524 1.3680 to 1.5420 <0.0001 Stage (M1c vs others) 1.8326 1.5744 to 2.1331 <0.0001 Pretreatment (Yes vs No) 1.2472 1.0717 to 1.4515 0.0043 BRAF mutation (Yes vs No) 1.2444 1.0777 to 1.4369 0.0029 Age* 1.1392 1.0043 to 1.2922 0.0427 LMR* 0.6590 0.4800 to 0.9048 0.0099 AMC* 1.4994 1.1720 to 1.9182 0.0013 Therapy (ICI vs BRAFi/MEKi) 1.1396 0.9842 to 1.3196 0.0805 Gender (M vs F) 0.7749 0.6706 to 0.8953 0.0005
*Continuous variables, evaluated as contrast of the fourth versus the first quartile of the variable distribution.
AMC, absolute monocyte count; ANC, absolute neutrophil count; BRAFi, BRAF inhibitor; ICI, immune checkpoint inhibitor; LDH, lactate dehydrogenase; LMR, lymphocyte- to- monocyte ratio; MEKi, MEK inhibitor; MIS, myeloid index score; NLR, neutrophil- to- lymphocyte ratio; WBC, white blood cells.
Table 5 Univariate analysis of MIS variables after dichotomization*
Variable HR 95% CI Cut- off P value
CD14+HLA- DRneg 6.6236 2.6215 to 16.7361 >3.80 <0.0001
CD14+PD- L1+ 7.7874 3.0801 to 19.6893 >4.50 <0.0001
CD14+ 5.4763 2.7027 to 11.0960 >16.60 <0.0001
CD15+ 6.0004 2.8211 to 12.7637 >1.87 <0.0001 *MIS variables were dichotomized according to the indicated cut- offs, calculated as optimized on univariate analyses. The level of statistical significance was set at the conventional 5% two-sided level.
The heterogeneity of treatments received by patients evaluated within this study might represent a limitation. Indeed, the treatments included single/double BRAFi
and MEKi, ICI as monotherapy (with a prevalence of ipilimumab versus nivolumab) or in combination with chemotherapy. Additionally, the therapies were not
Figure 4 Joint assessment of MIS and clinical variables. (A) Forest plot representing HR of Cox multivariable model obtained by backward selection. (B) Forest plot representing HR of Cox multivariable model of the clinical variables without MIS. (C) Forest plot representing HR of Cox multivariable model of the clinical variables with MIS. The categorical variables gender, tumor burden, pretreatment, therapy and stage were modeled as such, while age, log(LDH) and NLR were linearly modeled as continuous variables. HR estimates were referred to the corresponding IQR. BRAFi, BRAF inhibitors; ICI, immune checkpoint inhibitors; LCL, lower confidence limit; log(LDH), log- transformed lactate dehydrogenase; MEKi, MEK inhibitor; MIS, myeloid index score; UCL, upper confidence limit; NLR, neutrophil- to- lymphocyte ratio.
totally comparable between discovery and validation cohorts. However, this scenario reflects the times of enrollment, witnessing ICI experimental testing and then approval, as well as the flourishing of multiple pharma- driven competing clinical trials. Because of this hetero-geneity, we were unable to perform subgroup analyses in melanoma patients treated with the same drugs, which would have been of great interest in a clinical perspec-tive. However, we believe that a finding across different treatments strengthens the value of our approach in prognostication.
Our study was purposely designed on retrospectively collected melanoma patient case sets and frozen PBMC. In fact, this approach allowed developing a myeloid- related prognostic score thanks to the availability of clinical outcome data and the minimized inter- assay vari-ability consented by simultaneous flow cytometry of the same case set samples. The MIS represents a test that can be rapidly performed with quite limited amount of PBMC and could be applied to retrospectively stratify melanoma patients enrolled in clinical trials comprising PBMC collec-tion and storage. The control experiments performed here and the adapted gating strategies indicated that thawed PBMC can be reliably profiled for myeloid cell subset quantification, despite a significant but propor-tional loss of mainly PMN- MDSC on freezing. However, we have no evidence yet that the MIS cut- offs defined in these experimental conditions could be applied to fresh PBMC, a required condition for a real translation of the MIS from bench to bedside. We also acknowledge that PBMC separation may represent an additional obstacle to the broad application of MIS or other MDSC- related quantification tests in clinical practice and a potential source of technical variations linked to sample handling. For this reason, and in line with a recent call by the Milieu
Interieur Consortium to develop whole blood- based
immune cell phenotyping,43 we received funding from
the ERA PerMed 2020–2023 Program (Project: Quanti-fying systemic immunosuppression to personalize cancer
therapy, Reference number: ERAPERMED2019-320)44
to develop a whole blood MIS- related assay in prospec-tive study, which includes a large number of patients with different solid malignancies. Indeed, a systematic and standardized quantification of blood MDSC across different cancer clinical settings would reveal if the quan-tification of individual systemic myeloid cell dysfunctions might help personalize real- life cancer therapy. As MDSC are also potent mediators of pro- tumor activity, patients displaying high accrual of these cells could be scheduled to treatments impacting the number or function of these cells. The growing evidence that standard therapies,
including chemotherapy or anti- angiogenics,6 45
poten-tiate tumor immunity through their off- target effects on myelopoiesis, suggests that MIS might also support the design of new strategies aimed at maximizing clinical synergy.
CONCLUSION
In summary, we propose the MIS as a tool to identify melanoma patients unlikely to benefit from current therapeutic strategies because of their systemic myeloid dysfunctions. MIS is based on a few fundamental myeloid alterations in baseline blood and identifies melanoma patients at high risk of early progression, independent of type of therapy. Our results warrant ongoing and future clinical trials to understand if myeloid conditioning could potentiate treatment efficacy and favor disease outcome. MIS may help stratifying melanoma patients and select treatment according to individual systemic immune dysfunctions.
Author affiliations
1Unit of Immunotherapy of Human Tumors, Fondazione IRCCS Istituto Nazionale dei Tumori, Milan, Italy
2Department of Medical Oncology and Hematology, Fondazione IRCCS Istituto Nazionale dei Tumori, Milan, Italy
3Division of Molecular Pathology, Netherlands Cancer Institute, Amsterdam, The Netherlands
4Center for Immuno- Oncology, University Hospital of Siena, Siena, Italy 5Unit of Immuno- biotherapy of Melanoma and Solid Tumors, IRCCS San Raffaele Hospital, Milan, Italy
6Division of Medical Oncology, Ospedale San Gerardo, Monza, Italy
7Immunotherapy–Cell Therapy and Biobank Unit, IRCCS Istituto Romagnolo per lo Studio dei Tumori (IRST) "Dino Amadori", Meldola, Italy
8Biomarkers Unit, Department of Applied Research and Technical Development, Fondazione IRCCS Istituto Nazionale dei Tumori, Milan, Italy
9Immunohematology and Transfusion Medicine Service (SIMT), Fondazione IRCCS Istituto Nazionale dei Tumori, Milan, Italy
10Experimental Hematology Unit, IRCCS San Raffaele Hospital, Milan, Italy 11Unit of Clinical Epidemiology and Trial Organization, Fondazione IRCCS Istituto Nazionale dei Tumori, Milan, Italy
Contributors Conception and design: VH, LM and LR. Development of methodology: VH, LL, DG, LM and LR. Data acquisition: all authors. Analysis and interpretation of data: all authors. Manuscript writing, review and revision: all authors. Administrative, technical or material support: AC, PS, PF and VB. Study supervision: LR.
Funding This work was supported by the Associazione Italiana per la Ricerca sul Cancro (AIRC) Special Program 5X1000 ('Innovative Tools for Cancer Risk Assessment and early Diagnosis', no. 12162) to LR, and AIRC investigator grant IG20752 to LR, AIRC investigator grant IG15373 to MM; by the European Union’s Horizon 2020 Research and Innovation Programme grant agreement no. 686089 (PRECIOUS), and by the TRANSCAN2 ERANET (CALL TRANSCAN_2015) Project ER-2017-2364968 - TRS-2016-00000393 CE (JTC 2015)).
Competing interests None declared.
Patient consent for publication Not required.
Ethics approval Observational protocols have been approved by the Institutional Ethical Committees INT39/11 and INT40/11 of the Fondazione IRCCS Istituto Nazionale dei Tumori, Milan, Italy. The study included also secondary data analysis of primary clinical studies NCT01307397, EudraCT 2010-019356-50 and EudraCT 2012-004301-27.
Provenance and peer review Not commissioned; externally peer- reviewed.
Data availability statement All data relevant to the study are included in the article or uploaded as supplementary information.
Supplemental material This content has been supplied by the author(s). It has not been vetted by BMJ Publishing Group Limited (BMJ) and may not have been peer- reviewed. Any opinions or recommendations discussed are solely those of the author(s) and are not endorsed by BMJ. BMJ disclaims all liability and responsibility arising from any reliance placed on the content. Where the content includes any translated material, BMJ does not warrant the accuracy and reliability of the translations (including but not limited to local regulations, clinical guidelines,
terminology, drug names and drug dosages), and is not responsible for any error and/or omissions arising from translation and adaptation or otherwise.
Open access This is an open access article distributed in accordance with the Creative Commons Attribution Non Commercial (CC BY- NC 4.0) license, which permits others to distribute, remix, adapt, build upon this work non- commercially, and license their derivative works on different terms, provided the original work is properly cited, appropriate credit is given, any changes made indicated, and the use is non- commercial. See http:// creativecommons. org/ licenses/ by- nc/ 4. 0/.
ORCID iDs
Veronica Huber http:// orcid. org/ 0000- 0001- 6304- 3575 Marcella Tazzari http:// orcid. org/ 0000- 0002- 8112- 1773
REFERENCES
1 Kelly PN, Priscilla NK. The cancer immunotherapy revolution. Science 2018;359:1344–5.
2 Galluzzi L, Zitvogel L, Kroemer G. Immunological mechanisms underneath the efficacy of cancer therapy. Cancer Immunol Res 2016;4:895–902.
3 Barnes TA, Amir E. Hype or hope: the prognostic value of infiltrating immune cells in cancer. Br J Cancer 2017;117:451–60.
4 Thorsson V, Gibbs DL, Brown SD, et al. The immune landscape of cancer. Immunity 2018;48:e14:812–30.
5 Stanton SE, Disis ML. Clinical significance of tumor- infiltrating lymphocytes in breast cancer. J Immunother Cancer 2016;4:59. 6 Mlecnik B, Berger A, Pages F, et al. Immunoscore® as a predictor of
response to chemotherapy in stage II and stage III colon cancer. J Immunother Cancer 2015;3:P89.
7 Havel JJ, Chowell D, Chan TA. The evolving landscape of
biomarkers for checkpoint inhibitor immunotherapy. Nat Rev Cancer 2019;19:133–50.
8 Turan T, Kannan D, Patel M, et al. Immune oncology, immune responsiveness and the theory of everything. J Immunother Cancer 2018;6:50.
9 Bonavida B, Chouaib S. Resistance to anticancer immunity in cancer patients: potential strategies to reverse resistance. Ann Oncol 2017;28:457–67.
10 Sharma P, Hu- Lieskovan S, Wargo JA, et al. Primary, adaptive, and acquired resistance to cancer immunotherapy. Cell 2017;168:707–23. 11 Massi D, Rulli E, Cossa M, et al. The density and spatial tissue
distribution of CD8+ and CD163+ immune cells predict response
and outcome in melanoma patients receiving MAPK inhibitors. J Immunother Cancer 2019;7:308.
12 Spitzer MH, Carmi Y, Reticker- Flynn NE, et al. Systemic immunity is required for effective cancer immunotherapy. Cell 2017;168:e15:487–502.
13 Binnewies M, Roberts EW, Kersten K, et al. Understanding the tumor immune microenvironment (TIME) for effective therapy. Nat Med 2018;24:541–50.
14 Ouzounova M, Lee E, Piranlioglu R, et al. Monocytic and
granulocytic myeloid derived suppressor cells differentially regulate spatiotemporal tumour plasticity during metastatic cascade. Nat Commun 2017;8:14979.
15 Engblom C, Pfirschke C, Pittet MJ. The role of myeloid cells in cancer therapies. Nat Rev Cancer 2016;16:447–62.
16 Kumar V, Patel S, Tcyganov E, et al. The nature of myeloid- derived suppressor cells in the tumor microenvironment. Trends Immunol 2016;37:208–20.
17 Ai L, Mu S, Wang Y, Shidai M, Wang H, et al. Prognostic role of myeloid- derived suppressor cells in cancers: a systematic review and meta- analysis. BMC Cancer 2018;18:1220.
18 Pawelec G, Verschoor CP, Ostrand- Rosenberg S. Myeloid- derived suppressor cells: not only in tumor immunity. Front Immunol 2019;10:1099.
19 Weber J, Gibney G, Kudchadkar R, et al. Phase I/II study of metastatic melanoma patients treated with nivolumab who had progressed after ipilimumab. Cancer Immunol Res 2016;4:345–53. 20 Tesi RJ. MDSC; the most important cell you have never heard of.
Trends Pharmacol Sci 2019;40:4–7.
21 Filipazzi P, Valenti R, Huber V, et al. Identification of a new subset of myeloid suppressor cells in peripheral blood of melanoma patients with modulation by a granulocyte- macrophage colony- stimulation factor- based antitumor vaccine. J Clin Oncol 2007;25:2546–53. 22 Mengos AE, Gastineau DA, Gustafson MP. The CD14+HLA- DRlo/
negmonocyte: an immunosuppressive phenotype that restrains
responses to cancer immunotherapy. Front Immunol 2019;10:1147. 23 Zhou J, Nefedova Y, Lei A, et al. Neutrophils and PMN- MDSC: their
biological role and interaction with stromal cells. Semin Immunol 2018;35:19–28.
24 Bronte V, Brandau S, Chen S- H, et al. Recommendations for myeloid- derived suppressor cell nomenclature and characterization standards. Nat Commun 2016;7:12150.
25 Condamine T, Dominguez GA, Youn J- I, et al. Lectin- type oxidized LDL receptor-1 distinguishes population of human polymorphonuclear myeloid- derived suppressor cells in cancer patients. Sci Immunol 2016;1:pii: aaf8943:aaf8943.
26 Veglia F, Tyurin VA, Blasi M, et al. Fatty acid transport protein 2 reprograms neutrophils in cancer. Nature 2019;569:73–8. 27 Lang S, Bruderek K, Kaspar C, et al. Clinical relevance and
suppressive capacity of human myeloid- derived suppressor cell subsets. Clin Cancer Res 2018;24:4834–44.
28 Scapini P, Marini O, Tecchio C, et al. Human neutrophils in the saga of cellular heterogeneity: insights and open questions. Immunol Rev 2016;273:48–60.
29 Cassetta L, Baekkevold ES, Brandau S, et al. Deciphering myeloid- derived suppressor cells: isolation and markers in humans, mice and non- human primates. Cancer Immunol Immunother 2019;68:687–97. 30 Krieg C, Nowicka M, Guglietta S, et al. High- dimensional single- cell
analysis predicts response to anti- PD-1 immunotherapy. Nat Med 2018;24:144–53.
31 Vasquez- Dunddel D, Pan F, Zeng Q, et al. Stat3 regulates arginase- I in myeloid- derived suppressor cells from cancer patients. J Clin Invest 2013;123:1580–9.
32 Di Giacomo AM, Ascierto PA, Pilla L, et al. Ipilimumab and fotemustine in patients with advanced melanoma (NIBIT- M1): an open- label, single- arm phase 2 trial. Lancet Oncol 2012;13:879–86. 33 Larkin J, Del Vecchio M, Ascierto PA, et al. Vemurafenib in patients
with BRAF(V600) mutated metastatic melanoma: an open- label, multicentre, safety study. Lancet Oncol 2014;15:436–44. 34 Tian L, Tibshirani R. Adaptive index models for marker- based risk
stratification. Biostatistics 2011;12:68–86.
35 Stekhoven DJ, Bühlmann P. MissForest--non- parametric missing value imputation for mixed- type data. Bioinformatics 2012;28:112–8. 36 Zeng Q, Liu Z, Li Q, et al. Prognostic value of neutrophil to
lymphocyte ratio and clinicopathological characteristics for multiple myeloma: a meta- analysis. Medicine 2018;97:e12678.
37 Mezquita L, Auclin E, Ferrara R, et al. Association of the lung immune prognostic index with immune checkpoint inhibitor outcomes in patients with advanced non- small cell lung cancer. JAMA Oncol 2018;4:351–7.
38 Pålsson- McDermott EM, O'Neill LAJ. Targeting immunometabolism as an anti- inflammatory strategy. Cell Res 2020;30:300–14. 39 Roux C, Jafari SM, Shinde R, et al. Reactive oxygen species
modulate macrophage immunosuppressive phenotype through the up- regulation of PD- L1. Proc Natl Acad Sci U S A 2019;116:4326–35. 40 Watanabe R, Shirai T, Namkoong H, et al. Pyruvate controls the
checkpoint inhibitor PD- L1 and suppresses T cell immunity. J Clin Invest 2017;127:2725–38.
41 Huber V, Vallacchi V, Fleming V, et al. Tumor- derived microRNAs induce myeloid suppressor cells and predict immunotherapy resistance in melanoma. J Clin Invest 2018;128:5505–16. 42 Weber R, Fleming V, Hu X, et al. Myeloid- derived suppressor cells
hinder the anti- cancer activity of immune checkpoint inhibitors. Front Immunol 2018;9:1310.
43 Brodin P, Duffy D, Quintana- Murci L. A call for blood- in human immunology. Immunity 2019;50:1335–6.
44 ERA PerMed 2nd joint transnational call for proposals (2019). Available: https://www. era- learn. eu/ network- information/ networks/ era- permed/ personalised- medicine- multidisciplinary- research- towards- implementation/ quantifying- systemic- immunosuppression- to- personalize- cancer- therapy
45 Schaaf MB, Garg AD, Agostinis P. Defining the role of the tumor vasculature in antitumor immunity and immunotherapy. Cell Death Dis 2018;9:115.