UNIVERSITÁ DEGLI STUDI DI CATANIA
FACOLTÁ DI SCIENZE MATEMATICHE, FISICHE E NATURALI
XXVII CICLO - DOTTORATO DI RICERCA IN FISICA
CRISTINA PUGLIATTI
PARTICLE SCINTILLATING TRACKERS:
DESIGN AND READ‐OUT OF REAL‐TIME, LARGE‐AREA,
HIGHLY SEGMENTED DETECTORS
_________
PHD THESIS
__________Tutor:
Chiar.mo Prof. Domenico Lo Presti
Supervisor:
Chiar.mo Prof. Giovanni Valerio Russo
PhD coordinator:
Chiar.mo Prof. Francesco Riggi
CONTENTS
INTRODUCTION 6 CHAPTER 1 SCINTILLATING PARTICLE TRACKERS 13 1.1 PARTICLE TRACKERS 13 1.1.1 DETECTION PRINCIPLE 13 1.1.2 DETECTION CHARACTERISTICS 14 1.2 LARGE‐AREA HIGHLY SEGMENTED DETECTORS 17 1.2.1 APPLICATIONS 17 1.2.2 SPECIFICATIONS FOR HIGH SPATIAL AND ANGULAR RESOLUTIONS 181.2.3 SMART READ‐OUT STRATEGIES TO GIVE UP REAL‐TIME PERFORMANCES 20
1.3 SCINTILLATING TRACKERS AS A GOOD COMPROMISE FOR THE SELECTED APPLICATIONS 22 1.3.1 INTRODUCTION 22 1.3.2 SCINTILLATING MATERIALS 22 1.3.3 PLASTIC SCINTILLATORS 24 1.3.4 SCINTILLATING FIBERS 27 1.4 CONVERSION OF THE LIGHT SIGNAL INTO AN ELECTRICAL SIGNAL 29 1.4.1 PHOTO‐SENSORS 29 1.4.2 SIPM CHARACTERISTICS 34 1.5 PROCESSING OF THE ELECTRICAL SIGNAL 38 1.5.1 ANALOG TO DIGITAL CONVERTER, COMPARATOR AND READ‐OUT ELECTRONICS 38
1.6 TRACKS RECONSTRUCTION 38
1.6.1 RECONSTRUCTION ALGORITHMS 38
CHAPTER 2 THE OFFSET3 TRACKER 40
2.1 INTRODUCTION 40
2.2 THE FIRST OFFSET PROTOTYPE 41
2.2.1 ARCHITECTURE 41
2.2.2 COLLECTION OF THE SCINTILLATION LIGHT: THE PHOTOSENSOR 42
2.2.3 FRONT‐END AND READ‐OUT ELECTRONICS 43
2.3 THE NEW OFFSET3 DETECTOR 44
2.3.1 NEW DETECTOR DESIGN IDEA 44
2.3.2 APPLICATION OF THE SMART READ‐OUT STRATEGY 45 2.3.3 COLLECTION AND DETECTION THE SCINTILLATION LIGHT 47 2.4 DETECTORS TESTS WITH COSMIC RAYS AND BETA SOURCES 49
2.4.1 OFFSET 49
2.4.2 OFFSET3 50
2.5 TESTS WITH 62‐250 MEV PROTONS AND 400 MEV/A CNAO CLINICAL BEAMS 55
2.5.1 OFFSET 55
2.5.2 OFFSET3 57
CHAPTER 3 THE MUON PORTAL PROJECT: GENERAL FEATURES 60
3.1 MOTIVATION FOR THE PROJECT 60
3.4 LOCALIZATION OF HIGH Z HIDDEN MATERIALS 69
3.4.1 MOTIVATIONS 69
3.4.2 MUON TOMOGRAPHY 70
3.4.3 ALTERNATIVE TECHNIQUES 72
3.5 OTHER APPLICATIONS OF MUON TOMOGRAPHY 76
3.5.1 PYRAMIDS IMAGING 76
3.5.2 VOLCANO TOMOGRAPHY 77
3.5.3 NUCLEAR REACTORS MONITORING 80
3.5.4 FOSSIL FUEL MONITORING 80
3.6 THE MUON PORTAL PROJECT 81
CHAPTER 4 FROM THE OFFSET3 TO THE PORTAL: KNOW HOW TRANSMISSION 83
4.1 INTRODUCTION 83
4.2 MUON PORTAL PROJECT: DETECTOR ARCHITECTURE 84
4.2.1 OVERALL SENSITIVE VOLUME 84
4.2.2 MODULES 85
4.2.3 SCINTILLATING STRIPS 87
4.3 CONVERSION OF THE SCINTILLATING LIGHT BY SILICON PHOTO‐MULTIPLIERS 87
4.3.1 OPTIMIZATION OF LIGHT COLLECTION 87
4.3.2 OPTICAL GLUE AND REFLECTIVE LAYER 92
4.3.3 SIPMS CHARACTERIZATION 92
4.4 MEASUREMENTS OF THE SIPMS BREAKDOWN VOLTAGE (BV) 96
4.5 FRONT‐END AND READ‐OUT ELECTRONICS 98
4.5.1 APPLICATION OF THE SMART READ‐OUT STRATEGY 99 4.5.2 ELECTRONICS ARCHITECTURE 100 4.6 DETECTOR SIMULATION AND COSMIC RAYS GENERATION 103 4.7 RECONSTRUCTION ALGORITHMS 104 4.8 MODULE TESTS 107 4.8.1 PRELIMINARY TESTS ON A COMPLETE MODULE 107 CONCLUSIONS 110 APPENDIX 115 ACKNOWLEDGMENTS 118 REFERENCES 119 PUBLICATIONS 124
INTRODUCTION
The scientific research has been always motivated by two strong reasons: the intrinsic curiosity in human nature to know himself and what surrounds and the desire to improve the quality of life by bridging as much as possible the needs of contemporary society.
Applied physics was born as a consequence of the second motivation. Being inspired by the knowledge of basic physics, it plays a key role in technological innovation and has the ability to apply the same developed technology to more areas of interest.
This PhD thesis aims to show as technological advances and suitable technical solutions make scintillation detectors for charged particles capable of being applied in two research areas completely different, but both of great interest for improving the quality of human life:
(1) Medical diagnostics, in particular before or during a tumour treatment with hadrons (hadrontherapy);
(2) Tomography by cosmic ray radiation (1muon tomography) applied to cargo containers for the identification and localization of potential radioactive substances that are illegally transported.
In the following, the structure of this thesis is illustrated, with the description, the characterization and the possible applications of a particular category of particle detectors of interest for these two research issues: large-area, highly segmented trackers, made of scintillating materials.
The detection principle underlying the functionality of every particle detector is the energy transfer of a crossing particle to the sensitive volume of the device and the conversion of this energy into a detectable electrical signal.
Charged particles lose their energy through electromagnetic collisions with electrons or atomic nuclei that compose the crossed material, causing its excitation or ionization. Instead, neutral particles must first generate intermediate reactions that allow the formation of charged particles that can, in turn, energize or ionize the atoms of the material that characterizes the detector itself.
1 Muons are elementary particles belonging to the lepton family, which also
consists of the electron, the tau and neutrinos particles. A muon is roughly 200 times more massive than an electron ( 105.7 / ). It has a unitary negative electric charge −1 and a spin 1⁄2.
For example, gas detectors are able to directly detect charged particles by gas ionization phenomena and the consequent generation of a proportional electrical signal that is finally measured.
In case of the indirect detection, e.g. by using scintillators, the excitation and ionization of the detector atoms contribute to induce electronic transitions with a subsequent emission of light; the latter is successively converted into an electrical signal via electronics devices such as photodiodes and photomultiplier tubes.
Scintillation detectors are widely used in physical research, i.e. high-energy physics, spectroscopy, neutron detection, calorimetry, residual range measurements and Positron Emission Tomography (PET). If the scintillation detector is able to reconstruct the track of the particle, it is classified as scintillation particle tracker.
A tracker detector consists of at least two detector of position placed at a certain distance one from the other. In some cases each tracking plane is made of two physical layers, one for each spatial coordinate X or Y. The track of a particle that crossed a detector can be reconstructed from the measurement of the impact point position in each detection plane. 3D tracks can be reconstructed by using appropriate algorithms performing an off-line or a real-time software analysis.
In Chapter 1 an exhaustive description of scintillation detectors for charged particles in general that focuses in more detail on the trackers with large-area and highly segmented is addressed.
The application fields for large-area trackers with a high segmentation level are multiple. For example, they could observe atmospheric showers by measuring coincident events with other detectors of the same type placed at a certain distance each other. Another important application field is in nuclear and particle physics. Indeed, the reaction products from the beams collision, or from a single particle source can be studied.
Considering the total number of readout channels of highly segmented trackers with large area, it could be too much large if the resolution were the one to read all of them individually. In Chapter 1, a smart read-out channel reduction strategy is proposed. It is very useful if applied to these types of detectors in order to give up real-time performances. This architecture reduces the number of read-out channels for a segmented linear detector.
In order to reach the required performances of high spatial/angular resolution, the proposed solution is the employment of scintillating trackers, which are an optimal quality/price compromise among the various models of detectors present in the market. Indeed, the relative reduced cost of plastic scintillators respect to other materials (e.g. Silicon, Germanium or Ceramics) and the possibility to modelling different shapes and sizes are of good advice for large-area detectors also to obtain a high segmentation. In particular, by using the scintillating fibers (Sci-Fis) it is possible to curve fibers in order to apply the compression channel technique at an optical level by routing the optical fibers in a suitable way. The described technique permits to achieve real-time performances for the read-out; lately, in the following sections, the properties of the scintillating materials are described in detail.
As mentioned in issue (1), a research field of great interest for large-area
trackers with a high segmentation level is the medical physics with the specific
following applications:
• Radiography and tomography of human tissues; • Monitoring and imaging of a clinical beam;
• Positioning of a patient before a hadrontherapy treatment.
Because of the increasingly strong social demand, hadrontherapy for the cancer treatment is a research field that grows continuously up. During a cancer treatment, the advantage of employing charged particles such as proton or carbon ions is related to a better control of the amount of released dose compared to conventional radiotherapy, preserving the surrounding healthy organs and tissues. Furthermore, the direct knowledge of the energy loss by a particle that interacts with the tissue provides much more accurate information on the delivered dose than x-ray tomography and therefore allows to check the correct positioning of the patient. Starting from these considerations, the necessity to have a particle tracker able to provide real-time images of the area to be treated is essential.
With this purpose, the OFFSET (Optical Fiber Folded Scintillating Extended
Tracker) Research Project (INFN, Nation Institute of Nuclear Physics - Italy) started in
the year 2010 with the namesake tracker prototype. The aim of the project is to realize a detector for the real-time imaging and tracking of charged particles with high spatial resolution and low complexity to be applied in medical diagnostic, made of water
equivalent material (this requirement is optimal for disturbing as least as possible a
clinical beam).
In Chapter 2 of present thesis, the design and characterization of a charged particles tracker, the OFFSET3 detector are described and compared to the characteristics of the previous OFFSET prototype. The detector is suitably designed for medical physics diagnostics.
After evaluating the good performances of the OFFSET prototype, it was decided to build an operating tracker that could harness the same technological innovations of the previous model. The sensitive areas of both detectors are made of 500 μm squared multi-cladding BCF-12 Sci-Fis provided in pre-glued and pre-aligned ribbons by the manufacturer (Saint-Gobain corporation). The resulting spatial resolution is 500 μm/ 12 (calculated as for a segmented detector). The main designing difference is related to the number of tracking planes. While OFFSET is made of a single positioning plane X-Y, obtained as a superimposition of two Sci-Fi layers orthogonal to each other, OFFSET3 is a complete charged particle tracker made of two positioning planes X-Y spaced 100 mm. Hence, the latter detector is 2 mm water equivalent thick. In addition, the tracker sensitive area 288x288 mm2 size, obtained by curving the ribbons (576 fibers each) with the optimal bending radius of about 5 cm is larger than the one of the OFFSET prototype (200x200 mm2). This characteristic makes OFFSET3 more suitable for medical imaging application such as radiography or tomography. In
measurement of the beam specifications, such as uniformity and penumbra. This information is useful for an accurate tumor treatment or for an accurate positioning of the patient before a treatment.
In both detectors the smart read-out strategy introduced in Chapter 1, allowing a considerable reduction in the number of optical channels to be coupled to the photo-sensor is deeply described for the specific cases. The strategy allows to reconstruct the track of a charged particle that crosses the sensitive area of the detector by using a reduced number of read-out channels than other segmented detectors with the same initial number of channels, reducing also costs and complexity. I.e., the OFFSET3 planes are read with the same number of optical channels needed for a single one. The hit event is decoded by measuring the light output in bound coincidence at both edges of each fiber.
Moreover, the modularity and scalability of the associated electronics simplifies the integration of the detector in a treatment chamber for hadrontherapy. The read-out electronics is based on programmable logic FPGA boards achieving real-time acquisition performances (up to 5 MHz sampling rate).
Both the prototype and the tracker can be characterized exploiting different sources, such as cosmic rays, 90Sr and ion beams. The performances have been tested with 60 MeV, 250 MeV proton and 400 MeV/A clinical carbon beams available at the Center for Advanced Nuclear Applications and Hadrontherapy (CATANA) in the
Laboratori Nazionali del Sud (LNS) in Catania (Italy) and at the Centro Nazionale di Adroterapia Oncologica (CNAO) in Pavia (Italy). The corresponding test descriptions
and data analysis results are reported in Chapter 2.
The technological know-how acquired with the design, construction and characterization of the OFFSET3 detector has been of great assistance for the construction of the Muon Portal Detector (PORTAL). The latter fits in the topic that was anticipated in issue (2): the muon tomography for the safety transport of goods inside containers.
In Chapter 3 the motivations for the Muon Portal Project (2011-2015 Italian national project with several partners, founded by National Operative Programme PON), other possible scanning techniques for security (container inspection) and additional applications of muon tomography are deeply described.
At first, an introduction of the problem is necessary in order to understand in which way scintillator trackers can be useful. One of the most critical challenges remaining to the international security establishment is related with the effective detection of nuclear materials, also properly shielded. In 2008, the following note was written in a report by the US General Accounting Office: “we found that a cargo
container containing a radioactive source was not detected as it passed through radiation detection equipment that DOE had installed at a foreign seaport because the radiation emitted from the container was shielded by a large amount of scrap metal. Additionally, detecting actual cases of illicit trafficking in weapons-usable nuclear material is complicated: one of the materials of greatest concern in terms of proliferation - highly enriched uranium - is among the most difficult materials to detect
In this context, there is a clear necessity for a specific solution to overcome this highly dangerous threat. The requirements for a screening system are:
• Distinguish broad range of contraband cargo containers; • Provide density, shape and composition images;
• Scan consolidated cargo without unpacking;
• Rapid scans (a few minutes/container) and short acquisition time; • Minimum number of false indications;
• Comply with strict radiation safety requirements for both operating staff and cargo irradiation;
• Readily integrated with existing port/airport systems; • Reasonable capital and operating costs.
Considering worldwide ports, the traffic of containers transported by cargo ships it is estimated in 200 Millions containers per year. Despite many of them could illegally transport nuclear weapons or material hidden inside, only the 1% of them is inspected because of the lack of appropriate scanning systems.
Nowadays, high-energy x-ray or γ-ray radiography and tomography are the most commonly used screening techniques, providing high-resolution images of shape and density. The x-ray radiography technique was pioneered in the 1930s and has become a cornerstone of modern diagnostic medicine and non-destructive industrial material analysis. Modern tomography systems came of age in 1972 and use computer to process the tomographic information to enhance the signal to noise ratio of the image, identify critical features in enhanced visualizations and to allowing multiple slices of the object to be assembled and analysed as a three-dimensional object. Further data processing algorithms have allowed the interpretation of scattering information as radiation passes through a material – versus attenuation information used in traditional x-ray tomography – as a means of studying the composition and structure of the internals of an object. These methodologies can be employed, with statistical analysis, to use the multi-path scattering of radiation to produce tomographic images that provide sufficient information about the energy and direction of the radiation as it enters and leaves the object.
In order to create the radiography image, a heterogeneous beam of x-rays is produced by an x-ray generator (energy range of 10-100 keV) and is projected toward the object. A certain amount of x-rays is absorbed by the crossed object, in correlation with the density and composition. Usually, x-rays that pass through the object are captured behind the object by a detector. For a more accurate resolution measurement, it has better to placing a detector plane also before the object to be studied in order to track each crossing particle before and after the collision with the object. Then, the detectors can provide a superimposed 2D representation of the object internal structures. The application of alternative techniques, such as directional gamma imaging and neutron radiography, is complex and expensive, and the performances can be seriously degraded in presence of shielding materials.
energy and angular range useful for tomography. The detection principle is based on the detection of the scattering angle of each muon from cosmic ray radiation as a result of crossing a high-Z material (both nuclear material and high-Z shielding materials). Indeed, the angular and position deflections of the trajectory are very sensitive to the atomic number of the atomic nuclei. The scattering angle can be reconstructed by the incoming and outgoing tracks than respect to the inspected object.
Comparing the inspection techniques exploiting x-rays, γ-rays or other particle sources (neutron, ions) to muon tomography, the last presents some advantages.
Firstly, the scan is not invasive. Not only the technique does not require opening the container, but also the cargo content is not damaged because muons are Minimum Ionizing Particles (MIP).
Secondly, the acquisition time (3D image) is reduced to a few minutes, in contrast with the time required by x-ray radiography (about 60 s per a 2D slice, using the CT method).
Lastly, muon radiation is a natural source so that it is not required to introduce an external source that could be dangerous for the environment and for the operators.
This thesis concludes with Chapter 4 reporting the accurate descriptions of the PORTAL architecture, the characterization of each individual component, the experimental tests and the construction phase.
The detector includes 8-position sensitive planes, 6 m long and 3 m wide, large enough for the inspection of standard containers (244 × 259 × 610 cm3). Each plane is made of strips of plastic scintillators coupled with a very sensitive photon detector, the Silicon Photomultiplier (SiPM) described in Chapter 1. Detector components were chosen after the evaluation of appropriated test and simulation results. For the reconstruction of tomographic images, tracking algorithms and suitable imaging software were specifically developed.
The research program for the Muon Portal Project includes the development of simulation procedures, the choice of detector elements to be used, the characterization of the photosensors used for the detection apparatus, the read-out electronics, data acquisition software performing also control and visualization. A preliminary study consisting of a considerable amount of theoretical analysis, supported by GEANT4 simulations has been conducted. Simulation results demonstrate the possibility of reaching detection times of few minutes. They also shown that information provided by the scintillating detector after muon interrogation permits to identify and localize illicit high-Z material, even in the presence of shields designed to mask its existence.
As mentioned before, PORTAL is the result of a training program in the design, construction and test phases started with the OFFSET tracker. In Chapter 4, similarities between OFFSET and PORTAL are emphasized:
• Both detectors are highly segmented, with sensitive areas consisting of scintillating materials: Saint Gobain Sci-Fis for PORTAL and extruded plastic scintillator strips for OFFSET;
• The reduction channels strategy is applied to both described detectors, but in different ways: in the first case an optical reduction technique is used by properly grouping the fibers, while in PORTAL the reduction is applied to the analog signals;
• Both detectors have modular front-end and acquisition electronics, scalable and available as complete products in the specific market. In addition the electronics is programmable by LabVIEW software and the data read-out is real-time (average particle rate is lower than acquisition rate).
Even if the generic idea on their operating functionality is common, properly specifications fit with the required performances. For example, it is preferred to use SiPMs for the Muon Portal detector than PMTs as photosensors due to the huge amount of read-out channels (9600 channels without applying reduction). Indeed SiPMs have smaller sizes and don’t require high voltage supplies.
Since the Muon Portal detector is a double tracker, the Muon Portal could be considered an OFFSET3-like double tracker.
In the concluding section, the improvements of this kind of detectors are summarized, demonstrating their possible effectiveness use in the two research fields mentioned.
Chapter 1
SCINTILLATING PARTICLE TRACKERS
1.1 Particle trackers
1.1.1 Detection principle
Particle detectors can be classified in relation to the physical magnitudes that they are able to measure such as the determination of the impact position, the measurement of the total energy, the arrival frequency of the particles, the identification of the mass, and so on, apart from the geometrical characteristics, materials, applied technology and so on.
Indeed, the detector is often a set of various nature detectors concatenated together so as to give the information you need to characterize the physical event [1].
A tracker detector consists of at least two position detectors placed at a certain distance between them. From the impact position in each detection plane it is possible to reconstruct the track of the particle that has crossed them. In some cases each tracking logical level is made of two physical planes, one for each spatial coordinate X or Y. By using appropriate algorithms, the 3D track can be reconstruct thanks to an off-line or a real-time software analysis.
The detection principle regarding all particle detectors is the transfer to the sensitive volume of the device of all or part of the energy of a particle that passes through the sensitive area of the detector, so that it is converted, directly or indirectly, into an electrical signal [2].
Charged particles lose energy through electromagnetic collisions with electrons or atomic nuclei that compose a solid material, causing its excitation or ionization. The created charges could be detected. E.g. gas detectors are able to directly detect charged particles by gas ionization and generate an electrical signal proportionally to the delivered energy.
Neutral particles must first undergo an intermediate reaction, which allow the formation of charges that can, then, energize or ionize the atoms of the material that characterizes the detector itself (indirect detection).
In the case of indirect detection, for example in the scintillators, the excitation and ionization of the atoms of the detector contribute to induce molecular electronic transitions whose effect is the emission of light: the latter is subsequently converted into an electrical signal via electronics devices such as photodiodes and photomultiplier tubes.
In modern detectors, in most cases, the signal generated by a particle, in a certain point on the path of revelation, is converted into an electrical signal and is then
and computers are getting faster and accurate processing of information. This does not imply that there are only detectors of this type even though often the choice falls on the latter for the reasons set out above.
1.1.2 Detection characteristics
Some characteristics must be considered to define the quality of the measurements performed with any radiation detector, i.e. spatial resolution, time
resolution, energy resolution, detection efficiency and dead time.
The discernible details detected are dependent on the spatial resolution of the sensor and refer to the size of the smallest possible feature that can be detected. In other words, it is the minimum distance at which it is possible to distinguish two close signals.
For a homogeneous feature to be detected, its size generally has to be equal to or larger than the size of the smallest element. In the case of imaging detectors, the sensing images are composed of a matrix of picture elements, or pixels, which are the smallest units of an image. Image pixels are usually squared and represent a certain area on an image. It is important to distinguish between pixel size and spatial resolution: they are not interchangeable. If a sensor has a spatial resolution of 20 meters and an image from that sensor is displayed at full resolution, each pixel represents an area of 20x20 m2 on the ground. In this case the pixel size and resolution are the same.
Time resolution is the criterion for the quality of a time measurement. In general,
the standard deviation is used to describe the resolution, i.e. the root of the variance. It plays a role in fast triggering, particularly for Time Of Flight (TOF) measurements. The time resolution can be influenced by the material, the size and the surface of the scintillation counter, the properties of the light guide, the fluctuation in gain and the spread in transit time of the light detector, and the threshold of the discriminator. In the case of large scintillation counters, a “mean-timer” circuit averaging over the arriving time of the light signals at either end of the scintillator can correct for the delay due to the distance the light has to travel in the scintillator. Typically the time resolution in TOF measurements varies from 0.1 to 1 ns for high-quality scintillators. For drift chambers, spatial resolution and time resolution are closely related in a drift chamber [3]. The term resolution is used in a double sense: it describes the effective resolution achieved on measuring points on an isolated track, and the resolution of two points from two nearby tracks.
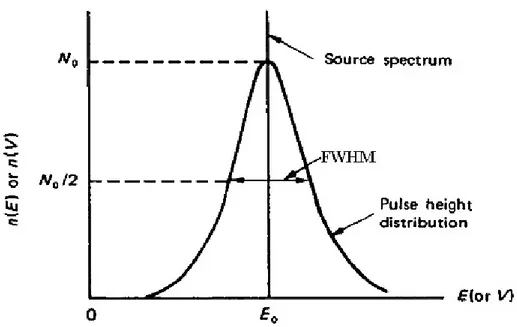
Let us examine the response of the detector to a mono-energetic source of radiation. In the same conditions, different detectors might produce different pulse height distributions, called the response function of the detector for the energy used in the determination.
Figure 1.1 shows, for an initial particle energy, the distribution is centred around a common average value ε0, but the standard deviation () of the curves is different in
relation with the performances: a minor regards a better energetic resolution detector. The differential pulse height distribution for a hypothetical detector is shown under the same assumption that only radiation for a single energy is being recorded.
Figure 1.1 ‐ Energy resolution of a detector in response to a mono‐energetic particle.
The Full Width at Half Maximum (FWHM) is defined as the width of the distribution at a level that is just half the maximum ordinate of the peak. This definition assumes that any background or continuum on which the peak can be superimposed is negligible or has been subtracted away. The energy resolution of the detector R is conventionally defined by the FWHM divided by the location of the peak centroid ε0, so
it is a dimensionless fraction, conventionally expressed as a percentage. Scintillation detectors used in gamma-ray spectroscopy normally show an energy resolution R in the range of 5-10%.
An estimate of the amount of inherent fluctuation can be made by assuming that the formation of each carried charge is a Poisson process. Under this assumption, if a total number N of carried charges is generated on the average, one would expect a standard deviation of √ to characterize the inherent statistic fluctuations in that number. If this were the only source of fluctuation in the signal, the response function should have a Gaussian shape, because N is typically a large number. The width parameter sigma determines the FWHM = 2.35. The response of many detectors is approximately linear, so that the average pulse amplitude is ε0 = KN, where K is a
proportionality constant. The FWHM is than 2.35K√ . We then would calculate a limiting resolution R due only to statistical fluctuations in the number of charge carriers as:
Considering the variation of the observed statistical fluctuations in the number of charge carriers from pure Poisson statistics we can introduce the Fano factor defined as:
(1.2)
Because the variance is given by 2, the equivalent expression to the previous equation is:
R .
/ (1.3)
It is convenient to distinguish between absolute and intrinsic efficiencies. Absolute efficiency Eabs is defined as the number of recorded pulses divided by the
number of radiation quanta emitted by source. It depends on the detector properties and also on the detector geometry (also by its distance from the source). The intrinsic efficiency Eint is defined as the number of pulses recorded divided by the number of
quanta radiation incident on the detector.
The two efficiencies are simply related for isotropic sources by Eint = Eabs (4π/Ω),
where Ω is the solid angle of the detector seen from the actual source position.
In all detectors systems there is a minimum amount of time that must separate two events in order that they could be recorded as two separate pulses. This minimum time separation is usually called the dead time of the counting system. The limiting time is due to processes in the detector itself, and in other cases in the associated electronics. Two models of dead time behaviour of counting system have come into common usage:
paralyzable and non-paralyzable response. The two models predict the same first-order
losses and differ only when true event rates are high. They are in some sense two extremes of idealized system behaviour and real counting systems will often display an intermediate behaviour between them.
We adopt the following definitions:
n = true interaction rate m = recorded count rate T = system dead time
Assuming that the counting time is long so that both m and n may be regarded as average rates, we would like to obtain an expression for the true interaction rates as a function of the dead time T.
In the non-paralyzable case, the fraction of all time that the detector is dead is given simply by the product mT. Therefore, the rate at which true events are lost is simply nmT. Since n-m is another expression for the rate of losses:
(1.4) Solving for n, we obtain:
/ 1 (1.5)
In the paralyzed case, dead periods are not always of fixed length, so we cannot apply the same argument. Nevertheless, the rate m is identical to the rate of occurrences of time intervals between true events, which exceed T. The distribution of intervals between random events occurring at an average rate n is:
(1.6)
Where is the probability of observing an interval whose length lies within dT about T. The probability of intervals larger than T can be obtained by integrating this distribution between T and ∞:
(1.7)
The rate of occurrence of such intervals is that obtained by simply multiplying the above expression by the true rate n:
(1.8)
1.2 Large-area highly segmented detectors
1.2.1 Applications
In the previous section particle trackers have been discussed in general together with their characteristics. Apart from their properties, they can be distinguished for their sizes and for their spatial resolution, which is connected to the pixel/strip size in case of segmented detectors. Now a particular category of particle trackers interesting for our applications will be discussed: large-area highly segmented detectors.
The applications for large sensitive area detectors with a high segmentation are multiple. First of all, they could be applied in the field of medical physics for the detection of crossing charged particles. In fact, more and more frequently there are requests for large-area detectors, capable of real-time tracking the charged particles passing through them in order to perform:
Radiography and tomography of human tissues; Monitoring and imaging of a clinical beam;
Positioning of a patient before a hadronteraphic treatment.
Radiography is an imaging technique that uses electromagnetic radiation, especially X radiation to inspect and visualize the internal structure of a non-uniformly composed and opaque object (i.e. a non-transparent object of varying density and composition) such as the human body. To create the image, a heterogeneous beam of x-rays is produced by an x-ray generator and is projected toward the object. In correlation with the density and composition a certain amount of x-ray is absorbed by the crossed object. Usually, x-rays that pass through the object are captured behind the object by a detector. For a more accurate resolution measurement, it has better to placing a detector plane also before the object to be studied in order to track each crossing particle before and after the collision with the object. Then, the detectors can provide a superimposed 2D representation of the object's internal structures.
In tomography, the x-ray source and detector move to blur out structures not in the focal plane. Conventional tomography is rarely used now having been replaced by
Computed Tomography (CT). Unlike plain-film tomography, CT scanning generates 3D
representations used for computer-assisted reconstruction.
Another possible application is the detection of cosmic radiation, for making of radiography or tomography of an object to be inspected (for example, as will be shown in Chapter 3, to inspect the content of containers transported by ships goods) or area to control as in the case of volcanic tomography. These detectors could also observe the
atmospheric shower [4], by measuring coincident events between several detectors of
the same type placed at a certain distance each other.
Moreover, a big application field of these kinds of detectors is the research in
nuclear and particle physics. Indeed the reaction products from beams collision, or from
a single particle source can be studied.
1.2.2 Specifications for high spatial and angular resolutions
After a panoramic of the possible applications for large-area, highly segmented detectors, some important specifications for the evaluation of the detector performances are discussed.
Position accuracy refers to the precision with which an object can be localized in a space. For all the applications discussed in the previous section, good spatial and angular resolution optimize the ability to reconstruct faithfully the object under examination. For a segmented detector, in one direction it could be calculated as the pixel size divided by square root of twelve. As a result, a small strip size will correspond to a better image quality, e.g. the required spatial resolutions are less than 0.5 mm in case of human body radiography.
The angular resolution of a 3D detector (consisting of more layers placed at a certain distance) could be geometrically calculated from the spatial resolution, considering the distances between the tracker planes. Many other aspects have also to be considered for these calculations, such as the dead areas of the detector, so it has better to performing accurate simulations in order to have a more realistic idea of the detector response. For instance, in case of the detector that will be described in Chapter 3, as a result of a simple geometrical calculation the angular resolution is equal to 0.3 degree, but by the simulations this value seems to be bigger, with an addition of 0.2 degree.
Let us discuss about the detection efficiency for a segmented detector.
In many cases, it could be calculated as for a composite detector (a detector that is realised by the union of several independent detectors).
The detection efficiency of a composite detector is higher than the efficiency of a single crystal detector with the same volume. Indeed, the overall efficiency of a composite detector is a sum of two different primary factors:
The direct detection efficiency is given by the photo-peak efficiencies of each crystal considered as a single detector. It is measured by recording, separately, the full radiation absorption in each of the individual crystals. For the case of a detector made of n crystals the direct efficiency is given by:
∑ , (1.9)
The coincidence detection efficiency, also called the add-back efficiency , is measured by summing the energy deposited in the composite detector on an event by event basis. The total energy is then recovered by summing the partial energy deposited in the individual crystals.
Hence, the total detection efficiency can be written as:
, 1.10
The approximation in eq. 1.10 is valid in the case that n crystals have all the same efficiency. The gain in efficiency obtained by adding coincidence signals together is given by the add-back factor A:
1 / (1.11)
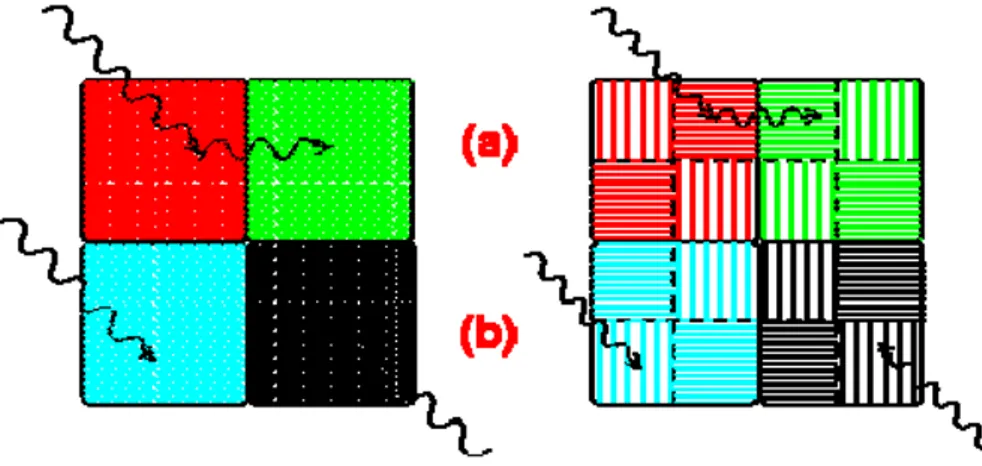
However, it must be considered that coincidence events can also be due to multiple hits, i.e. two particles hitting the detector simultaneously. If energies of multiple hits are added together into the spectrum, they would contribute to the background signal. An additional advantage is provided by the segmentation of a composite detector like the gamma ray detector shown in Figure 1.2. It enables one to distinguish between multiple hit events and gamma ray Compton scattering between two adjacent crystals [5].
Other advantages due to segmentation are the minimization of dead material budget between scatterer (the detector itself) and analyzer (the read-out electronics is dedicated for each segment). Moreover, the sum signal is detected at a common electrode of segments, so that the resolution is improved as only the noise of one electronics channel contributes.
Figure 1.2 ‐ A segmented detector enables one to distinguish between secondary scattering particles (a) and multiple hit events (b) in two adjacent crystals.
1.2.3 Smart read-out strategies to give up real-time performances
Considering the total number of read-out channels of highly segmented trackers with large area, it could be too much large if you had to read all of them individually.In this section, a smart read-out channel reduction strategy is described [6]. It is very useful if applied to these types of detectors in order to give up real-time performances. This architecture reduces the number of read-out channels for a linearly segmented detector.
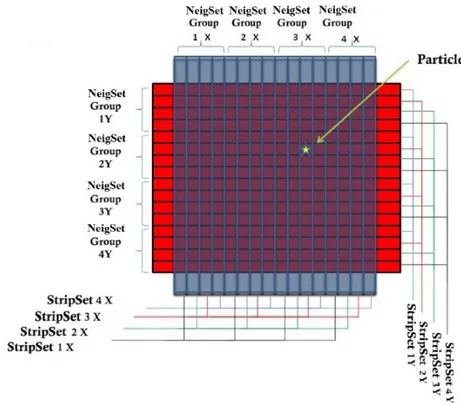
The operating principle of the channel reduction is explained below. We can consider a strip detector. It detects one particle at a time. Each strip is read from both ends and the signals are grouped in a special way, which results in a significant lower number of read-out channels compared to those when each strip is read-out at one end with a dedicated read-out channel. All strips on one end are read-out ingroups of n neighboring strips, named NeigSet, while at the other end the first strips of each group are grouped in StripSet 1, the second strips of each group in StripSet 2, and so on to n (Figure 1.3). This implies that the number of read-out channels on the second side is equal to the number of fibers per channel on the first side. A particle crossing one strip generates a signal at both ends of the fiber. Then we have a signal from the ithNeigSet
group and another from the jthStripSet that univocally identifies the hit strip (Striphit)
according to equation (1).
An X-Y strip detector with 16 strips for each plane is shown in Figure 1.3, as an example of a two-dimensional strip detector where the channel reduction system is applied. In a classical read-out scheme of a two-dimensional strip detector with 16 strips in each dimension, there would be 16 read-out channels for the X direction and 16 for the Y direction, making a total of 32 channels.
Figure 1.3 ‐ Scheme of a segmented X‐Y detector useful to clarify the application of compression channel technique.
The proposed read-out scheme reduces the number of read-out channels to 16. In general the number of read-out channels needed to read-out both dimensions with this scheme is 4 √ , where N is the total number of strips per layer, X or Y. When N is large the reduction factor becomes important, in order to achieve real-time acquisition. An additional advantage of this read-out scheme is that the required read-out of the signal at both ends of a fiber significantly reduces accidental triggers due to noise, crosstalk, dark counts, etc. Notice that to reconstruct the point where the particle crosses the detector (event), we need an energy release in both planes. The characteristics required for each application depends on the particular application desired. For example, in the case of medical applications, the spatial resolution offered by the detectors of the latest generation is less than 0.5 mm. The reduction strategy has been patented by the
1.3 Scintillating trackers as a good compromise for
the selected applications
1.3.1 Introduction
In order to reach the required performances of high spatial/angular resolution, the solution that we have chosen is the employment of scintillating trackers, which are an optimal compromise among the various models of detectors in the specific market. Indeed, the relative reduced cost of plastic scintillators respect to other materials (e.g. Silicon, Germanium or Ceramics) and the possibility to modelling different shapes and sizes is of good advice for large-area detectors and also to obtain the high segmentation. In particular, by using the scintillating fibers it is possible to curve fiber in order to apply the compression channel technique described in the section 1.3.3 at an optical level, by routing the optical fibers in a suitable way. It leads to real-time performances for the read-out. In the following sections the properties of the scintillating materials are described in detail.
1.3.2 Scintillating materials
Scintillators are detectors that emit a light signal when they are hit by a particle. They are usually coupled to a device sensitive to the light emitted giving an electrical signal as a response.
Often, the coupling is made by an unconventional light-guide. It is able to shift the wavelength of the photons to improve their read-out by the photomultiplier and to channel them towards the guide.
Some materials absorb and re-emit the energy in the form of visible light when exposed to ionizing radiation or a particles beam. When this phenomenon, called
luminescence, occurs after a period of 10-8 s it is called phosphorescence or afterglow,
while if it occurs in a lower time interval it is called fluorescence. The fluorescence process is the prompt emission of visible radiation from a substance following its excitation by some means. Phosphorescence corresponds to the emission of longer wavelength light than fluorescence, and with a characteristic time that is generally much slower. Delayed fluorescence results in the same emission spectrum as prompt fluorescence, but again is characterized by a much longer emission time following excitation. To be a good scintillator, a material should convert as large a fraction as possible of the incident radiation energy to prompt fluorescence, while minimizing the generally undesirable contributions for phosphorescence and delay fluorescence.
The scintillators are both organic and inorganic, depending on the used glittering material; the mechanism of light emission is also different. The most widely applied scintillators include the inorganic alkali halide crystals (sodium iodide is the favourite among them) and organic based liquids and plastics.
The inorganic scintillators tend to have the best light output and linearity, but they are generally slow in their response time. Organic scintillators are usually faster but yield less light. The high Z-value of constituents and high density of inorganic crystals favour their choice for gamma-ray spectroscopy, whereas organics are often preferred for beta spectroscopy and fast neutron detection.
The properties of organic scintillators can be summarized as follows:
The emission of light radiation occurs in a very short time, less than 10 ns [2], which makes the organic scintillating detectors the fastest in emission of light;
The bright response is less than the best inorganic scintillators and, therefore, amplifiers are necessary for higher acquisition performances in light emission;
Thanks to their plasticity, several geometric configurations not permitted with the rigid crystal structures of inorganic scintillators can be realized.
In organic scintillators, in general, the luminescence is due to individual molecules [8], typically placed in a solution where the solvent is also consisting of an organic substance in solid or liquid form. In the case of solid, e.g. in the scintillating fibers, a polymer (polystyrene, polyvinyltoluene, PolyMethylMethAcrylate or abbreviated PMMA) or a crystal is usually used.
The molecule responsible for the scintillation (or fluorescence) is called primary fluorine. Typically, the attenuation length of the light emitted from this molecule is very small and the radiation is re-absorbed by the same primary fluorine after a few centimeters. For this reason it is often inserted into a scintillating second molecule, called secondary fluorine. This second element has the task of absorbing the light emitted by the primary fluorine and re-emit at a longer wavelength, in such a way as to ensure the transmission until end of the scintillator.
Both phosphorescence and fluorescence follow an exponential law. Therefore, since both of them are present in the mechanism of scintillation, the simplest way to describe the signal of the scintillator is the following:
/ / (1.13)
where is the number of photons emitted at time t, while tf and ts are the
decay constants of the fast and the slow component, respectively. The constants A and B vary for different materials, however, the fast component is the dominant one, as shown in Figure 1.4.
Figure 1.4 ‐ Representation of the exponential emission trend of the emission light by a photomultiplier into its two components, the fast and slow and their sum.
A good scintillator must meet some basic requirements such as high efficiency and a small decay constant, it must also issue a wavelength that is compatible with the photomultipliers used and must be as transparent as possible to the radiation it emits.
1.3.3 Plastic scintillators
Plastic scintillators are a special type of organic scintillators. They can be produced dissolving a solvent in an organic scintillator so that it can be subsequently polymerized. Usually fluorspar, which acts as a wavelength shifter, is added to expand the attenuation length of the photons.
In this case the mechanism of scintillation is due to the excitation and the subsequent return to the ground state of the valence electrons of the free molecules, located in the orbital molecular π.
The scintillation process remains one of the most useful methods available for the detection and spectroscopy of a wide assortment of radiations [2]. A good scintillation material should be a good compromise among the following properties:
It should convert the kinetic energy of charged particles into detectable light with a high scintillation efficiency;
This conversion should be linear. The light yield should be proportional to deposited energy over as wide a range as possible;
The medium should be transparent to the wavelength of its own emission for good light collection;
The decay time of the induced luminescence should be short so that fast signal pulses can be generated;
The material should be of good optical quality and subject to manufacture in sizes large enough to be of interest as a practical detector;
The index of refraction should be near that of glass (about 1.5) to permit efficient coupling of the scintillation light to a photomultiplier tube or other light sensors.
A better understanding of the mechanism of scintillation is explained in Figure 1.5, where the energy levels of the singlet and triplet of a molecule were separated.
Figure 1.5 ‐ Energy levels within a molecule of a plastic scintillator.
S0 indicates the ground state, while S*, S**, etc. are the singlet excited states; T0
is the first level of the triplet and T*, T**, etc. are its excited levels; the energy is of a few eV. The thin lines indicate a split in the vibrational levels, involving a jump of a few tenths of eV from the ground state.
When an electron in the single state is excited, it decays in a very short time (<10 ps) into the state S* without the emission of radiation, then decay into one of the vibrational states of S0 in a few ns with emission of light, typically in the range of UV.
Transparency to its radiation was due to the decay in a vibrational state: in this way the emitted photons do not have sufficient energy to excite the other scintillator molecules (known as quenching effect). As you can guess from the typical times, this phenomenon explains the fast component of the emitted light.
The delayed component is explained instead by the decay of the triplet state. To reach the state T0, decays occur without emission of light and the direct decay from this
state to S0 is strongly prohibited by the selection rules.
∗ 2 (1.14)
from which the state S* repeats the pattern described above. The typical time depends on the interactions of states T0 and will be generally delayed with respect the
fast component.
Other characteristics of a scintillator are the linearity compared to the energy deposited and the rapid time response.
As regards the first point it is necessary to emphasize that the scintillators give a linear response to energy storage only as a first approximation, for a more complete treatment is necessary to use the Birks formula:
∙ ∙ / ∙ ∙ / (1.15)
where dE/dx is the energy deposited per unit length and dL/dx is the response in light per unit length.
The linear approximation is obtained for large dE/dx where dL/dx ≈ A/kB.
Integrating on the distance travelled by the particle in the scintillator, it results:
∙ / (1.16)
In these conditions, if the photomultiplier has a linear response, the electrical output signal will be proportional to the energy deposited by the particle.
The scintillators are very fast tools with small dead times. The first feature allows their use in detectors that require a very good temporal resolution, such as systems to measure the TOF, while the second makes them suitable for experiments, which involve high counting rates.
Plastic scintillator generally emits UV radiation characterized by a short attenuation length: despite the considerations made above, in fact, one cannot overlook the phenomenon of self-absorption caused by the superposition of the absorption band with that issue; the difference between the wavelengths of the emission peak and the absorption peak is called Stokes' shift. In order to have a good scintillator, a large
Stokes' shift is required. Fluorite is added to move wavelengths towards a region with
greater attenuation length, in such a way the efficiency of the scintillator is increased. In fact, fluorite absorbs the light emitted from the scintillator and re-emits light in the blue region [9].
Plastics have become an extremely useful form of organic scintillator because of its ease to be shaped (as roads, cylinders or flat sheets as shown in Figure 1.6) and realized. Moreover, they are relative inexpensive, so that plastics are often employed as large-volume solid detectors. In this case the self-absorption of the scintillator light may no longer be negligible and some attention should be given to the attenuation properties
2
Acoustic phonons are quanta of radiation; the distribution of elastic vibrations due to thermal excitation of a solid can be determined by applying the duality particle-wave the acoustic radiation. The concept is similar to that of photon seen as the electromagnetic radiation.
of the material. The distance in which the light intensity will be attenuated by a factor 2 can be as much as several meters.
Figure 1.6 ‐ Plastic scintillators of different shapes, colours and sizes.
1.3.4 Scintillating fibers
Scintillating fibers are optical fibers doped with molecules of sparkling substances. They consist of a transparent inner part, said core, covered by another transparent material, labelled cladding.
In the most common scintillating fibers, the core is made of polystyrene doped with organic molecules, usually benzene, while the exterior cladding is made of PMMA. In some fibers, then, a further outer coating is also present, called Extra Mural Absorber (EMA), which acts as protective sheath and limits the effects of cross talk between adjacent fibers.
The two interior materials are coaxial and have different refractive indexes (polystyrene n = 1.60, PMMA n = 1.49). The clad has a refractive index lower than the core to allow the transport of light inside the fibers and prevent loss along the walls. Finally, some types of fibers are equipped with an additional cladding layer, said multi-cladding, with refractive index lower than the first multi-cladding, the function of which is to increase the efficiency of light transport in the fiber itself [10]. A scheme for cross-section of Kuraray fibers is shown in Figure 1.7 [11].
Figure 1.7 ‐ Scheme for cross‐section of Kuraray fibers.
The light emitted from the primary fluorine remains inside the fibers due to total reflection on the surface of separation between the inner core and cladding outside. Whereas isotropic emission of light, the limit angle θC for which you has total reflection
is obtained from Snell's law and is:
Θ / (1.16)
in which ncore and nclad are the refractive index of the core and of the clad,
respectively.
Figure 1.8 ‐ Scintillating fiber longitudinal section. Reflection principle on which is based the transport of the light signal into the fibers is shown. The emission angle is and the limit angle is θC [12].
nclad ncore
If the angle of emission (α = π/2-θC in Figure 1.8) is smaller than the limit angle,
the transmission of light along the fiber occurs [12]. Therefore, the fraction of light that reaches one end of the fiber depends on the solid angle defined by the emission angle α. In the limiting case of α = θC the portion of light transmitted is given by:
1 / /2 (1.17)
However, equation 1.17 is valid if it is only considered light emission along the fiber axis, otherwise it depends on the distance with respect to the fiber axis; typical values range from a minimum of 3.4% near the axis up to a maximum of 7 % in the proximity of the cladding.
1.4 Conversion of the light signal into an electrical
signal
1.4.1 Photo-sensors
If the number of photons arriving at the ends of the fibers is small, it is necessary to apply a suitable system capable of generating a signal large enough to be read. The devices usually used for this purpose are photomultipliers (PMT). PMT are able to convert a light signal into an electrical signal.
In today's scenario there are different types of photomultipliers; they differ for the principles of operation, construction and size, and then each of them have characteristics that guide the selection on the basis of detection to be made.
As an example in this work, two types of photomultiplier are used: the position
sensitive PhotoMultiplier (psPM) and arrays of Silicon PhotoMultipliers (SiPM).
A psPM is a matrix of common photomultipliers. For this reason, a simple photomultiplier and its functional principal is summarily described in the following.
A photomultiplier tube consists of a photocathode, made of a material photosensitive that, in general, is an alkali metal, followed by a system of focusing and collection of electrons, a system of multiplication of electrons constituted by dynodes and, also, from an anode from which the signal can be extract, all contained in a glass tube under vacuum.
When photons (coming for example from the scintillator) affect the photocathode, electrons are emitted because of the photoelectric effect. These photoelectrons, accelerated by an applied potential difference, are pushed towards the first dynode where they transfer their energy to the electrons of the material and cause the light emission. They are, thus, the products of secondary electrons, which in turn are pushed on the next dynode creating further electron emission. This process is repeated for the following dynodes, thus creating a "cascade" of electrons, until reaching the
analysed through a proper electronics chain. At the end of the multiplication a current signal proportional to the number of photons incident on the PMT is created.
Figure 1.9 ‐ Scheme of the function principle of a photomultiplier.
This process is possible only by increasing the voltage between successive dynodes.
Figure 1.9 shows the scheme of the internal structure of a common photomultiplier and its operation principle, highlighting the following main parts:
The photocathode, which converts the light photons into electrons (photoelectrons), by means of photoemission;
Focusing electrodes, which collect and push photoelectrons on the first dynode by a suitable electric field;
A system of dynodes or electrodes that multiply the charge through the emission of secondary electrons;
The anode, which collects the electrons flow after the process of charge multiplication and provides the output signal.
As discussed before, each photomultiplier has some features that diversify it from the others and it can be chosen on the basis of these characteristics. Certainly, a photomultiplier is not able to detect photons at any wavelengths. According to the material of which the photocathode is made, it has different filtering windows and therefore it is necessary to choose a suitable PMT for the wavelength you want to reveal. In the choice of a PMT, hence, the primary consideration must be the evaluation of the response to the wavelength of the incident radiation. It must be verified, i.e., the good agreement between the 3quantum efficiency curve of the photocathode as a function of
3
Quantum efficiency is the ratio of the number of carriers collected by the solar cell to the number of photons of a given energy incident on the solar cell. The quantum efficiency may be given either as a function of wavelength or as energy. If all photons of a certain wavelength are absorbed and the resulting minority carriers are collected, then the quantum efficiency at that
the wavelength of the incident radiation and the emission spectrum of the source you want to reveal, in order to maximize the number of photoelectrons generated by the photons that strike the emitting material.
Either way, more than 50 types of light emitting materials are in use, with spectral responses ranging from infrared to ultraviolet. In Table 1 there is a brief list of the most common types of photocathodes with their spectral response peak and quantum efficiency peak.
Photocathode material Chemical composition Wavelength peak [nm] Quantum efficiency peak S1 (C) Ag-O-Cs 800 0.36 S4 SbCs 400 16 S11 (A) SbCs 440 17 Super A SbCs 440 22 S13 (U) SbCS 440 17 S20 (T) SbNa- KCs 420 20 S20R SbNa- KCs 550 8 TU SbNa- KCs 420 20 Bialkali SbRb-Cs 420 26 Bialkali D SbNa-KCs 400 26 Bialkali DU SbNa-KCs 400 26 BU Cs-Te 235 10 Table 1 ‐ Spectral response and quantum efficiency peak of some common photocathodes.
A SiPM consists of a planar array of single-photon avalanche photodiodes or SPAD (Single Photon Avalanche Detector), operating in the Geiger regime, and whose anodes are connected in common.
In literature SPAD is indicated as a device capable of providing in output current signals directly amplified in response to a single photoelectron product [13].
A SPAD does not differ from other devices such as photodiodes, what changes is the operating system.
While the term APD indicates an avalanche photodiode operating in linear regime with fixed voltage at its ends, a SPAD is an array of photodiodes and it has in addition a particular circuit, called quenching circuit. The coupling with the quenching allows the photodiode to operate in a condition of digital on-off with a single photoelectron, the so-called Geiger Mode.
Each SPAD is essentially made of a p-n junction with high dopant concentration to work in avalanche regime.
We define Overvoltage (hereafter named VOV or OV) as the difference between
the voltage bias applied and the breakdown voltage derived from a I-V measurement. The photodiode is reverse biased at a voltage Va, higher than the nominal value of breakdown BV, with an Overvoltage value that, in general, is chosen between 10% and 30% of BV. With the use of the quenching circuit, the diode is maintained in a state of quiescence forced to the value of voltage Va. Hence, this circuit has the task to stop the process of avalanche, lowering the value of supply voltage below BV, following the production of the avalanche, with its consequent shutdown.
When a photon is absorbed by the photodiode, the photo-generated electron-hole pair is separated and carriers move to the areas of majority for them due to the electrical field generated in the space charge zone. In this area the carriers, said "primary", are rapidly accelerated by a high electric field triggering quickly an avalanche of charge carriers. A voltage greater than the BV gives rise to a gain which depending on the specific case arrives up to 106 carriers. The junction capacitance at this point will discharge towards outside, producing a macroscopic current and, by the contrast the voltage on the diode is lowered instantly to the value of breakdown, switching off the current in the diode.
After a certain time interval, the circuit moves the quenching voltage to the nominal value Va, so that the photodiode is ready to reveal another photon.
Figure 1.10 shows the I-V current-voltage characteristic of a photodiode. While the voltage moves from Vc to Va, the current IA assumes a value several orders higher
than IC. These configurations describe the off-on condition of a photodiode operating in
Geiger Mode.
The transition B→C represents the step of quenching or avalanche off, while the intermediate step between points C and A is said "hold off", in which in the voltage value is not sufficient to produce a carriers avalanche and the final transition A→B, the step of hold on, restores the voltage on the diode to the value Va; at this point the SPAD is ready to reveal another photon. This operating condition is obtained with the circuits labelled quenching. The output current from an APD is of the order of few nA and a duration pulse is of the order of hundreds ps. The output signal is closely linked temporally at the arrival of the photon that starts the avalanche in the sensitive zone due to such a prompt response. The Geiger Mode does not allow the avalanche count of the incident photons simultaneously in the APD and, also, until the quenching circuit does not restore the operating voltage of the device, it is insensitive to further incident photons. The need to create arrays of APD allows to count simultaneously more incident photons.
The switching times of the current and voltage are influenced both from some parameters of the photodiode and from the quenching circuit, such as the junction capacitance and the internal resistance. Figure 1.11 shows a circuit diagram of an SiPM where APDs with related quenching circuits constitute the SPAD and that are also called cells or pixels in the SiPM.
Figure 1.11 ‐ Scheme of a SiPM circuit, seen as a matrix of SPAD [12].
Each SPAD has a quenching resistance RL connected in series that lowers the
value of reverse voltage when the diode is crossed by the impulse current related to the avalanche and decouples SPAD between them. Rc is a common load resistance. If all
the cells are identical and each emits the same amount of charge when a photon is absorbed, by measuring the total charge output, it can be traced back to the number of hit cells and, consequently, to the number of incident photons. From here, the necessity to realize matrices of APD is evident to allow to count more incident photons simultaneously.
![Figure 1.11 ‐ Scheme of a SiPM circuit, seen as a matrix of SPAD [12].](https://thumb-eu.123doks.com/thumbv2/123dokorg/4522226.34953/34.892.204.680.591.867/figure-scheme-of-sipm-circuit-seen-matrix-spad.webp)