Accuracy in the experimental calorimetric study of the
crystallization kinetics and predictive transformation
diagrams: Application to a Ga–Te amorphous alloy
N. Clavaguera
Grup de F´ısica de l’Estat S`olid, Departament d’Estructura i Constituents de la Mat`eria, Facultat de F´ısica, Universitat de Barcelona, Diagonal 647, 08028-Barcelona, Spain
M. T. Clavaguera-Mora and M. Fontanaa)
Grup de F´ısica de Materials I, Departament de F´ısica, Edifici C, Universitat Aut`onoma de Barcelona, 08193-Bellaterra, Spain
(Received 25 March 1996; accepted 12 May 1997)
The uncertainties inherent to experimental differential scanning calorimetric data are evaluated. A new procedure is developed to perform the kinetic analysis of continuous heating calorimetric data when the heat capacity of the sample changes during the crystallization. The accuracy of isothermal calorimetric data is analyzed in terms of the peak-to-peak noise of the calorimetric signal and base line drift typical of differential scanning calorimetry equipment. Their influence in the evaluation of the kinetic parameter is discussed. An empirical construction of the time-temperature and temperature-heating rate transformation diagrams, grounded on the kinetic parameters, is presented. The method is applied to the kinetic study of the primary crystallization of Te in an amorphous alloy of nominal composition Ga20Te80, obtained by rapid solidification.
I. INTRODUCTION
Kinetics of phase transformation studies include several experimental techniques; in particular, optical or electron microscopy, x-ray or neutron diffraction, electri-cal resistivity, magnetic susceptibility, M¨ossbauer spec-troscopy, thermal analysis, and dilatometry are currently used. One of the thermal analysis methods, specifically differential scanning calorimetry (DSC), is of particular interest in first order phase transformations. It provides the rate of transformation as a function of time or temperature by measuring the heat released or absorbed during the phase change. Isothermal and continuous heating (or cooling) measurements are readily made, although care must be taken to account for heat capacity changes of the sample during the transformation and the peak-to-peak noise and base line drift in the calorimetric signal. The use of DSC data to evaluate kinetic param-eters of solid state reaction is well established (see, for instance, Borchardt and Daniels,1 Freeman and Carroll,2 Coats & Redfern,3 and Hugo et al.4).
The goal of kinetic studies is to determine the kinetic parameters which allow extrapolation of the transforma-tion rate, Ùx, to broader temperature ranges than those accessible by DSC measurement. An important tool in this respect is the use of time-temperature-transformation
a)Permanent address: Departamento de F´ısica, Facultad de Ingenieria, Universidad de Buenos Aires, Paseo Col`on 850 (1063), Buenos Aires, Argentina.
diagrams. These T-T-T curves are constructed from the explicit dependence of the crystallized fraction, x, on an-nealing temperature and anan-nealing time. Such diagrams plot a series of temperature versus time curves for a fixed value of x. Such curves are determined based on crystallization measurements from a series of isothermal measurements. By a different procedure, Temperature-Heating (Cooling) Rate-Transformation or T-HR-T (T-CR-T) curves are constructed as the temperature versus heating (cooling) rate for a fixed value of x.5–9
In this paper, the accuracy in the determination of the kinetic parameters for the primary crystallization of an amorphous sample is discussed with reference to Ga20Te80 alloys, obtained by rapid solidification. The investigation by means of DSC and x-ray diffraction (XRD) allowed characterization of two main crystalliza-tion processes. They correspond, respectively, to primary crystallization of Te and secondary crystallization of the high temperature Ga2Te5 phase.10,11 The analysis of the nucleation-growth mechanisms of these processes is still under study.
The experimental details on the calorimetric meas-urement of the crystallization kinetics are presented in Sec. II. The evaluation of the transformation rate from the experimental data under continuous heating regime is presented in Sec. III. There, a new procedure was developed to perform the kinetic analysis when the heat capacity of the sample changes during the crystallization. The limits in the accuracy in the values obtained for Ùx from isothermal DSC data, coming from the
peak-to-peak noise (often quite substantial with respect to the total calorimetric signal) and from the base line drift were analyzed in Sec. IV. Several procedures exist to evaluate the kinetic parameters from DSC data.1–4,12,13 Some of them are used in the present study and the kinetic parameters deduced, with their corresponding errors, are presented in Sec. V. Finally, in Sec. VI a revision of the previously reported empirical method5,7 to construct the low-temperature part of both the T-T-T5 and the T-HR-T7 diagrams is presented. The revision is grounded in the need to account for the uncertainties in the crystallization kinetic parameters and data processing when studying complex crystallization behaviors. II. EXPERIMENTAL PROCEDURE
Master alloys of Ga – Te with 20 at. % Ga were prepared by melting mixtures of elemental high qual-ity (5 N) gallium and tellurium at 600±C, in graphite crucibles under an Ar atmosphere. Samples were rapidly quenched under Ar atmosphere to the amorphous state using the piston and anvil technique.14,15 Disk-shaped samples with an average thickness of 30 mm and about 1 cm in diameter were studied. The amorphous character of the rapidly quenched samples was verified from the analysis of their XRD patterns using monochromatized Cu (Ka) radiation. Their thermal evolution on heating
was studied in a Perkin-Elmer DSC-7 differential scan-ning calorimeter under a dynamic Ar atmosphere.16 Continuous heating experiments were performed at scan rates, b, ranging between 5 and 80 K ? min21, whereas isothermal experiments were carried out at temperatures, T, of 457, 460, and 463 K. The temperature plateau was attained by heating the amorphous samples from room temperature to the annealing temperature at a rate of 80 K ? min21.
III. EXPERIMENTAL CALORIMETRIC RESULTS UNDER CONTINUOUS HEATING
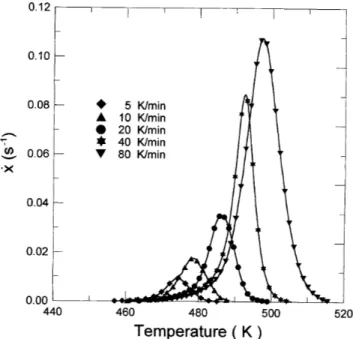
A. Thermal evolution of the amorphous alloy Figure 1 shows the DSC curves obtained for the dif-ferent heating rates used, ranging from 5 to 80 K ? min21.
Three transformations are occurring sequentially with increasing the temperature. The glass transition appears as an endothermic shift in the DSC base line, due to the change of heat capacity in the sample transforming from the amorphous to the undercooled liquid state. Two exothermic transformations follow: the primary crystallization of Te and the secondary crystallization of Ga2Te5.10,11 Here, the terms primary and secondary crystallization are used following Ref. 17, since the transforming phase is an undercooled liquid. After the first crystallization process, the base line remains close to the extrapolated base line of the amorphous state, shown as a dashed line in the upper graph of Fig. 1.
FIG. 1. Apparent heat capacity change obtained on heating the amor-phous alloy at different heating rates.
This indicates that there is a significant change of the heat capacity of the sample during its first exothermic transformation. Procedures already exit in the literature to take account of this effect in the overall kinetic anal-ysis of the data. They require estimation of the fraction x transformed from the DSC trace which includes the heat capacity change contribution.18 A new procedure is proposed in which the value of x is re-estimated repetitively, by an iterative method, based ultimately on integration of DSC data purged from the change in sample heat capacity contribution.
B. Kinetics of crystallization: Influence ofDDDCp
The experimental data on the kinetics of crystal-lization allow determination of the evolution of the transformed fraction, x, either as a function of tempera-ture, T (under continuous heating or cooling regime), or annealing time, t (under an isothermal regime). Such information is generally obtained from scanning calori-metric experiments by assuming that the instantaneous heat flow evolved from the sample during the transfor-mation, ÙQ, is proportional to the transformation rate, Ùx.
That is,
Ù
Q ø Ùx ? DH , (1) where DH is the total enthalpy of transformation.
The above expression (1) implicitly assumes a neg-ligible contribution of the change in both (i) composition and (ii) heat capacity of the transforming phase. A more accurate expression of the heat evolved per unit time is18
Ù
Q ÙQreaction alone 1 ÙQDCp, (2) where ÙQreaction alone is the rate of enthalpy change of
the reaction alone and ÙQDCp is the rate of sample heat capacity change from that of the undercooled liquid to that of the crystallization product. This treatment considers that the concept of additive heat flow —as measured by power-compensated DSC —is reasonable.19 In eutectic- and polymorphic-type isothermal trans-formations, the compositions of both the emerging crys-talline and the remaining nontransformed phase do not change during the transformation (see appendix). Thus,
Ù
Qreaction alone Ùx ? DH , (3) Ù
QDCp x ? b ? DCp, (4) where DCp is the total change in heat capacity of the
sample in the transformation. Even when the instanta-neous composition of the crystalline nuclei or of the undercooled liquid change during the transformation, as in primary crystallization, Eqs. (3) and (4) are used, as a good approximation (see appendix). Obviously, Eqs. (2) to (4) reduce to Eq. (1) under isothermal regime (b 0) or even under continuous heating in the particular case where DCp is so small that the second term in Eq. (2)
is negligible.
Under continuous heating at a rate b, the value of DCp is directly obtained from the shift of the base
line of the DSC curve, between the exotherm onset and the exotherm end (see Fig. 3). Let us consider that the exotherm onset occurs at the temperature Ton(the highest temperature before the transformation for which x 0 and Ùx 0). Similarly, the exotherm end occurs at Tend and then Ùx becomes zero again with x 1. One has to obtain the actual value of DH, and, for each temperature T, in the range Ton > T > Tend, the actual values of
x and Ùx. They come from the experimental knowledge of ÙQ, and the values of b and DCp. The procedure
presented here is an iterative method where the fraction transformed is re-estimated at every step of the iteration process and purged sequentially from the heat capacity change contribution term.
The iteration procedure starts with instantaneous values of x, named x0, calculated assuming for ÙQDCp a linear shape between the onset and the end of the transformation exotherm. An example of the way used
FIG. 2. Diagram of a DSC curve including a crystallization peak and a heat capacity change, indicating the subtended area and the evaluation of x0 for a particular temperature.
to obtain the x0values is shown in Fig. 2. For increasing
values of the iteration step, i . 0, the values of DHi,
Ùxi and xi are re-estimated, by use of the following
equations: DHi 1 b Z Tend Ton s ÙQ 2 xi21? b ? DCpd dT , (5) Ùxi s ÙQ 2 xi21bDCpdyDHi, (6) xi 1 b Z T Ton ÙxidT . (7)
Equation (5) gives the estimated value of the crystalliza-tion enthalpy. Equacrystalliza-tion (6) gives the ratio (Ùxi) between
the estimated heat flow due to the reaction alone and the enthalpy of crystallization. Equation (7) evaluates the instantaneous value of the fraction transformed, xi, by
integration of Ùxi.
The outlined procedure creates data sets whose prox-imity to the actual data sets is performed by selecting a value e for which the iteration stops at a step k when
jDHk 2 DHk21j < e ? DHk. (8)
This means that the added enthalpy at step k is negligible.
The results obtained by the above procedure are illustrated in Fig. 3 that shows the original DSC experi-mental results for the first crystallization exotherm of the 20 K ? min21 curve (thick line), split into ÙQreaction alone
and ÙQDCp (thin lines). In the present application the selected value was e 1 3 1024 and iteration stopped when k 8. The approximate heat capacity term ob-tained with a single iteration is also shown in this figure, as a dashed line. Its shape is very close to the one obtained after several iterations and may be compared to the result of the method already described in Ref. 18. IV. EXPERIMENTAL CALORIMETRIC RESULTS UNDER AN ISOTHERMAL REGIME: EVALUATION OF EXPERIMENTAL ERRORS
As very sensitive DSC equipment have become available, they are widely used as a tool to study the kinetics of transformations. Nevertheless, there are limits to the accuracy in the determination of the rate of reaction, the most important of which in crystallization studies is the uncertainty of the base line position.16 We have already pointed out the importance of the role of the variation of the heat capacity inherent to the change of the sample from the disordered to the crystalline
FIG. 3. Partition of the overall DSC curve (thick lines) in one part,
Qreaction alone, proportional to the rate of reaction,Ùx, and the other part,
QDCp, proportional to the crystallized fraction, x. Approximate heat capacity term (dashed line) with a single iteration.
state. Other sources of error come from instrumentally based base line instability during the experiment, and the uncertainty associated with the determination of the exact positions of the onset, and the end of a transformation exotherm (or any other thermal event) in the DSC trace. Both effects are especially important under isothermal conditions and we will treat them together, since they may occur simultaneously.
The following illustration is for the crystallization exotherm obtained at 457 K (see Fig. 4) under the following assumptions:
Base line instability
610 mW rms peak-to-peak noise
610 mW base line drift in 30 min isothermal measuring
time
Uncertainty in time
620 s for the onset and end time.
The calculated values of the relative errors in both the reaction rate, jDÙxjy Ùx, and the transformed fraction,
jDxjyx, are plotted, respectively, in Figs. 5 and 6 as
a function of x. As expected, the relative error on the reaction rate, Fig. 5, is quite high at the onset and end of the exotherm but it remains lower than 4% in most of the plotted range. With regard to the crystallized fraction, Fig. 6 illustrates how the relative error decreases toward a value of about 4% as the transformation proceeds. However, in the early stages of transformation it exceeds 10%. The curve presented in Fig. 5 is not symmetric with respect to the value x 0.5 because of the shape of the
FIG. 5. Relative error in the rate of crystallization, 6jDÙxy Ùxj (shown with bars), versus the crystallized fraction.
isothermal transformation exotherm used to analyze the errors. That means that, in general, the relative errors will vary with the form of the exotherm. However, the results presented here are good estimates of the expected uncertainty in kinetic analysis by DSC. One has to have in mind this fact in the analysis of the data. For instance, in the so-called Avrami method20,21 to obtain kinetic exponents one calculates the value of lnf2 lns1 2 xdg versus lnstd. Then for the time at which one considers that x < 0.05 one has jDxjyx > 6 0.1 and, consequently one may expect jD lnf2 lns1 2 xdgj > 6 0.2.
V. DETERMINATION OF THE KINETIC
PARAMETERS: APPARENT ACTIVATION ENERGY AND PRE-EXPONENTIAL FACTOR
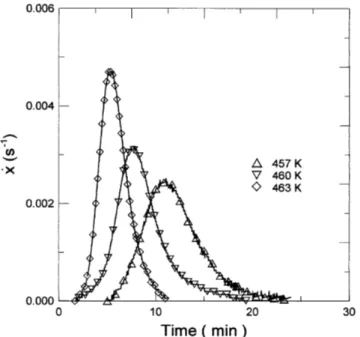
Figures 7 and 8 show, respectively the kinetic data obtained for the first crystallization process under con-tinuous heating Ùx Ùx (T, b) and isothermal Ùx Ùx (t, T ) regimes. We will assume that the rate of reaction,
Ùx, may be written as
Ùx KsTd ? fsxd , (9) where the function fsxd reflects the mechanisms driving the crystallization and the rate constant follows the Arrhenius law, that is
KsTd K0exps2EykTd , (10)
with K0 the pre-exponential factor and E the apparent
activation energy of the rate constant KsTd.
Our goal is the evaluation of E, K0, and fsxd from
the results plotted in Figs. 7 and 8. The value of E is
FIG. 6. Relative error in the crystallized fraction, 6jDxyxj (shown with bars), versus x.
FIG. 7. Rate of crystallization versus temperature obtained on heating the amorphous alloy at scan rates in between 5 and 80 K ? min21.
often deduced by the so-called “exotherm peak” methods which consider the condition fulfilled at the maximum rate of reaction. In continuous heating regime the most used21 are the Kissinger12 and Ozawa13 methods and in an isothermal regime the time at maximum reaction rate method.22 These methods provide the value of E without any need to evaluate Ùx and x. The values obtained from the Kissinger and time at maximum
FIG. 8. Rate of crystallization versus time obtained under isothermal annealing at several temperatures.
reaction rate methods are quoted in Table I, whereas the corresponding plots are shown in Fig. 9.
Equations (9) and (10) may be rewritten in the form
Ùx hK0? fsxdj exps2EykTd . (11)
In the so-called the multiple scans method,21 the si-multaneous evaluation of E and K0 fsxd is performed
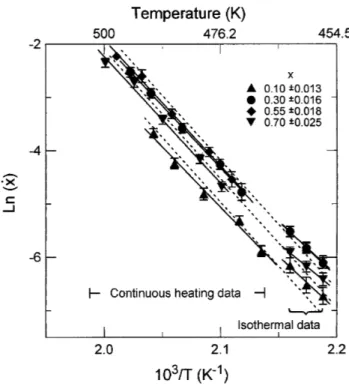
from the Arrhenius plot of Eq. (11) at fixed values of x, either from continuous heating or from isothermal data. Figure 10 shows the multiple scan analysis performed for several values of x. Full lines correspond to the least squares fitting of each particular set of data (isothermal or continuous heating) for the x values stated in the legend. Both the activation energy (slope of the thick lines) and the K0fsxd values (y-intercept, in exponential
form) obtained from the Arrhenius plot shown in Fig. 10, are quoted in Table I.
In the multiple scan method, any inaccuracy in the value obtained for E, jDEj, rebounds on the error in evaluating ln hK0 fsxdj, jD ln hK0 fsxdjj. Assuming T
and x were free of error, it results in:
jD lnhK0fsxdjj jDEjykT . (12)
For example, different values for E are quoted in Table I in the multiple scans method, for a fixed value of x 0.55, namely E 1.54 eV (from isothermal data) and E 2.05 eV (from continuous heating data). Taking a mean value of 103yT ø 2.1 K21, and considering jDEj 60.26 eV, Eq. (9) gives jD ln K0? fsxdj ø 67,
i.e., about three orders of magnitude uncertainty in the evaluation of K0? fsxd. Consequently, different values
for K0? fsxd may be obtained from quite similar values
of the apparent activation energy. The more accurate values of the transformation rate are often obtained for its maximum value, i.e., close to the exotherm maximum. This is one of the major reasons for which methods, such as Kissinger or isothermal time at maximum rate methods, give quite good estimates of E.
The uncertainty in the values of Ùx and T is included by symbols with error bars in Fig. 10. They also limit the accuracy in the determination of E and K0? fsxd.
Even if there is a large scatter, the values reported in Table I suggest that in the limited temperature interval scanned experimentally (460–500 K) the kinetics of crystallization may be considered to agree with the assumption of a constant activation energy. Therefore, it is assumed in the following that a unique set of empirical kinetic parameters reproduces the experimental data for both isothermal and continuous heating regimes in the primary crystallization of Te analyzed. This set is reported in Table I and drawn (dashed lines) in Fig. 10. TABLE I. Crystallization parameters evaluated by DSC.
Kissinger method Isothermal time data
E (eV) 2.08 6 0.2 2.13 6 0.2
Multiple scans method
Isothermal data x 0.1 0.3 0.55 0.7
E (eV) 1.75 6 0.2 1.73 6 0.2 1.54 6 0.2 1.82 6 0.2
K0fsxd s1017sd 0.22 6 0.1 0.25 6 0.08 0.002 6 0.001 2.3 6 0.8
Continuous heating data x 0.1 0.3 0.55 0.7
E (eV) 1.95 6 0.2 2.04 6 0.2 2.05 6 0.2 2.06 6 0.2
K0fsxd s1019sd 0.26 6 0.1 5.1 6 2 4.7 6 1 2.2 6 1
Selected set of kinetic parameters
Crystallized fraction x 0.1 0.3 0.55 0.7
FIG. 9. Plot of both Ln(byT2) — with bT2in units of K21min21—
T being the peak temperature obtained under continuous heating at scan rates in the range 5 – 80 K ? min21and Ln(t) — t being the peak
time (in s) — obtained under isothermal annealing versus inverse of temperature.
VI. EMPIRICAL CONSTRUCTION OF THE T-T-T AND T-HR-T DIAGRAMS
As recently derived,5–9 the transformation diagrams that describe nonequilibrium crystallization under isothermal or continuous heating regimes, namely the T-T-T (Time-Temperature-Transformation) and T-HR-T (Temperature-Heating Rate-Transformation) diagrams, may be empirically constructed, at least in a limited temperature range, by assuming a specific form of the rate of reaction. The low temperature part of these curves is obtained from the hypothesis of an apparent activation energy.
The empirical construction of the T-T-T and T-HR-T diagrams is grounded on the recognition that Eq. (11) gives, in differential form, either the function x xstd at a given T or the function x xsTd at a given
b, when applied to isothermal and continuous change
of temperature regimes, respectively.5,7 Namely, under isothermal conditions (at temperature T ), the integrated form of Eq. (11) is gsxdyK0 t exps2EykTd , (13) where gsxd is defined as gsxdyK0 ; Z x 0 dx K0fsxd . (14)
Equation (13) can be written the form x xsTd, t. This equation, when represented as the temperature versus time needed to crystallize a fixed fraction x of the
FIG. 10. Plot of Ln(Ùx)—with Ùx in units of s21— versus inverse of temperature for a fixed value of the crystallized fraction. Full lines correspond to the least square fitting of each particular set for a fixed value of x while the dashed line is drawn for the mean value of the activation energy.
material gives a particular T-T-T curve in the T-T-T diagram.
By a similar procedure, integration of Eq. (11) under a constant scan rate b gives
gsxdyK0 1 b Z T 0 exps2EykTd dt , (15) with the same definition, Eq. (14), of gsxdyK0. Here, the
integration may be carried out within the limits given by the duration of the process, namely from Ton (x 0) to T (0 , x , 1). In other words, the contribution of the integration between 0 , T , Ton is negligible. The extent of crystallization is a function only of temperature and scan rate, i.e., x xsT, bd. Assuming a fixed value of x, the plot of the temperature against the heating rate produces a specific T-HR-T curve in the T-HR-T diagram.
The main difficulty in the above presentation is the evaluation of gsxdyK0 by Eq. (13). The instantaneous
value of the product K0 fsxd is evaluated from the
ex-perimental Ùx data by introducing the apparent activation energy, in Eq. (11), rewritten in the form
K0fsxd Ùx ? expsEykTd . (16)
As already mentioned, the integration may be carried out within the limits given by the duration of the process, namely from x Ùx 0 (Ton) to x (T ). However, any
uncertainty in the values of Ùx at the exotherm onset may produce an integrand that diverges when T ! Ton (since both Ùx and K0 fsxd ! 0).
Since both the T-T-T and T-HR-T transformation diagrams plot a limited series of n curves, each one for a fixed value of the transformed fraction, xa (with
a 1, . . . ,n), their empirical construction may be per-formed without the use of Eq. (13) to obtain gsxadyK0.
The proposed methodology for getting the T-HR-T dia-gram is the following one. For a series of fixed values of the transformed fraction, xa (a 1, . . . ,n), let us
consider the temperatures, Tao, at which xa is attained
when scanning at a particular value of the heating rate,
bo. Let us name ba any other value of the heating rate
for which the same value of the transformed fraction, xa, will be attained at a temperature Ta. For any of the
couples (Ta, ba) the following relationship is satisfied:
gsxadyK0 1 bo Z Tao 0 exps2EykTd dt 1 ba Z Ta 0 exps2EykTd dT . (17) This equation allows us to obtain T Tsbd for x xa,
that is a T-HR-T curve, by the simple evaluation of the integral of exps2EykTd.
Very similarly, from a previous knowledge of gsxadyK0 deduced from continuous heating data by
Eq. (17), the time duration, ta, needed to achieve a
transformed fraction xa, at a temperature Ta, satisfies
the equation
gsxadyK0 taexps2EykTad . (18)
These data may be plotted in the form T Tstd for x xa as one of the T-T-T curves in the T-T-T diagram.
The low temperature part of the T-T-T and T-HR-T curves is constructed with the above-mentioned proce-dure using the selected value of the apparent activation energy quoted in Table I, and the continuous heating data at bo 20 K ? min21. The respective T-T-T and T-HR-T
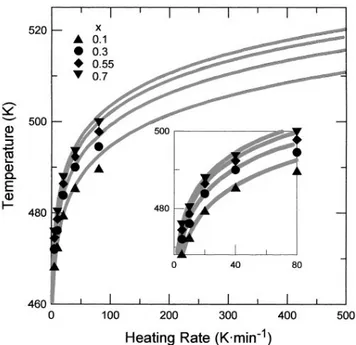
transformation diagrams are shown in Figs. 11 and 12. Full lines correspond to computed values and experi-mental points to the values obtained at heating rates of 5, 10, 20, 40, and 80 K ? min21(for the T-HR-T diagram)
and temperatures of 457, 460, and 463 K (for the T-T-T diagram). That is, the computed T-HR-T curves fit the experimental points when bo 20 K ? min21, as clearly
shown in the inset of Fig. 12. However, in general, the agreement between experimental and computed values for different heating rates is quite good in the T-HR-T curves, and most significantly, when comparing both the T-T-T and the T-HR-T diagrams, regardless of the fact that the calculated T-T-T curves were obtained from continuous heating data. The agreement in temperature lies between 65 K in the experimentally measured range
FIG. 11. T-T-T diagram of primary crystallization of Te from the amorphous Ga20Te80alloy. Experimental points: (m) x 0.1; (
≤
) x 0.3; (r) x 0.55; and (.) x 0.7. Continuous curves: calculated values.but the predicted values are expected to have larger error bars when extended in regions not covered by experiment because the description in terms of activation energy is rather simplified with respect to reality. VII. CONCLUSIONS
A new procedure has been developed to obtain accurate data for the rate of phase transformation from continuous heating DSC measurements by subtraction of the heat capacity change contribution to the total calorimetric signal.
The effect of both base line instability and uncer-tainty on the exact position of the onset and end of the transformation exotherm in the isothermal data obtained by current DSC equipment on the determination of the rate of crystallization has been evaluated.
The link between the error in the evaluation of both the apparent activation energy and the pre-exponential factor of the rate constant from calorimetric data has been discussed. Very similar values for the apparent activation energy are shown to be expected, independently of the particular method used to process the experimental data.
The construction of predictive transformation diagrams, T-T-T and T-HR-T, which may extend the transformation temperatures to ranges wider than those measured experimentally by DSC by use of empirical crystallization kinetic parameters is discussed.
The overall procedure has been applied to study the crystallization kinetics of an amorphous alloy, Ga20Te80,
FIG. 12. T-HR-T diagram of primary crystallization of Te from the amorphous Ga20Te80alloy. Experimental points: (m) x 0.1; (
≤
) x 0.3; (r) x 0.55; and (.) x 0.7. Continuous curves: calculated values.for which the primary crystallization of hexagonal Te is accompanied by a significant heat capacity change of the sample. The kinetic parameters obtained from the primary crystallization study have been transformed and are presented in the form of the low temperature part of both the T-T-T and the T-HR-T transformation diagrams. ACKNOWLEDGMENTS
This work has been supported by CIRIT (project no. 1995SGR-00514) and CICYT (project nos. MAT96-0692 and MAT96-0769) which are acknowledged. One of the authors (M. Fontana) gratefully acknowledges the grant released by the Instituto de Cooperaci´on Iberoamericana of Spain. Thanks are also due to Dr. B. Arcondo and Professor H. Sirkin for the prepara-tion of the amorphous alloys and to Dr. J. Zhu for her help in calorimetric measurements.
REFERENCES
1. H. J. Borchardt and F. Daniels, J. Am. Chem. Soc. 79, 41 (1957). 2. E. S. Freeman and B. Carroll, J. Phys. Chem. 62, 394 (1958). 3. A. W. Coats and J. P. Redfern, Nature 201, 64 (1964).
4. P. Hugo, S. Wagner, and T. Gnewikiw Thermochim. Acta 225, 143 (1993).
5. M. T. Clavaguera-Mora, M. D. Bar´o, S. Suri˜nach, and N. Clava-guera, J. Mater. Res. 5, 1201 (1990).
6. S. Suri˜nach, M. D. Bar´o, J. A. Diego, N. Clavaguera, and M. T. Clavaguera-Mora, Acta Metall. Mater. 40, 37 (1992).
7. M. T. Clavaguera-Mora, S. Suri˜nach, M. D. Bar`o, and N. Clava-guera, J. Phys. D: Appl. Phys. 25, 803 (1992).
8. N. Clavaguera, J. Non-Cryst. Solids, 162, 40 (1993).
9. N. Clavaguera and M. T. Clavaguera-Mora, Mater. Sci. Eng. A179yyy180, 288 (1994).
10. C. S. Oh and D. N. Lee, Calphad 16, 317 (1992).
11. D. Mouani, G. Morgant, and B. Legendre, J. Alloys Comp. 226, 222 (1995).
12. H. E. Kissinger, Anal. Chem. 29, 1702 (1957). 13. T. Ozawa, Bull. Chem. Soc. Jpn. 38, 1881 (1965).
14. G. Fontana, H. Sirkin, M. Rosen, D. Kurlat, and E. Frank, Rev. Brasileira de Fisica 9, 1 (1979).
15. M. G. Fontana and B. Arcondo, J. Mater. Sci. 30, 734 (1995). 16. M. Fontana, Master Thesis, Universitat Aut´onoma de Barcelona,
1995.
17. U. K¨oster and U. Herold, in Glassy Metals I, edited by H. J. G¨untherodt and H. Beck, Topics Appl. Phys. (Springer, Berlin, 1981), Vol. 46, p. 225.
18. R. F. Speyer, Thermal Analysis of Materials, (Marcel Dekker, 1994).
19. R. F. Speyer, J. Mater. Res. 8, 675 (1993).
20. J. W. Christian, Theory of Transformations in Metals and Alloys, 2nd ed. (Pergamon, Oxford, 1975).
21. D. W. Henderson, J. Non-Cryst. Solids 30, 301 (1979). 22. H. S. Chen, J. Non-Cryst. Solids 27, 257 (1978).
APPENDIX
The initial stages of the crystallization process can be visualized as the formation of nuclei which, on growing, give rise to a concentration profile ahead of the interface, schematically shown in Fig. A1. Under the hypothesis of attainment of metastable equilibrium at the interface, at this location the concentration of the remaining nontransformed phase stabilizes to the value cp. The respective values of the concentration in the crystal and at the interface are established from the free energy diagram shown in Fig. A2. As crystallization proceeds, the mean composition of the remaining phase evolves from co to cp. Then, the metastable
hetero-geneous equilibrium is reached all over the sample. During the transformation, the volume fraction occupied
FIG. A1. Schematic view of the establishment of a concentration profile in the disordered phase ahead of the interface of a growing grain.
FIG. A2. Free energy curves of the crystalline and disordered solution phases at temperature far below stable equilibrium between them.
by the primary crystals is xf1, where f1 is given by the
lever rule,
f1 scp 2 codyscp 2 cxtd . (A1)
Neglecting differences of density among the various coexisting phases, f1 is also the mass fraction
trans-formed at the end of the crystallization process. The heat flux evolving from the sample is
Ù Q D ÙH , (A2) with DH hx ? f1? Hxtscxt, Td 1 s1 2 x ? f1d ? Hasc, Tdj 2 Hasco, Td , (A3) dhx ? f1? Hxtscxt, Tdj dt Ùx ? f1? Hxt 1 x ? f1? Cp,xt? b , (A4) dhs1 2 x ? f1d ? Haj dt 2 Ùx ? f1? Ha 1s1 2 x ? f1d ? ∑ ≠Ha ≠c ?Ùc 1 Cp,a? b ∏ , (A5) and dhHasco, Tdj dt Cp,asco, Td ? b . (A6) In these equations Hw and DCp,w stand for the enthalpy
and heat capacity per unit mass, respectively, of phase
w with w xt for the primary crystals and w a for
the undercooled liquid. Further, it has been assumed that the composition of the crystal, cxt, remains constant all
over the transformation.
Provided that (i) (≠Hay≠c) ? Ùc is negligible and
(ii) Hascd ø Ha(cp)ø Hascod and Cp,ascd ø Cp,ascpd ø
Cp,ascod in the range co < c < cp the heat flux evolved
from the sample may be divided in two terms, namely, the rate of enthalpy change of the reaction alone,
Ù
Qreaction alone Ùx ? f1?sHa 2 Hxtd , (A7)
and the rate of sample heat capacity change from that of the undercooled liquid to that of the crystallization product,
Ù
QDCp x ? f1?sHa 2 Hxtd . (A8) In polymorphic and eutectic crystallization, Eqs. (A7) and (A8) with f1 1 are exact, since the composition
of the coexisting phases remains constant during the transformation. In primary crystallization, they are good approximate expressions of the mean instantaneous heat flux generated in the reaction.