Microwave Radiometric Measurements
of Hydrological Parameters in Mountain Areas
S. Paloscia, G. Macelloni, P. Pampaloni, E. Santi
CNR-IFAC, Via Panciatichi 64 – 50127 Firenze (Italy) E-mail: [email protected]
R. Ranzi, S. Barontini
Dept. of Civil Engineering, University of Brescia (Italy)
Abstract—In this paper, an experiment aimed at investigating
the water balance after soil thawing and the radiation budget is described. The experiment was carried out by combining microwave remote sensing measurements with ground and micrometeorological data. The higher frequencies were found to be very sensitive to the characteristics of snow, whereas the lower ones were much more influenced by the soil conditions. The sensitivity to soil moisture was well demonstrated at L-band, although the soil was covered by a thick layer of grass, and, to a minor extent, also at C- band.
Keywords: Soil moisture measurements, microwave emission, hydrological paramters, mountain areas
INTRODUCTION
Monitoring of the soil and snow parameters in mountain watersheds has significant importance for the management of water resources and for flood forecasting. Moreover, microwave remote sensing data can provide important information in areas where local measurements are not available or when optical remote sensors are hampered by the presence of clouds.
An experiment was carried out on the eastern Italian Alps during the 2002 spring-summer for the purpose of investigating the water balance after soil thawing and the radiation budget, by combining microwave remote sensing measurements with ground and micrometeorological data. The test site was selected for the study because of its relatively smooth topography and the availability of historical data and digital elevation models.
The experiment performed pointed out the potential of multi-sensor measurements in characterizing different states of soil moisture after the snow-melting. As already pointed out in past experiments, the higher frequencies were found to be very sensitive to the characteristics of snow [1, 2], whereas the lower ones were much more influenced by the soil conditions [3-5]. On the other hand, micrometeorological data, such as net radiation, soil temperature and heat flux, provided additional insight into the water cycle, including percolation and heating of the soil [6].
THE EXPERIMENT
The experiment took place on Mount Cherz plateau, which is located at about 2000 m a.s.l in the basin of the Cordevole river from March 20th to June 30th. A set of microwave and infrared radiometers was installed in a special container. The infrared sensor operated at 8-12 µm wavelength band. Multi-frequency radiometric data were collected at C-band (6.8
GHz), Ku (19 GHz), and Ka-band (37 GHz) on snow- covered soils from 20th March 2002 to 20th May 2002, and at L- (1.4 GHz), C- and Ka-bands on bare soil, from May 20 to June 30th 2002. The sensors operated 24 hours/day at an incidence angle of 55o. Angular scans between 30 and 70 degrees were carried out under specific conditions. During the experiment, several parameters of the snow cover and soil were collected on the site, together with the main meteorological parameters.
A meteorological station was installed to measure wind speed and direction, air temperature and relative humidity. Several instruments intended for the study and simulation of physical and radiative properties of the ground were installed in order to measure net radiative flux and ground flux, which are generally estimated indirectly. In addition, a tipping-bucket rain-gauge and TDR probes were installed on the site, in order to provide continuous rain rate and soil moisture values at a depth of 5 cm.
At the beginning of the experiment, the snow cover on the test site was about 35 cm deep and lasted until May 10th. After May 10th, the experiment dealt with measurements of soil moisture, water balance and radiation budget. After the snow melting, the soil was covered by a thick layer of grass.
IFAC-CNR of Florence (Italy) handled the microwave measurements; CVA-Centro Valanghe, Arabba (Italy) contributed to the nivological and meteorological data; and the Dept. of Civil Engineering of the University of Brescia-DCEB (Italy) carried out the micro-meteorological measurements.
This research work was partially supported by the Italian Space Agency (ASI), the ENVISNOW EC Project (EVG1-CT-2001-00052), and the NASDA Project A2ARF003
.
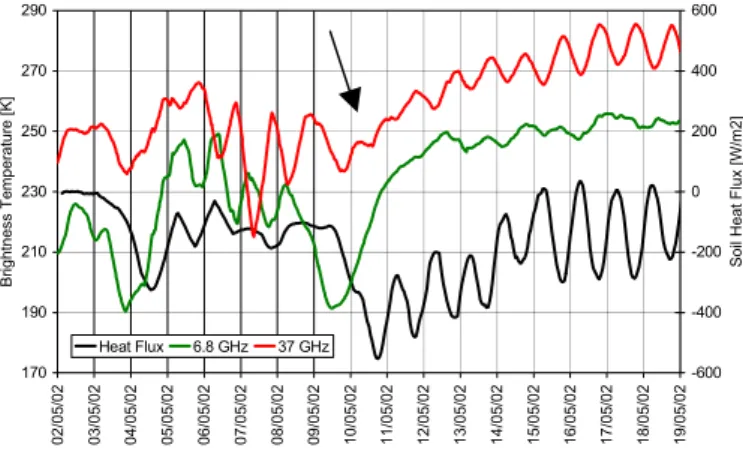
170 190 210 230 250 270 290 02/05/02 03/05/02 04/05/02 05/05/02 06/05/02 07/05/02 08/05/02 09/05/02 10/05/02 11/05/02 12/05/02 13/05/02 14/05/02 15/05/02 16/05/02 17/05/02 18/05/02 19/05/02 Br ightnes s T e mper atur e [K] -600 -400 -200 0 200 400 600 Soi l Heat F lux [W/m2] Heat Flux 6.8 GHz 37 GHz
Figure 1. Temporal trends of Heat flux and Brightness Temperature at 6.8 and 37 GHz alon the period of the snow-melting.
After point indicated by the arrow the soil is completely snow-free.
EXPERIMENTAL RESULTS
The influence of the melting cycle of snow and its disappearance is analyzed in Fig. 1, by comparing the temporal trend of the soil heat flux (W/m2) with that of the microwave brightness temperature (K) at 6.8 and 37 GHz, during the transition period between snow-covered and snow-free soil. Up to May 2nd the soil was covered by snow and was in thermal equilibrium, with a heat flux of 0 W/m². The complete melting of the snow-cover (May 3rd-4th) was characterized by a rapid increase in the ground heat flux, due to unfreezing and heating in the upper soil layer. On May 4th, a snowfalls occurred and the heat flux decreased because a more homogeneous temperature profile was likely to be re-established in the ground and remained almost constant until to May 9th. On May 10th, the snow cover disappeared, and the soil began to warm up definitely. Consequently, vertical temperature gradients built up and ground flux rapidly increased to mean values of up to 400 W/m². Afterwards, a heating front propagated downward into the ground until an equilibrium temperature profile was reached. A corresponding mean ground flux of about 130 W/m² was recorded during the period May 16-18th. Until May 4th, the microwave signal fluctuated greatly, due to frequent precipitations and consequent changes in the observed surface, with an alternation of wet snow and bare soil. In the period from May 6th to May 9th due to the presence of new snow, we noted several snow melting/refreezing cycles, especially at 37 GHz. After the snow melting, microwave and heat flux data were strictly correlated, showing an increasing trend of Tb and a decreasing trend of heat flux until an equilibrium situation was reached. Moreover, the highest frequency (37 GHz) showed the same daily fluctuations of the heat flux, related to the thermal behavior of the very surface soil layer, whereas 6.8 GHz showed a more regular increasing trend.
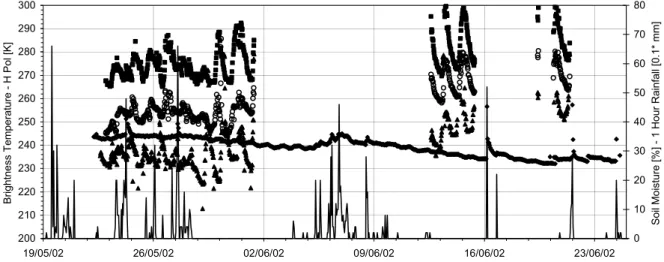
Another example of collected data is shown in Fig. 2, where the temporal trends of the brightness temperatures (Tb) at 1.4, 6.8 and 37 GHz, the Volumetric Soil moisture and 1 Hour Rainfalls are represented for the May 22-June 26, 2002 period. The behavior of the microwave data was well related
to the daily cycle of surface temperature. The variation in the signal was much higher at the highest frequency (37 GHz) than at 6.8 and 1.4 GHz; indeed, at the latter frequencies, penetration was high and the soil contribution was dominant. In the same diagram it can also be noted that, whereas the
200 210 220 230 240 250 260 270 280 290 300 19/05/02 26/05/02 02/06/02 09/06/02 16/06/02 23/06/02 B ri ghtness T e mperature - H P ol [K ] 0 10 20 30 40 50 60 70 80 S oil Moisture [% ] - 1 Hour Rainfall [0.1* mm]
37GHz 6.8 GHz 1.4 GHz Soil Moisture 1 hour rainfall
Figure 2- Brightness Temperatures at 1.4,(triangles) , 6.8 (circles) and 37 (squares) GHz (H polarization, 55 degs of incidence angle) , Volumetric Soil moisture (measured in the first 5 cm layer) and 1 Hour Rainfall as a function of time
200 220 240 260 280 300 24 26 28 30 32 34 36 38 40 Soil Moisture [%] B ri ghtness Tem perature [K ]
Figure 3. Tb at 1.4 GHz as a function of volumetric soil moisture content of the 5cm layer. All values of Tb available during the day were taken
into account in this diagram
0.6 0.7 0.8 0.9 1 24 26 28 30 32 34 36 38 40 Soil Moisture [%] N o tm a liz e d T e m p e ra tu re = T b /T ir
Figure 4 – The Normalized Temperature (Tb/Tir) at 1.4 GHz as a function of the soil moisture content
moisture content of soil slowly decreased with time, the average values of the brightness temperatures increased.
However, although the temporal trends of both the brightness temperature (Tb), mainly at 1.4 GHz, and the soil moisture are apparently related, the strong daily fluctuations of emission made it difficult to directly compare the two parameters. In Fig. 3, Tb at 1.4 GHz shows a rather clear sensitivity to soil moisture in the first 5-cm layer, but the points are highly dispersed. Even the normalization to the infrared temperature (Tir) was not very useful (see Figure 4), since thermal emission comes from the very upper layer of soil and does not take into account the temperature profile in the soil. In order to overcome this problem, a daily measurement of Tb was chosen when the soil temperature profile was constant,
showing a situation of thermal equilibrium, i.e. around 5 to 7 p.m. In this way, the diagrams of Fig. 5 were obtained, where the brightness temperatures at the three frequencies (a. 1.4 GHz, b. 6.8 GHz, and c. 37 GHz) are represented as a function of the volumetric soil moisture values of the first centimeters.
From these diagrams it can be observed that, by choosing the correct value for Tb, the correlation significantly improved. The best correlation with soil moisture is shown at 1.4 GHz, with a rather high correlation coefficient (R2 =0.9). That means that this frequency, which is characterized by a high penetration power and therefore is much influenced by the soil conditions, was not very much affected by the presence of the thick grass cover. The sensitivity of about 3.5 K per % of SMC, which is rather high, is comparable to what was obtained in previous experiments carried out on bare or slightly vegetated soils. As expected, as the frequency increased, the correlation worsened, since the contribution of the vegetation layer became more important. However, a fairly good sensitivity was still found at 6.8 GHz, in the order of about 2 K/% of soil moisture.
CONCLUSIONS
The purpose of the performed experiment was to investigate the water balance after soil thawing, and the radiation budget, by combining microwave remote sensing measurements with ground and micrometeorological data. In particular, microwave radiometry at 37 GHz was closely related to the soil heat flux during the snow melting period, whereas the lower frequencies (1.4 and 6.8 GHz) were found to be very sensitive to the moisture conditions, since at these frequencies penetration is high and the contribution of soil is dominant. The highest sensitivity to the volumetric soil moisture was found at 1.4 GHz, although a fairly good sensitivity was still present at 6.8 GHz, despite the presence of a thick grass cover.
ACKNOWLEDGMENT
The authors wish to thank the personnel of the CVA-Centro Valanghe, Arabba, for their kind assistance in collecting the ground data.
REFERENCES
[1] Schanda E., C. Mätzler and K. Künzi, "Microwave Remote Sensing of Snow Cover", Int. J. Remote Sensing, 4, p. 149-158, 1983
[2] Macelloni G., S. Paloscia, P. Pampaloni, M. Tedesco, “Microwave Emission from Dry Snow: A Comparison of Experimental and Model Result,” IEEE Trans. Geosci. Remote Sensing,vol. 39, n 12, pp. 2649-2656, 2001
[3] Jackson T.J., “Measuring surface soil moisture using passive microwave remote sensing”, Hydrological Processes, n. 7, pp. 139-152, 1993
[4] Njoku E., D. Entekhabi, “Passive microwave remote sensing of soil moisture”, J.Hydrology, n. 184, pp. 101-129, 1996. [5] Paloscia S., P. Pampaloni, L. Chiarantini, P. Coppo, S. Gagliani,
G. Luzi, "Multifrequency passive microwave remote sensing of soil moisture and roughness", International Journal of Remote Sensing, vol. 14, n.3, pp. 467-483, 1992
[6] Ranzi, R. e R. Rosso, “A physically based approach to modelling distributed snowmelt in a small alpine catchment” in: Snow Hydrology and Forests in High Alpine Areas, edited by H. Bergmann, H. Lang, W. Frey, D. Issler & B. Salm, IAHS Publ. no.205, pp.141-150, 1991.
1.4 GHz- H- Pol - Theta = 60 degs
y = -3.4697x + 342.96 R2 = 0.889 200 220 240 260 280 300 24 26 28 30 32 34 36 38 40 SMC (%) B ri ghtness T e m perature (K )
6.8 GHz- H- Pol - Theta = 60 degs
y = -1.9028x + 319.34 R2 = 0.4936 200 220 240 260 280 300 24 26 28 30 32 34 36 38 40 SMC (%) Brightnes s Tem perature (K )
37 GHz- H- Pol - Theta = 60 degs
y = -0.5387x + 295.81 R2 = 0.0731 200 220 240 260 280 300 24 26 28 30 32 34 36 38 40 SMC (%) Brightness Temperature (K )
Figure 5 - Brightness temperatures (Tb) at 1.4, 6.8, and 37 GHz (H polarization, 60 degree incidence angle) as a function of the volumetric soil moisture content (SMC). Daily Tb values were chosen in situation of
thermal equilibrium. Points represent experimental data and lines the regression equations computed for the data sets