ORIGINAL
Comparison of European ICU patients
in 2012 (ICON) versus 2002 (SOAP)
Jean‑Louis Vincent
1*, Jean‑Yves Lefrant
2, Katarzyna Kotfis
3, Rahul Nanchal
4, Ignacio Martin‑Loeches
5,
Xavier Wittebole
6, Samir G. Sakka
7, Peter Pickkers
8, Rui Moreno
9, Yasser Sakr
10, on behalf of the ICON
and SOAP investigators
© 2018 The Author(s). This article is an open access publication
Abstract
Purpose: To evaluate differences in the characteristics and outcomes of intensive care unit (ICU) patients over time. Methods: We reviewed all epidemiological data, including comorbidities, types and severity of organ failure, inter‑
ventions, lengths of stay and outcome, for patients from the Sepsis Occurrence in Acutely ill Patients (SOAP) study, an observational study conducted in European intensive care units in 2002, and the Intensive Care Over Nations (ICON) audit, a survey of intensive care unit patients conducted in 2012.
Results: We compared the 3147 patients from the SOAP study with the 4852 patients from the ICON audit admitted
to intensive care units in the same countries as those in the SOAP study. The ICON patients were older (62.5 ± 17.0 vs. 60.6 ± 17.4 years) and had higher severity scores than the SOAP patients. The proportion of patients with sepsis at any time during the intensive care unit stay was slightly higher in the ICON study (31.9 vs. 29.6%, p = 0.03). In multilevel analysis, the adjusted odds of ICU mortality were significantly lower for ICON patients than for SOAP patients, particu‑ larly in patients with sepsis [OR 0.45 (0.35–0.59), p < 0.001].
Conclusions: Over the 10‑year period between 2002 and 2012, the proportion of patients with sepsis admitted to
European ICUs remained relatively stable, but the severity of disease increased. In multilevel analysis, the odds of ICU mortality were lower in our 2012 cohort compared to our 2002 cohort, particularly in patients with sepsis.
Keywords: Epidemiology, Severity of disease, Sepsis Introduction
Intensive care medicine is a relatively new specialty, but one that has evolved considerably over its short exist-ence. Over the last 15 years or so, improved understand-ing of underlyunderstand-ing disease pathogenesis and the role of “iatrogenic” complications has led to key changes in man-agement and process of care in intensive care unit (ICU) patients, including use of lower tidal volume ventilation,
more restrictive blood transfusion practice, and less sedation, which may have helped reduce mortality rates. Conversely, the aging world population with increased comorbidity, increased use of chemotherapy and immuno-suppression, and medical advances that enable an increas-ing number of chronically ill patients to survive into old age, may favor admission of a sicker cohort of patients to the ICU and thus result in increased mortality rates.
Sepsis remains a leading cause of death worldwide among critically ill patients [1]. Although several recent studies have reported a substantial increase in the number of cases of sepsis per year, with a decrease in mortality of these patients [1, 2], this may largely be a reporting phenomenon associ-ated with more complete capture of less ill patients [3, 4]. *Correspondence: [email protected]
1 Department of Intensive Care, Erasme University Hospital, Unversité
Libre de Bruxelles, Route de Lennik 808, 1070 Brussels, Belgium Full author information is available at the end of the article
To assess the changing epidemiology of ICU patients, and of sepsis in particular, we compared two large multi-national observational studies conducted on ICU patients exactly 10 years apart, the Sepsis Occurrence in Acutely ill Patients (SOAP) study conducted in 2002 [5] and the larger worldwide Intensive Care Over Nations (ICON) audit conducted in 2012 [6]. The data collected for the two studies were almost identical and analysis was con-ducted in the same center, facilitating comparisons and reducing the risk of bias. We hypothesized that patients in the current ICON era would be sicker but have lower mortality rates than patients in the SOAP study.
Methods
The SOAP study was conducted in 24 European countries and included 3147 patients [5]. The ICON audit included 10,069 patients from 82 countries worldwide [6]. For the purposes of this comparison, we considered only the patients from ICON who were admitted to the same 24 European countries as in the SOAP study (e-Table 1, e-Appendix). For both studies, recruitment for partici-pation was by open invitation, through national scien-tific societies, national and international meetings, and individual contacts. Participation was entirely voluntary, with no financial incentive. Institutional review board approval for both studies was obtained by the participat-ing institutions accordparticipat-ing to local ethical regulations.
Participating ICUs (see e-Appendix) were asked to prospectively collect data on all adult patients admitted between May 1 and 15, 2002 for the SOAP study and between May 8 and 18, 2012 for the ICON audit. In both studies, patients who stayed in the ICU for < 24 h for routine postoperative surveillance were not considered. Re-admissions of previously included patients were also not included. Data were collected daily during the ICU stay for a maximum of 28 days. Patients were followed up for outcome data until death, hospital discharge or for 60 days.
Data were collected by the investigators using pre-printed (for SOAP) and electronic (for ICON) case report forms. Data collection on admission included demo-graphic data and comorbid diseases as well as source and reason for admission. Clinical and laboratory data for SAPS II [7] scores were reported as the worst values within 24 h after admission. The presence of microbio-logically confirmed and clinically suspected infections was reported daily as were the antibiotics administered. A daily evaluation of organ function was performed using the sequential organ failure assessment (SOFA) score [8]. Definitions
Sepsis was defined as the presence of infection with the concomitant occurrence of at least one organ failure
(defined as a SOFA score > 2 for the organ in question) in ICON, equivalent to the definition of “severe sepsis” used in SOAP. For the purposes of this comparison, we used this ICON definition of sepsis, recently supported by international consensus [9].
Data management and quality control
Detailed instructions explaining the aim of the study, instructions for data collection, and definitions were available through a secured website for all participants before starting data collection and throughout the study period. Additional queries were answered on a per case basis by the coordinating center during data collection. Data were further reviewed by the coordinating center for plausibility and availability of the outcome parameter, and any doubts were clarified with the center in question. There was no on-site monitoring. Missing data repre-sented < 6% of the data collected for SOAP and 6.1% of the ICON data.
Statistical analysis
All data were processed and analyzed in the Department of Intensive Care of Erasme Hospital, University of Brus-sels, in collaboration with Jena University Hospital, Jena, Germany. Data were analyzed using IBM® SPSS® Statis-tics software, v.24 for Windows (IBM, Somers, NY, USA). Data are summarized using means with standard deviation, medians and interquartile ranges, or numbers and percentages. Difference testing between groups was performed using Student’s t test, Mann–Whitney test, Chi square test or Fisher’s exact test, as appropriate. The Kolmogorov–Smirnov test was used, and histograms and quantile–quantile plots were examined to verify whether there were significant deviations from the normality assumption of continuous variables.
To identify the effect of being in the SOAP or ICON study on ICU mortality, and because of the hierarchical structure of the data, we performed a multivariable anal-ysis using a multilevel binary logistic model with three levels: patient (level 1), admitted to a hospital (level 2), within a country (level 3). The dependent variable was ICU mortality. The explanatory variables considered in
Take-home message
This comparison of two databases created 10 years apart shows that ICU populations in Europe have changed over time. ICU patient are now slightly older and more severely ill. The number of patients with shock has increased as has the use of renal replacement thera‑ pies, whereas the proportion of patients receiving mechanical ven‑ tilation has decreased. ICU length of stay has remained unchanged and ICU mortality rates may have decreased.
the model were age, sex, SAPS II score without age com-ponent, type of admission, source of admission, treat-ment with mechanical ventilation or renal replacetreat-ment therapy (RRT), presence of sepsis, comorbidities and the study to which the patient belonged, i.e., SOAP or ICON.
For parameter testing, the likelihood-ratio test was used. Colinearity between variables was checked by inspection of the correlation between them, looking at the correlation matrix of the estimated parameters. The interaction between explanatory variables was also tested. Three models were constructed: the first model, an unconditional model with no exposure factors, was used to discern the amount of variance that existed between hospital and country levels; the second model (the unadjusted model) contained the study to which the patient belonged, presence of sepsis and their interaction; and the third model (the adjusted model) was extended to include the other patient characteristics. The results of the fixed effects (measures of association) are given as odds ratios (ORs) with their 95% CIs. A second order penalized quasi-likelihood (PQL) estimation method was used, because this method approximates well com-pared to other methods [10]. The statistical significance of covariates was calculated using the Wald test. No sta-tistical adjustments were used for multiple testing. All reported p values are two-sided and a p value of less than 0.05 was considered to indicate statistical significance.
Results
We compared the 3147 patients from the SOAP study with the 4852 patients from the ICON audit who were admitted to ICUs in the same countries as the patients in the SOAP study. The number of centers and number of patients in each country is shown in e-Table 1, the main differences being that a smaller proportion of patients were included from Belgium and France in ICON than in SOAP and a larger proportion from the UK and Spain.
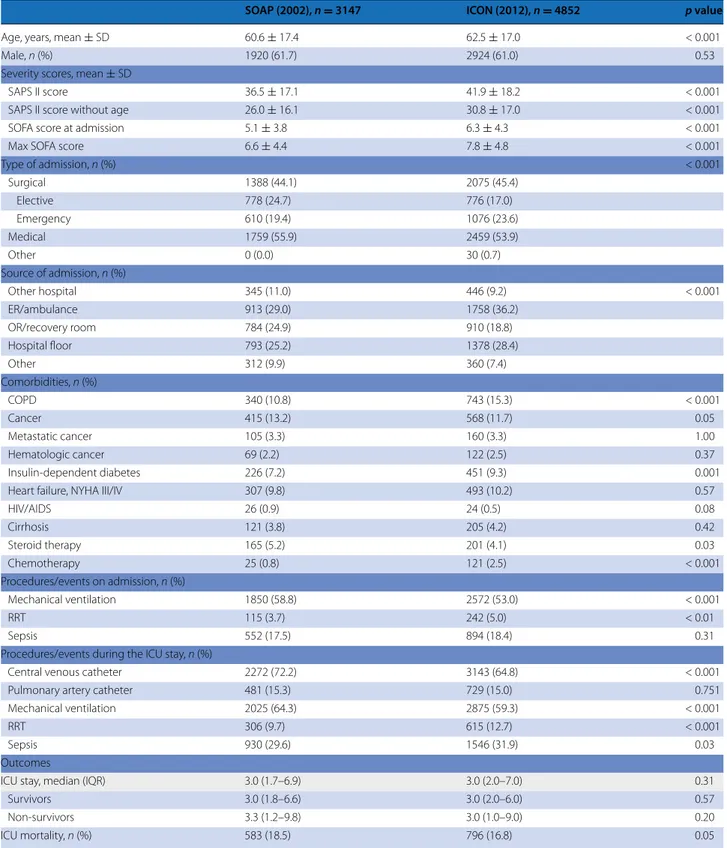
The characteristics of the two patient populations are shown in Tables 1 and 2. ICON patients were older (62.5 ± 17.0 vs. 60.6 ± 17.4 years, p < 0.001) than SOAP patients and more likely to have co-morbid chronic obstructive pulmonary disease (COPD) and insulin-dependent diabetes mellitus. They were more likely to be receiving chemotherapy on admission and less likely to be receiving corticosteroids. ICON patients were more likely to have circulatory shock, respiratory failure and/or liver failure on admission than SOAP patients. They had higher SAPS II scores (41.9 ± 18.2 vs. 36.5 + 17.1) on admission, higher SOFA scores on admission (6.3 ± 4.3 vs. 5.1 ± 3.8) and higher max SOFA scores during the ICU stay (7.8 ± 4.8 vs. 6.6 ± 4.4) than the SOAP patients (all p < 0.001).
ICON patients were less likely to receive invasive mechanical ventilation during their ICU stay (59.3 vs.
64.3%, p < 0.001) but more likely to be treated with renal replacement therapy (RRT; 12.7 vs. 9.7%, p < 0.001). There was a small increase in the proportion of patients with sepsis at any time during the ICU stay between the two studies (29.6% in SOAP vs. 31.9% in ICON, p = 0.03). Gram-negative pathogens were more frequently isolated (66.3 vs. 60.2%, p = 0.01) and fungi less frequently iso-lated (14.8 vs. 20.7%, p < 0.001) in infected ICON patients than in infected SOAP patients (e-Table 2).
The ICU lengths of stay were not significantly differ-ent in the two studies, but the overall ICU mortality rate was slightly lower in ICON than in SOAP (16.8 vs. 18.5%,
p = 0.05). Hospital (24.1% in SOAP vs. 23.9 in ICON, p = 0.83) and 60-day (23.4% in SOAP vs. 23.7 in ICON, p = 0.75) mortality rates were not different between the
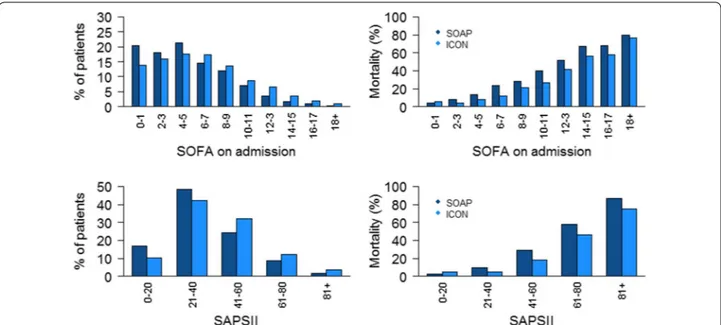
studies. The improvement in ICU survival was particu-larly notable in patients with sepsis, shock or liver failure on admission or during the ICU stay, and those with renal failure during the ICU admission (Table 2). ICU mortality rates were significantly lower in ICON for all degrees of organ failure on admission (Fig. 1) and for all numbers of failing organs during the ICU admission (Table 2). Similar patterns in ICU mortality rates were identified in patients with and without sepsis (e-Tables 3 and 4, e-Figure 1).
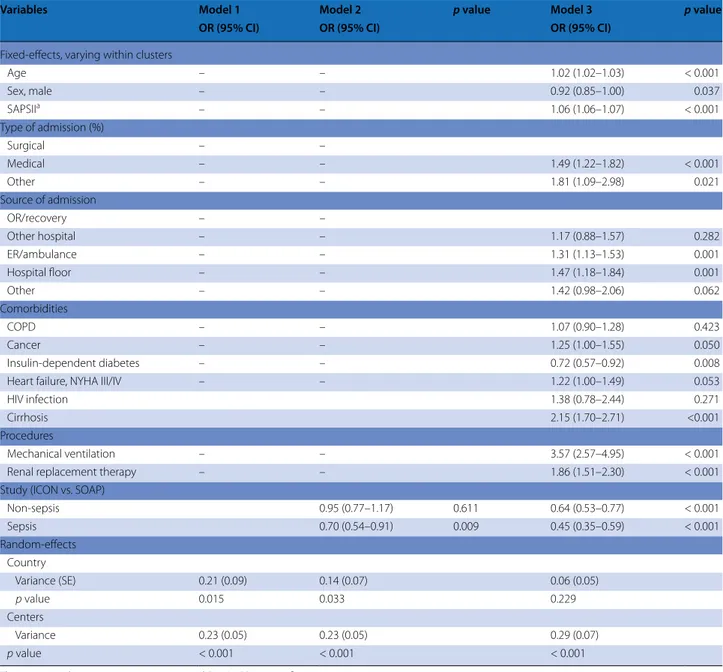
In multilevel analysis, the adjusted odds of ICU mor-tality were significantly lower for ICON patients than for SOAP patients, both with and without sepsis (Table 3). Interestingly, the reduced odds were greater for patients with sepsis than for those without in both non-adjusted (p = 0.016) and adjusted (p = 0.006) analyses. The unconditional model indicated significant between-country (var 0.21, p = 0.015) and between-hospital (var 0.23, p < 0.001) variations in the individual risk of in-ICU death (Table 3). After controlling for patient factors, the differences across hospitals remained statistically sig-nificant (var 0.29, p < 0.0001); in contrast, the differences across countries disappeared after adjustment (var 0.06,
p = 0.23). Discussion
This comparison of two databases created 10 years apart shows some important epidemiological differences in ICU populations in Europe over time. The number of patients with shock has increased as has the use of renal replacement therapies, whereas the proportion of patients receiving mechanical ventilation has decreased. Although ICU patient populations are slightly older and more severely ill, ICU survival rates have improved even after adjustment for multiple potential confounders.
The proportion of patients receiving invasive mechani-cal ventilation decreased over the 10-year period. Indeed, although the proportion of patients with respiratory fail-ure at ICU admission was greater in ICON than in SOAP,
Table 1 Characteristics of the two cohorts of patients
Percentages were calculated after exclusion of missing values
RRT renal replacement therapy, ICU intensive care unit, SAPS simplified acute physiology score, SOFA sequential organ failure assessment, ER emergency room, OR
operating room, COPD chronic obstructive pulmonary disease, HIV human immunodeficiency virus, AIDS acquired immunodeficiency syndrome
SOAP (2002), n = 3147 ICON (2012), n = 4852 p value
Age, years, mean ± SD 60.6 ± 17.4 62.5 ± 17.0 < 0.001
Male, n (%) 1920 (61.7) 2924 (61.0) 0.53
Severity scores, mean ± SD
SAPS II score 36.5 ± 17.1 41.9 ± 18.2 < 0.001
SAPS II score without age 26.0 ± 16.1 30.8 ± 17.0 < 0.001
SOFA score at admission 5.1 ± 3.8 6.3 ± 4.3 < 0.001
Max SOFA score 6.6 ± 4.4 7.8 ± 4.8 < 0.001
Type of admission, n (%) < 0.001 Surgical 1388 (44.1) 2075 (45.4) Elective 778 (24.7) 776 (17.0) Emergency 610 (19.4) 1076 (23.6) Medical 1759 (55.9) 2459 (53.9) Other 0 (0.0) 30 (0.7) Source of admission, n (%) Other hospital 345 (11.0) 446 (9.2) < 0.001 ER/ambulance 913 (29.0) 1758 (36.2) OR/recovery room 784 (24.9) 910 (18.8) Hospital floor 793 (25.2) 1378 (28.4) Other 312 (9.9) 360 (7.4) Comorbidities, n (%) COPD 340 (10.8) 743 (15.3) < 0.001 Cancer 415 (13.2) 568 (11.7) 0.05 Metastatic cancer 105 (3.3) 160 (3.3) 1.00 Hematologic cancer 69 (2.2) 122 (2.5) 0.37 Insulin‑dependent diabetes 226 (7.2) 451 (9.3) 0.001
Heart failure, NYHA III/IV 307 (9.8) 493 (10.2) 0.57
HIV/AIDS 26 (0.9) 24 (0.5) 0.08 Cirrhosis 121 (3.8) 205 (4.2) 0.42 Steroid therapy 165 (5.2) 201 (4.1) 0.03 Chemotherapy 25 (0.8) 121 (2.5) < 0.001 Procedures/events on admission, n (%) Mechanical ventilation 1850 (58.8) 2572 (53.0) < 0.001 RRT 115 (3.7) 242 (5.0) < 0.01 Sepsis 552 (17.5) 894 (18.4) 0.31
Procedures/events during the ICU stay, n (%)
Central venous catheter 2272 (72.2) 3143 (64.8) < 0.001
Pulmonary artery catheter 481 (15.3) 729 (15.0) 0.751
Mechanical ventilation 2025 (64.3) 2875 (59.3) < 0.001
RRT 306 (9.7) 615 (12.7) < 0.001
Sepsis 930 (29.6) 1546 (31.9) 0.03
Outcomes
ICU stay, median (IQR) 3.0 (1.7–6.9) 3.0 (2.0–7.0) 0.31
Survivors 3.0 (1.8–6.6) 3.0 (2.0–6.0) 0.57
Non‑survivors 3.3 (1.2–9.8) 3.0 (1.0–9.0) 0.20
the proportion during the ICU stay was lower. Moreo-ver, we can speculate that more patients with respiratory failure are now managed using non-invasive mechanical ventilation [11] and/or high-flow nasal cannula oxygen [12]. We chose not to record data on non-invasive ven-tilation as it is difficult to evaluate over 24-h periods. It is also possible that mechanical ventilation was more frequently withheld in the ICON cohort; however, the decreased mortality rate in a sicker cohort of patients argues against this possibility. In contrast to the reduced use of mechanical ventilation, there was an increased use of RRT in the ICON population, as expected with the larger proportion of patients with renal failure dur-ing the ICU stay. Sakhuja et al. also recently reported an increased incidence of acute kidney injury requiring dial-ysis in patients with sepsis between 2000 and 2009 [13].
A number of studies have reported that the incidence of sepsis has increased dramatically over time. However, as suggested by Rhee et al. [14], this may be largely a reporting phenomenon associated with financial reimbursement or increasing awareness of and familiarity with sepsis-related definitions and coding among medical staff [15–17]. Using clinical data alone, these same authors recently reported no increase in sepsis incidence between 2009 and 2014 in almost 8,000,000 admissions to US hospitals, although again incidence increased when sepsis was defined using ICD codes [18]. Our study also suggests that the rate of sepsis (as defined using the criteria of infection associated with organ dysfunction as in the most recent guidelines [9]) has remained relatively stable over the 10-year period. Martin et al. reported an increase in the severity of illness of patients with sepsis across US hospitals over a 22-year Table 2 Incidence and ICU mortality in the two cohorts according to the numbers and types of organ failures
Percentages were calculated after exclusion of missing values
a As defined by a SOFA score > 2 for the organ in question
Incidence, n (%) ICU mortality, n (%)
SOAP (2002) ICON (2012) p value (if < 0.05) SOAP (2002) ICON (2012) p value (if < 0.05)
Sepsis on admission 552 (17.5) 894 (18.4) 185 (33.5) 227 (25.6) 0.001
Type of organ failurea on admission, n (%) (alone or in combination)
Cardiovascular 776 (24.7) 1557 (32.1) < 0.001 278 (35.8) 428 (27.9) < 0.001 Respiratory 696 (22.1) 1194 (24.6) 0.010 207 (29.7) 360 (30.5) CNS 683 (21.7) 1094 (22.5) 255 (37.3) 395 (37.1) Renal 575 (18.3) 898 (18.5) 173 (30.1) 300 (33.8) Coagulation 149 (4.7) 196 (4.0) 60 (40.3) 69 (36.1) Hepatic 85 (2.7) 440 (9.1) < 0.001 29 (34.1) 79 (18.4) 0.001
No of organ failuresa on admission, n (%)
None 1338 (42.5) 1834 (37.8) < 0.001 84 (6.3) 78 (6.0)
1 organ 979 (31.1) 1476 (30.4) < 0.001 180 (18.4) 122 (11.3) < 0.001
2 organs 564 (17.9) 915 (18.9) < 0.001 175 (31.0) 199 (25.8) 0.036
3 organs 215 (6.8) 458 (9.4) < 0.001 111 (51.6) 166 (42.6) 0.033
4 + organs 51 (1.6) 169 (3.5) < 0.001 33 (64.7) 87 (62.4)
Sepsis during the ICU stay 930 (29.6) 1546 (31.9) 0.029 299 (32.2) 386 (25.1) < 0.001
Type of organ failurea during the ICU stay, n (%) (alone or in combination)
Cardiovascular 1052 (33.4) 1978 (40.8) < 0.001 403 (38.3) 571 (29.3) < 0.001 Respiratory 1301 (41.3) 1778 (36.6) < 0.001 393 (30.2) 548 (31.3) CNS 839 (26.7) 1374 (28.3) 347 (41.4) 529 (39.4) Renal 1120 (35.6) 2280 (47.0) < 0.001 338 (30.2) 559 (24.8) < 0.001 Coagulation 309 (9.8) 451 (9.3) 141 (45.6) 178 (40.0) Hepatic 168 (5.3) 944 (19.5) < 0.001 65 (38.9) 185 (19.9) < 0.001
No of organ failuresa during the ICU stay, n (%)
None 903 (28.7) 1120 (23.1) < 0.001 17 (1.9) 35 (3.8) 0.017
1 organ 994 (31.6) 1257 (25.9) < 0.001 71 (7.1) 32 (4.0) 0.004
2 organs 717 (22.8) 955 (19.7) < 0.001 195 (27.2) 90 (13.0) < 0.001
3 organs 368 (11.7) 744 (15.3) < 0.001 178 (48.5) 191 (30.4) < 0.001
period, but a decrease in hospital mortality from 27.8% in 1979–1984 to 17.9% in 1995–2000 [19]. Also in the US, Kumar et al. reported increasing severity of illness, as assessed by the mean number of organ system failures dur-ing the ICU stay, durdur-ing the period 2000–2007, but decreas-ing mortality rates from 39 to 27% [20]. And Stoller et al. made similar findings during the period 2008–2012 [21]. In Spain, Bouza et al. reported a decrease in case fatality rates from 45 to 40% between 2006 and 2011, despite increas-ing disease severity [22], and Kaukonen et al. [2] reported a decrease in mortality from 2000 to 2012 for patients with severe sepsis that persisted when adjusted for severity of illness. The decrease in mortality over time, particularly among patients with sepsis, parallel to the increase in dis-ease severity, is an interesting phenomenon that has been reported previously [19–22], and suggests that progress has been made in the field of intensive care medicine. Indeed, multiple aspects of ICU patient management have changed over the last decade or so, including, among others, more widespread use of lower tidal volume ventilation [23], more restrictive blood transfusion practice [24], reduced sedative use [25] and earlier mobilization, and more rapid appropri-ate intervention in patients with sepsis [26], some of which have been associated with improved outcomes. Of note, in-hospital and 60-day mortality rates were not significantly different in our two cohorts. Our data do not enable us to determine the reasons for this observation, although it is interesting to speculate that ICU management may have improved more than post-ICU care.
The strengths of our study are the comparison of two large multicenter registries conducted 10 years apart in the same month of the year, and which prospectively included
almost identical variables, analyzed in the same center. But our study also has important limitations. First, although data collection was prospective, our study was observational in nature and the analysis retrospective; we therefore can-not discount that unmeasured factors may have confounded our results. Moreover, because of multiple comparisons, an inflated type 1 error may be possible. In addition, although we clearly demonstrate improved survival of critically ill patients over time, notwithstanding the increased sever-ity of illness, we can only speculate on the mechanism of these improved outcomes. Indeed, the observed increased severity of illness may in part be related to changes in ICU admitting practices or in improved capabilities to care for patients in non-ICU settings. These are important areas of future research. Second, we do not have any information about end-of-life decisions or on outcomes after 60 days. We are also unable to comment on differences in the qual-ity of life of the survivors. Return to reasonable physical, mental and cognitive functionality is an important aspect of patient-centered outcomes. Third, although we included centers from the same countries, we were unable to perform a center-by-center comparison. Over time, hospital names and networks have changed, making a direct comparison impractical. Moreover, we had no data to assess how rep-resentative the participating hospitals were of their coun-try. Finally, the SOAP study included patients over a longer period of time (15 days) than the ICON study (11 days). However, this is unlikely to have influenced the results.
Despite these limitations, the present observations show that ICU patients were sicker in our 2012 cohort than in our 2002 cohort. Multilevel analysis showed that survival was improved in the later cohort, especially for
Fig. 1 Percentage of patients (left panel) and ICU mortality rates (right panel) in ICON (2012) and SOAP (2002) studies according to sequential
patients with sepsis. These results are encouraging and suggest that progress has been made in the field of inten-sive care medicine over just a 10-year period.
Electronic supplementary material
The online version of this article (https://doi.org/10.1007/s00134‑017‑5043‑2) contains supplementary material, which is available to authorized users.
Author details
1 Department of Intensive Care, Erasme University Hospital, Unversité Libre
de Bruxelles, Route de Lennik 808, 1070 Brussels, Belgium. 2 Service des
Réanimations, Division Anesthésie Réanimation Douleur Urgence, CHU Nîmes, Nîmes, France. 3 Department of Anesthesiology, Intensive Care and Acute
Intoxications, Pomeranian Medical University, Szczecin, Poland. 4 Department
of Medicine, Medical College of Wisconsin, Milwaukee, WI, USA. 5 Multidisci‑
plinary Intensive Care Research Organization (MICRO), St James’s University Hospital, Trinity Centre for Health Sciences, HRB‑Welcome Trust St James’s Hospital, Dublin, Ireland. 6 Critical Care Department, Cliniques Universitaires
St Luc, UCL, Brussels, Belgium. 7 Department of Anesthesiology and Operative
Intensive Care Medicine, University of Witten/Herdecke, Cologne, Germany.
8 Department of Intensive Care Medicine, Radboud University Medical Centre,
6500 HB Nijmegen, The Netherlands. 9 Unidade de Cuidados Intensivos Neuro‑
críticos, Hospital de São José, Centro Hospitalar de Lisboa Central, Nova Medi‑ cal School, Lisbon, Portugal. 10 Department of Anesthesiology and Intensive
Care, Uniklinikum Jena, Jena, Germany.
Acknowledgements
We would like to thank Hassane Njimi PhD for his help with the statistical analyses.
Table 3 Summary of multilevel analysis with ICU mortality as the dependent variable
The interaction between sepsis/non-sepsis and SOAP/ICON is significant
a Without age component
Variables Model 1 Model 2 p value Model 3 p value
OR (95% CI) OR (95% CI) OR (95% CI)
Fixed‑effects, varying within clusters
Age – – 1.02 (1.02–1.03) < 0.001 Sex, male – – 0.92 (0.85–1.00) 0.037 SAPSIIa – – 1.06 (1.06–1.07) < 0.001 Type of admission (%) Surgical – – Medical – – 1.49 (1.22–1.82) < 0.001 Other – – 1.81 (1.09–2.98) 0.021 Source of admission OR/recovery – – Other hospital – – 1.17 (0.88–1.57) 0.282 ER/ambulance – – 1.31 (1.13–1.53) 0.001 Hospital floor – – 1.47 (1.18–1.84) 0.001 Other – – 1.42 (0.98–2.06) 0.062 Comorbidities COPD – – 1.07 (0.90–1.28) 0.423 Cancer – – 1.25 (1.00–1.55) 0.050 Insulin‑dependent diabetes – – 0.72 (0.57–0.92) 0.008
Heart failure, NYHA III/IV – – 1.22 (1.00–1.49) 0.053
HIV infection 1.38 (0.78–2.44) 0.271
Cirrhosis 2.15 (1.70–2.71) <0.001
Procedures
Mechanical ventilation – – 3.57 (2.57–4.95) < 0.001
Renal replacement therapy – – 1.86 (1.51–2.30) < 0.001
Study (ICON vs. SOAP)
Non‑sepsis 0.95 (0.77–1.17) 0.611 0.64 (0.53–0.77) < 0.001 Sepsis 0.70 (0.54–0.91) 0.009 0.45 (0.35–0.59) < 0.001 Random‑effects Country Variance (SE) 0.21 (0.09) 0.14 (0.07) 0.06 (0.05) p value 0.015 0.033 0.229 Centers Variance 0.23 (0.05) 0.23 (0.05) 0.29 (0.07) p value < 0.001 < 0.001 < 0.001
Author contributions
JLV designed the study, analyzed the data and drafted the article; YS partici‑ pated in the original ICON and SOAP studies, helped analyze the data and draft the article; JYL, KK, RN, IML, XW, SGS, and PP participated in the original ICON study and revised the article for critical content; RM participated in the original SOAP study and revised the article for critical content. All authors read and approved the final manuscript.
Compliance with ethical standards Conflicts of interest
The authors have no conflicts of interest to declare.
Open Access
This article is distributed under the terms of the Creative Commons Attribu‑ tion‑NonCommercial 4.0 International License (http://creativecommons.org/ licenses/by‑nc/4.0/), which permits any noncommercial use, distribution, and reproduction in any medium, provided you give appropriate credit to the original author(s) and the source, provide a link to the Creative Commons license, and indicate if changes were made.
Received: 17 October 2017 Accepted: 29 December 2017 Published online: 15 February 2018
References
1. Kadri SS, Rhee C, Strich JR, Morales MK, Hohmann S, Menchaca J, Suf‑ fredini AF, Danner RL, Klompas M (2016) Estimating ten‑year trends in septic shock incidence and mortality in United States academic medical centers using clinical data. Chest 151:278–285
2. Kaukonen KM, Bailey M, Suzuki S, Pilcher D, Bellomo R (2014) Mortality related to severe sepsis and septic shock among critically ill patients in Australia and New Zealand, 2000–2012. JAMA 311:1308–1316 3. Rhee C, Gohil S, Klompas M (2014) Regulatory mandates for sepsis care‑
reasons for caution. N Engl J Med 370:1673–1676
4. Vincent JL, Mira JP, Antonelli M (2016) Sepsis: older and newer concepts. Lancet Respir Med 4:237–240
5. Vincent JL, Sakr Y, Sprung CL, Ranieri VM, Reinhart K, Gerlach H, Moreno R, Carlet J, Le Gall JR et al (2006) Sepsis in European intensive care units: results of the SOAP study. Crit Care Med 34:344–353
6. Vincent JL, Marshall JC, Namendys‑Silva SA, Francois B, Martin‑Loeches I, Lipman J, Reinhart K, Antonelli M, Pickkers P et al (2014) Assessment of the worldwide burden of critical illness: the Intensive Care Over Nations (ICON) audit. Lancet Respir Med 2:380–386
7. Le Gall JR, Lemeshow S, Saulnier F (1993) A new simplified acute physiol‑ ogy score (SAPS II) based on a European/North American multicenter study. JAMA 270:2957–2963
8. Vincent JL, Moreno R, Takala J, Willatts S, de Mendonça A, Bruining H, Reinhart CK, Suter PM, Thijs LG (1996) The SOFA (sepsis‑related organ failure assessment) score to describe organ dysfunction/failure. Intensive Care Med 22:707–710
9. Singer M, Deutschman CS, Seymour CW, Shankar‑Hari M, Annane D, Bauer M, Bellomo R, Bernard GR, Chiche JD et al (2016) The third interna‑ tional consensus definitions for sepsis and septic shock (sepsis‑3). JAMA 315:801–810
10. Goldstein H (2003) Multilevel statistical models. Hodder Arnold, London 11. Demoule A, Chevret S, Carlucci A, Kouatchet A, Jaber S, Meziani F,
Schmidt M, Schnell D, Clergue C et al (2016) Changing use of noninvasive ventilation in critically ill patients: trends over 15 years in francophone countries. Intensive Care Med 42:82–92
12. Frat JP, Thille AW, Mercat A, Girault C, Ragot S, Perbet S, Prat G, Boulain T, Morawiec E et al (2015) High‑flow oxygen through nasal cannula in acute hypoxemic respiratory failure. N Engl J Med 372:2185–2196
13. Sakhuja A, Kumar G, Gupta S, Mittal T, Taneja A, Nanchal RS (2015) Acute kidney injury requiring dialysis in severe sepsis. Am J Respir Crit Care Med 192:951–957
14. Rhee C, Murphy MV, Li L, Platt R, Klompas M (2015) Comparison of trends in sepsis incidence and coding using administrative claims versus objec‑ tive clinical data. Clin Infect Dis 60:88–95
15. Epstein L, Dantes R, Magill S, Fiore A (2016) Varying estimates of sepsis mortality using death certificates and administrative codes—United States, 1999–2014. Morb Mortal Wkly Rep 65:342–345
16. Bouza C, Lopez‑Cuadrado T, Amate‑Blanco JM (2016) Use of explicit ICD9‑ CM codes to identify adult severe sepsis: impacts on epidemiological estimates. Crit Care 20:313
17. Gohil SK, Cao C, Phelan M, Tjoa T, Rhee C, Platt R, Huang SS (2016) Impact of policies on the rise in sepsis incidence, 2000–2010. Clin Infect Dis 62:695–703
18. Rhee C, Dantes R, Epstein L, Murphy DJ, Seymour CW, Iwashyna TJ, Kadri SS, Angus DC, Danner RL et al (2017) Incidence and trends of sepsis in US hospitals using clinical vs claims data, 2009–2014. JAMA 318:1241–1249 19. Martin GS, Mannino DM, Eaton S, Moss M (2003) The epidemiology
of sepsis in the United States from 1979 through 2000. N Engl J Med 348:1546–1554
20. Kumar G, Kumar N, Taneja A, Kaleekal T, Tarima S, McGinley E, Jimenez E, Mohan A, Khan RA, Whittle J, Jacobs E, Nanchal R; Milwaukee Initiative in Critical Care Outcomes Research (MICCOR) Group of Investigators (2011) Nationwide trends of severe sepsis in the 21st century (2000–2007). Chest 140:1223–1231
21. Stoller J, Halpin L, Weis M, Aplin B, Qu W, Georgescu C, Nazzal M (2016) Epidemiology of severe sepsis: 2008–2012. J Crit Care 31:58–62 22. Bouza C, Lopez‑Cuadrado T, Saz‑Parkinson Z, Amate‑Blanco JM (2014)
Epidemiology and recent trends of severe sepsis in Spain: a nationwide population‑based analysis (2006–2011). BMC Infect Dis 14:3863 23. The Acute Respiratory Distress Syndrome Network (2000) Ventilation with
lower tidal volumes as compared with traditional tidal volumes for acute lung injury and the acute respiratory distress syndrome. N Engl J Med 342:1301–1308
24. Hebert PC, Wells G, Blajchman MA, Marshall J, Martin C, Pagliarello G, Tweeddale M, Schweitzer I, Yetisir E (1999) A multicenter, randomized, controlled clinical trial of transfusion requirements in critical care. Transfu‑ sion Requirements in Critical Care Investigators, Canadian Critical Care Trials Group. N Engl J Med 340:409–417
25. Baron R, Binder A, Biniek R, Braune S, Buerkle H, Dall P, Demirakca S, Eckardt R, Eggers V et al (2015) Evidence and consensus based guideline for the management of delirium, analgesia, and sedation in intensive care medicine. Revision 2015 (DAS‑Guideline 2015)—short version. Ger Med Sci 13:Doc19
26. Miller RR III, Dong L, Nelson NC, Brown SM, Kuttler KG, Probst DR, Allen TL, Clemmer TP (2013) Multicenter implementation of a severe sepsis and septic shock treatment bundle. Am J Respir Crit Care Med 188:77–82