U
NIVERSITÀ DEGLI
S
TUDI DI
C
ATANIA
Dipartimento di Scienze Biologiche, Geologiche e Ambientali
Sezione Scienze della Terra
D
OTTORATO
DI
R
ICERCA
IN
G
EODINAMICA
E
S
ISMOTETTONICA
XXV
CICLO
SEISMIC CHACTERIZATION OF VULCANO ISLAND AND
A
EOLIAN AREA BY TECTONIC AND SEISMO
-
VOLCANIC
EVENTS
Dott. Vincenzo Milluzzo
Coordinatore
Prof. Carmelo Monaco
Tutor Co-tutor
Prof. Stefano Gresta Dott. Salvatore Alparone
Dott. Salvatore Gambino
Contents
1. Introduction, key aims and organization of the thesis ...……... 1
2. Geological and structural overview of the Aeolian islands..…... 8
3. Vulcano island: geological e structural framework………...…....15
4. Time-space variation of volcano-seismic events at La Fossa of Vulcano …....……….24
4.1 Introduction ……….………24
4.2 Instrumental topics and dataset.………...27
4.3 Classification………29
4.4 Time variations………35
4.5 Location………...43
4.6 Discussion and conclusions……….45
5. Tornillos at Vulcano: clues to the dynamics of the hydrothermal system………...……….. 51 5.1 Introduction ………...…... 51 5.2 Data analysis ……...……….………... 54 5.2.1 Spectral analysis ……….……….. 58 5.2.2 Classification ………... 61 5.2.3 Polarization analysis ………….………63 5.2.4 Source location………...68 5.2.5 Amplitude modulation……….………..69 5.3 Discussion...………...……... 75 5.4 Concluding remarks………...………...80
6. Multiparametric approach in investigating
Volcano-Hydrothermal systems: the case study of Vulcano....… 81
6.1 Introduction……….. ………81
6.2 Seismic data……….………. 86
6.3 Temperature data ……….……….………91
6.4 Tilt data ………...……….……… 95
6.5 Comparison among daily number of volcano-seismic events, fumarole temperatures and rainfall ………. 96
6.6 Discussion ………... 98
6.7 Concluding remarks ………... 103
7. Relocation and focal mechanisms of earthquakes in the south-central sector of the Aeolian Archipelago: new structural and Volcanological insights…………..……… ……...……...104
7.1 Introduction ……….……….…...…… 104
7.2 Geological and structural setting………..106
7.3 Network and data analysis ……….…...…108
7.4 Accurate hypocenter locations………...…...110
7.4.1 Inversion for the minimum 1D model…..………… 110
7.4.2 Earthquake relocations and focal mechanisms….... 114
7.5 Discussion ………118
7.5.1 The Filicudi-Salina area………....…………118
7.5.2 The Lipari-Vulcano area ………... 119
7.6 Conclusions………...…………...…123
8. Conclusions……….…………. 125
Acknowledgments………...………... 131
Chapter 1
Introduction, key aims and organization of the thesis
Volcanic unrest is often recorded as variations in a number of physical parameters. Different geophysical techniques are used to monitor these parameters (seismology, deformation analyses, remote sensing, electromagnetic studies, gravimetry, infrasound analyses, etc…). The seismology gives useful information about the location of magma bodies/hydrothermal fluids in depth, their dynamics and composition and the plumbing system geometry (e.g. Kumagai and Chouet, 1999; Chouet et al., 2003; Patanè et al., 2006). Moreover, most of the volcanic eruptions have been preceded by an increase in earthquake activity beneath or near the volcano (McNutt, 1996).
The multi-disciplinary approaches are proven to be the best way to improve our knowledge about volcano dynamics. However, monitoring active volcanoes to
forecast major eruption still remains a serious problem. In fact, although measurable changes in geophysical and geochemical data are observed at many volcanoes before eruptions, no unique simple laws of prediction can be determined.
Volcanic seismology is the branch of seismology in which the seismological techniques are applied to understand the physical conditions and dynamic status of volcanic systems. For many years it was the principal instrument to observe both the active and quiescent volcanoes. The main goal of volcanic seismology is the identification of variations in volcanic activity by observation of changes in behaviour of seismic parameters, in order to predict eruptions or, in the event of eruptions in progress, the evolution of these for short and medium term (Neuberg et al., 2006). The volcanic seismology has developed strongly over the past 10-15 years, by using sophisticated broadband seismic equipment and application of new techniques of observation and analysis (Kawakatsu et al., 2000).
Active volcanoes are source of a great variety of seismic signals. Traditionally, seismo-volcanic signals have been classified into five different types: high-frequency (HF) also called volcano-tectonic (VT); low-high-frequency (LF) earthquakes also called long period (LP); volcanic tremor; hybrid events and volcanic explosions also called explosion-quakes (e.g. Minakami, 1974; Lahr et al., 1994; McNutt, 1996; Zobin, 2003; Ibanez et al., 2003).
Based on this premise, the aim of this thesis is twofold: 1) to analyze the seismo-volcanic events of Vulcano, defined as seismic events linked to the dynamics of the shallow hydrothermal system (Alparone et al., 2010); 2) to study the tectonic earthquakes, linked to the main structures of the Aeolian area, in order to better understand the seismogenic characteristics of the area. The two categories of events will be analyzed at first separately and only in the final phase of the project will look for a relationship between them and the volcanic activity at Vulcano.
The island of Vulcano is part of the Aeolian archipelago located in the southern Tyrrhenian basin. After the last eruption in 1888-1890 (fig. 1.1), the only
activity on the island is associated with hydrothermal systems and the fumaroles of La Fossa area, where seismo-volcanic events originates.
Fig. 1.1 Representation of the eruption of 1888-1890, taken from: "The eruptions of Vulcano" by O. Silvestri, 1891.
In the first part of the thesis we report the results of the study on seismo-volcanic events that characterize the area of La Fossa of Vulcano. This particular type of earthquakes, with very local character due to low energy associated, shows different morphological and spectral characteristics compared to the tectonic events recorded on the same island, which will be analyzed in the second part of the thesis.
The microseismicity of Vulcano involved since the 60s a number of researchers, some of which have provided an interpretation of the mechanism of genesis of these events, based mainly on the study of the waveforms.
The results achieved by these authors can be summarized as:
Latter (1971)
√ There are "Unusually perfect sinusoidal tremors" and events with a strong affinity to small tectonic shock;
√ The first impulse is followed by a train of sine waves showing no dispersion;
√ The magnitude of these event is negative;
√ The source is a mechanism of resonance, probably caused by gaseous explosions in cavity above the magma chamber;
Blot (1971)
√ The events show regular wave train after the arrival of the first phase; √ Sometimes two phases are distinguishable: Rayleigh and S;
√ We propose a classification based on the frequency content of seismic events: 1st class = 20 Hz, 2nd class = 13 ± 3 Hz, 3 rd class = 8 Hz;
√ The events are interpreted as an explosion inside a resonant tube below the crater between 500 and 1000 m depth;
Del Pezzo (1981, 1983)
√ The seismicity presents: a dominant low-frequency (2 Hz), the absence of clear phases in the seismogram and a marked monochromaticity; √ The source mechanism probably related to degassing;
√ From a classification based on both the frequency content that the hypocentral depth can be distinguished: high-frequency shallow events and low frequency deep events;
Neri (1981)
√ There are “Volcanic-tectonic” and “Volcanic” events;
√ Those volcanic show a very smooth swing and suggest a mechanism of resonance in a cavity;
Falsaperla e Neri (1986)
√ The microseismicity is associated with both degassing and fracturing phenomena;
√ The shallow seismicity of La Fossa is explained by "wave tube" generated by explosive sources in columns of fluids;
Godano e Vilardo (1991)
√ The events are generated by excess pressure in the fracture filled by magmatic fluids;
Bottari et al. (1992)
√ There are two classes of events: high frequency with a first arrival pulse and a clear S phase; low-frequency monochromatic events, very shallow and located on the main fumarolic fields;
Montalto (1994, 1996)
√ There are two main categories M-shocks and N-shocks events, respectively monochromatic events related to a mechanism of resonance and N-type events "not monochromatic" related to mechanisms of hydrothermal alteration of material;
The proposed classifications and interpretations on the genesis of seismo-volcanic events of Vulcano, confirmed that the island's seismo-volcanic system is complex and time-varying. Although most authors interpret microseismicity of La Fossa generated by processes such as degassing or micro fracture, but the apparent lack of a model does not allow to give a robust interpretation.
In this thesis, a detailed analysis was conducted on the waveforms and frequency content of seven thousand of seismo-volcanic events recorded from January 2004 to December 2009. Based on the results obtained, in the chapter 4 we propose a new classification of local seismic events of Vulcano, which did not presume to replace the previous ones, but that simply identifies in detail the most recent seismicity. This classification is also reflected by the results of a detailed analysis of cross-correlation.
We investigated also the relationship between volcano-seismic events, recorded at La Fossa crater of Vulcano during 2004-2009, and the dynamics of the
hydrothermal system. Thanks to the use of powerful tools such as time-frequency analysis of Fourier and Wavelet, we analyze the temporal variations of the frequency content of seismic events, in order to have more information about the properties, evolution and current status of the volcanic island.
In detail, chapter 4 regards the time variations of long period events occurring in the time period 2004-2009 at Vulcano and chapter 5 regards the analysis and the time variation of the tornillos events occurring in the same period at Vulcano island. We decided to better analyze this two classes of seismo-volcanic events because the long period events have increased in number during the first three years analyzed while the tornillos events have increased in number during the last years analyzed. In fact while only 15 tornillos were recorded during 2004–2006, one thousand of tornillos occurred in 2007–2009 time period. So we chose to study in detail this two class of events (LP and TR) to better characterize the whole studied period and with the aim of investigating their source mechanism and their relationship with hydrothermal activity.
In chapter 6 we compared different geophysical and geochemical data setsand the time relations among the different time series are discussed. The objective of this phase of the project was the quantitative study on the relationship between the time series of temperature (both on the ground that the fumaroles), earthquakes (near the island of Vulcano), CO2 dataset and seismo-volcanic
events. At the end of this part of the thesis, based on the results obtained on the analysis of the seismo-volcanic events and on their features, we can infer that such events at Vulcano are related to two different source mechanisms: (1) fracturing processes of rocks and (2) resonance of cracks (or conduits) filled with hydrothermal fluid.
After careful analysis of the seismo-volcanic events of the Aeolian area, in the chapter 7 the attention was paid to the tectonic events, in order to find possible relationships with the volcanic activity in the area. The aim of this part of the thesis is to identify spatial clusters of earthquakes, locate active seismogenic zone and their relationships with the volcanic activity in the Aeolian Archipelago.
To recognize possible spatial clusters and identify active seismogenic zones and structures in the Aeolian Archipelago, in the south of Italy, we analyzed the spatial pattern of seismicity between 1993 and 2010 in a selected area comprising Vulcano, Lipari, Salina and Filicudi and calculated 22 fault plane solutions (FPSs) for shocks with magnitude greater than 2.7. First, we computed a 1-D velocity model for this area including information from recorded earthquakes by a joint hypocenter-velocity inversion (Kissling et al., 1994). Successively, we applied the double-difference approach of Waldhauser and Ellsworth (2000), finding that a certain part of the scattered epicenter locations collapse in roughly linear features.
A detailed discussion is focused on a seismogenic structure, NE–SW oriented, 3–8 km deep, located in the northern area of Vulcano island. This recognized element could represent a link between magma accumulation zones, thus representing a possible preferential pathway along which magma may intrude. In the chapter 8 we tried to summarize the obtained results and we proposed a new interpretative model on the genesis of the seismo-volcanic events, their time variation and the tectonic activity of the Aeolian area.
This work can provide useful suggestions for not only the results, but because it goes to pay attention on a volcanic system, whose activity in the last two decades has increased significantly, showing signs of a potential reactivation. This is evidenced by the numerous crises characterized by large variations in temperature, chemical and isotopic composition of fumarolic fluids and thermal waters (Chiodini et al., 1992; Montalto, 1996).
Chapter 2
Geological and structural overview of the Aeolian islands
The presence of both constant seismic activity and active volcanism in Aeolian Arc is the evidence that this area is characterized by high geodynamic activity. Several authors have suggested various models on the origin and evolution of the Tyrrhenian Basin:√ The first proposed models are based on the mechanism of oceanization (Van Bemmelen, 1969; Morelli, 1970; Selli e Fabbri, 1971) or on the expansion mechanism. On the base of this mechanism, the retroarch expansion generates the Tyrrhenian Basin as a marginal basin (Barberi et al., 1973; Boccaletti et al., 1976);
√ Other hypotheses suggest that the opening of the western Mediterranean basin and the origin of the Tyrrhenian Sea during the Late Miocene, are due to a "split" between Alps and the Apennines orogenesis, followed by creation of new lithosphere. In this model, the "split" is accompanied by
a counterclockwise rotation of the Italian peninsula, with a consequent compression of the central region and a strong distortion of the Calabro-Peloritano Arc (Scandone, 1979; Gasparini et al., 1982);
√ A model of Mantovani et al. (1982) proposed that the structural evolution of central and western basins of the Mediterranean and of the Calabro-Peloritano Arc, have been determined by a left lateral collision between Europe and Africa and by a counterclockwise rotation of the Adriatic plate;
√ A migration process of backarc is assumed by Malinverno and Ryan
(1986);
√ Locardi (1988) correlates the genesis of the Tyrrhenian Sea with the development and growth of a diapiric mantle structure;
√ Patacca et al. (1990) associate the formation of the Tyrrhenian Sea with a passive subduction of the Ionian lithospheric slab;
√ Another model suggests instead a mechanism of passive ascent of the mantle due to post-collisional phase of the plates (Ventura et al., 1999).
What seems certain is that the Tyrrhenian Basin was located in a series of blocks parallel to the margin of the basin, in accordance with the Apennines trend. However all authors seem to agree in assuming a general process of opening with kinematics in southeast direction (fig. 2.1).
In the Aeolian area are present several variations in the direction of the fault systems: in fact the faults show a NS trend in northern Calabria, a NE-SW trend in the southern Calabria and EW in northern Sicily (Ghisetti e Vezzani, 1981). A relocation of deep earthquakes in this area and some studies based mainly on the focal mechanisms of shallow and deep earthquakes, led Gasparini et al. (1982) to hypothesize a Benioff spoon-shaped plan, laterally extended from the Gulf of Naples to Ustica island, which reaches a depth of 500 km.
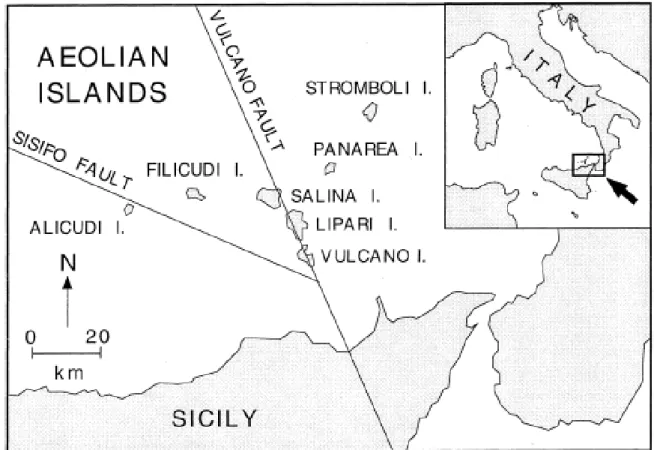
In south-eastern margin of the Tyrrhenian Sea, a few tens of kilometres from the northern coast of Sicily, in addition to the numerous seamounts, we find the volcanic arc of the Aeolian Islands. The archipelago consists of seven islands surrounded by several rocks, among which that of Basiluzzo. Five of these islands: Alicudi, Filicudi, Salina, Panarea and Stromboli form a ring structure that extends for 80 km with N-NW concavity, while the other two: Lipari (the largest with its 37.3 km2) and Vulcano (the southernmost island of the archipelago is just 22 km from the shores of Capo Milazzo), are located along a NW-SE trend that obliquely intersects the arc just near the island of Salina. The archipelago is made up of volcanic islands whose complex morphology can be explained, in addition to the eruptive activity, with the action of sea and tectonic activity. The three islands still volcanically active are: Stromboli, with a persistent eruptive activity, Vulcano, famous for its numerous explosive eruptions in historical times, the last of which dates from 1888-1890, and Lipari, whose last eruption is dated about 1400 years before Christ. The Aeolian volcanism highlights a wide compositional range consists of calcalin, shoshonitic and potassic alkaline products, it also notes that moving counterclockwise from NW to SE along the arc, the corresponded volcanic activity is progressively younger (Barberi et al. , 1973; Keller, 1980).
The Aeolian Islands are located thus in a region of low crustal thickness: according to Morelli et al. (1975) the thickness varies from 18 to 25 km, but the Moho becomes deeper probably reaching the 35 km southward under Peloritani and eastward in Calabria.
From a structural standpoint, the area of the north-eastern Sicily shows a "tectonic alignment" that connects the Aeolian islands with the Maltese-Ibleo escarpment, NNW-SSE oriented and with right movements (Barbano et al., 1979). In particular we highlighted major dislocations with a lithospheric character like "Aeolian-Tindari-Giardini", capable of influencing in a decisive way the seismic activity in the area and to play a key role in the development of the volcanic structures (see chapter 7) (Barbano et al. , 1979; Ghisetti and Vezzani, 1981, Frazier et al., 1982). Another structure with WNW-ESE direction, is located in the western sector, near the seamount of Sisifo and affects Alicudi and the area near Vulcano Island (fig. 2.2).
Fig. 2.2: Aeolian archipelago with the two main structures in the area:
In the region of the Aeolian islands, the release of seismic energy presents variability in seismic styles (fig. 2.3; 2.4). In the Gulf of Patti, for example, are recorded sequences like "mainshock-aftershock"; near to Vulcano there is a clear dominance of seismic swarms; while to the west of Lipari and Vulcano coexist the two different phenomena with modest release of energy. On the basis of tectonic structures that are activated, the recorded seismic events in the Aeolian area are divided into two classes:
I. In a first class “local seismicity" are grouped the shocks generated by
local structures. The small magnitude values that distinguish this class could be due to the presence of active volcanism that would not allow the accumulation of very high stress and the subsequent release of large amounts of energy (Del Pezzo and Martini, 1981);
II. Belong instead to the second class "regional seismicity” mainly the
tectonic earthquakes related to tectonic phenomena and generally characterized by values greater than magnitude 2.5 (Falsaperla and Blacks, 1986). The most energetic seismic event, belonging to this class, in recent decades, it is certainly the earthquake of April 15, 1978, with magnitude 5.5. This event, located in the Gulf of Patti, was followed by a sequence of “aftershocks”, characteristic of areas with homogeneous medium where the stresses are concentrated in the space.
Fig. 2.3: Seismicity recorded by INGV from: (a) 1978 to 2000; (b) from 2001 to 2003
Fig. 2.4: Seismicity recorded in the Tyrrhenian Basin (inset in red) by INGV in the period 1993 to 2006, compared with the seismicity recorded in area of Lipari-Vulcano (inset in blue) at the same time interval (Puglisi et al. 2007).
The Aeolian area compared to neighbouring seismically active areas, presents different geological and seismotectonic features. The Etna region, located about 100 km south of the Aeolian Islands, is characterized by a basaltic volcanism and earthquakes with moderate magnitude; the Strait of Messina, on the eastern edge of the arc of islands, can be described as graben structure (Bottari et al., 1992) characterized by earthquakes with low frequency of occurrence and high magnitude, as witnessed by the strong magnitude 7.2 event of 1908 that devastated the city of Messina.
The earthquake of Messina is one of the most devastating events that have affected the Italian territory in the last centuries. All authors agree that the focal mechanism was of normal type, however there is no convergence of views regarding the determination of the position and geometry of the tectonic structure that generated the aforementioned earthquake (Bottari et al., 1986; Valensise and Pantosti, 1992).
Chapter 3
Vulcano island: geological e structural framework
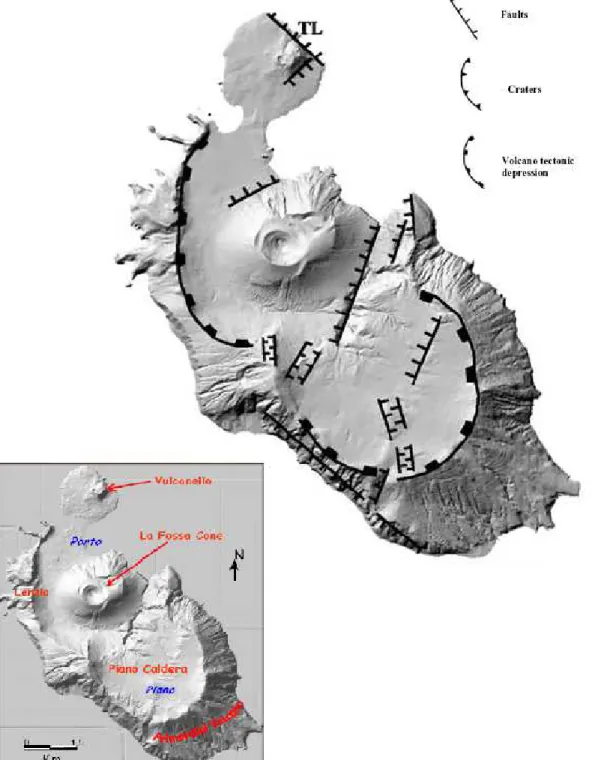
Vulcano is the southernmost of the Aeolian Islands, a volcanic arc lying on the south eastern side of the Tyrrhenian Sea in the south of Italy. The island of Vulcano, has been known since the ancient ages for its intense volcanic activity. In antiquity the island was sacred to Hephaestus, the god of volcanoes and endogenous forces of nature and was known as Hiera (the sacred) or Hierà Ephaestus (the island sacred to Hephaestus). The entire island has an area of 22 Km2 and has an irregular shape, roughly similar to a parallelogram elongated NW-SE direction with an appendix in the northern part constituted by of Vulcanello. At Vulcano, we can distinguish three zones with different characteristics (fig. 3.1). A great mass formed by the SE Old Vulcano (Caldera del Piano), a middle part consisting of the current cone of La Fossa and the
northern extreme part of Vulcanello consisting of circular shape with a diameter of 1300 meters.
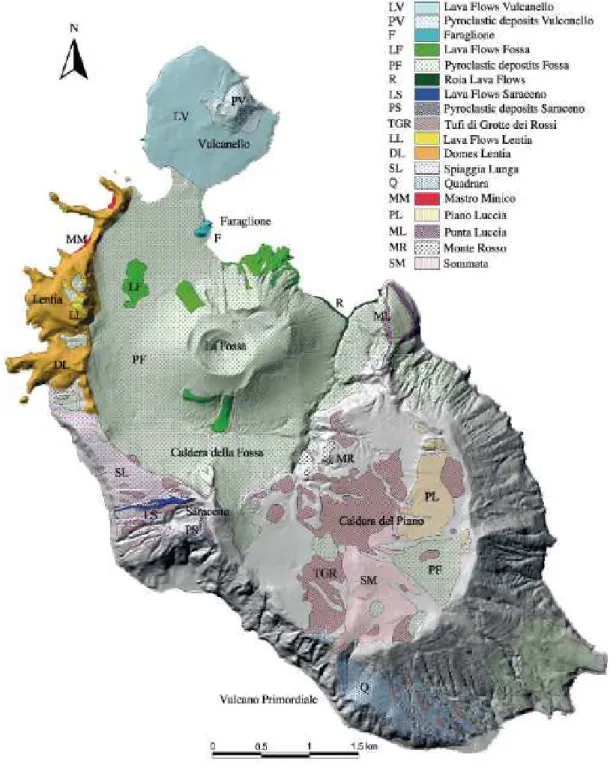
From the geological point of view (fig. 3.2): Old Vulcano is formed by a crater of few kilometers in diameter, which forms the southern frame of the island. It is characterized by an alternation of pyroclastic scoria and basaltic lava flows associated with sandy pyroclastite that have given rise to a Strombolian cone type with a height, from mean sea level, of about 1000 meters (Frazier and La Volpe, 1987; Gioncada et al., 2003). The truncated cone has a very large bottom base; radiometric surveys have determined for this old crater, an age of just over 100,000 years (Frazier and La Volpe, 1987). Subsequently the island's volcanic activity has migrated northward and the old cone, remained inactive, it has been partially filled by effusive material and / or exploded during subsequent eruptions. The second main part of the island is formed by the current volcano of La Fossa, in the northern-central part of the island. La Fossa consists of a cone of 390 meters above sea level surrounded by the remains of the previous cones, and has a base diameter of 2 km. The present cone of La Fossa, always subaerial, was born on a basaltic lava flow of the old volcano and is made up mainly of ash and lapillus compacted together. Here, there is intense fumarolic activity that defines an ideal alignment from south to north that joins the main crater of the current volcano to Vulcanello fumarols. Vulcanello has nearly perfect conical shape and stands 123 meters above sea level. Originally, it was more detached from the island, but in 1550, the date on which dates the last eruptive period of Vulcanello, it was joined by an isthmus formed by volcanic ash erupted from Vulcanello itself or the cone of La Fossa.
Figure 3.1: Structural map of Vulcano island, showing the shallow evidence of the "Aeolian-Tindari-Giardini" structures (Gioncada et al., 2003).
Figure 3.2: Schematic geological superimposed an image of the island of Vulcano (DEM Gioncada et al., 2003).
A structural study of the Vulcano island conducted by Ventura (1994) has identified two main systems of strike slip faults oriented NW-SE along the north-eastern and south-western coasts. These structures seem to be the shallow expressions of major regional crustal structures and are accompanied by a series of normal faults with NE-SW and NS trend. The geometric relationships between the different fault systems, as well as the presence of two calderas within the island, would consist according to Ventura (1994) with the structural association observed in pull-apart basins (fig. 3.3).
Figure 3.3: (a) Structural map of Lipari and Vulcano, and sector of surrounding sea; (b) structural model of Lipari and Vulcano: pull-apart basin (Ventura, 1994).
Vulcano has been active in the last few centuries, erupting calc-alkaline and shoshonitic products (Barberi et al., 1974) and showing an explosive nature with frequent transitions from phreato-magmatic to magmatic activity (Mercalli and Silvestri, 1890; Barberi et al., 1988). A magmatic body was identified at a depth of 2-3 km below La Fossa crater by geophysical and geochemical studies (Ferrucci et al., 1991; Clocchiatti et al., 1994; Nuccio and Paonita, 2001). Researchers also agree on the presence of an hydrothermal system below the La Fossa cone (Chiodini et al., 1993 and 1995; Nuccio et al., 1999; Paonita et al., 2002), whose thermodynamic conditions (temperature, pressure and composition) can show large temporal variations (Di Liberto et al., 2002). Since the last eruption in 1888-1890, volcanic activity produces fumarolic emissions varying in intensity and temperature over time. The fumaroles are mainly concentrated at La Fossa crater (fig. 3.1), where the fumarole fields, as well as the steam heated areas, have significantly expanded in the last 20 years (Bukumirovic et al., 1997; Boyce et al., 2007). Based on geochemical studies (Chiodini et al., 1993; Nuccio et al., 1999), the fumarolic emissions of La Fossa crater are fed by fluids coming from both the magmatic and the hydrothermal system.
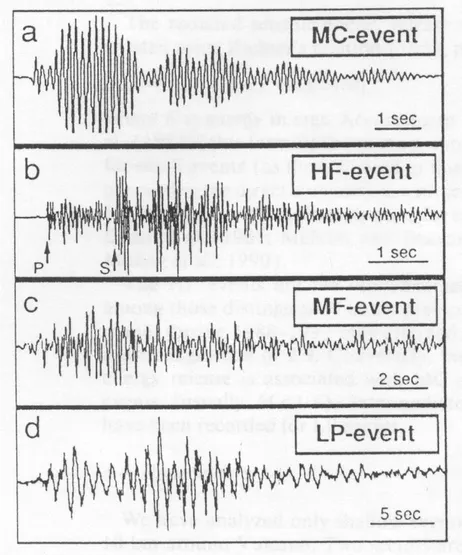
Apart from regional earthquakes, recognizable by the high duration (60-150 s) and difference S-P variable from 3 to 16 s, the seismic activity recorded at Vulcano is distinguishable in two main categories (fig. 3.4 ):
I. “Volcano-tectonic”(VT) events for brittle fracturing. Similar to the VT earthquakes defined in other classifications (e.g. Wassermann, 2009), they are originated by shear failure caused by stress buildup and resulting in slip on a fault plane.
II. "Seismo-volcanic" events associated with the fluid dynamics in the conducts of fumarolic field, which constitute the background microseismicity almost constantly recorded on the island (Latter, 1981; Montalto, 1994);
The "volcano-tectonic" earthquakes with local nature show these main features: √ evident P-S phases;
√ hypocentral depth usually <4.5 km; √ magnitude on average <2.5;
√ polychromatic nature with high content of high frequency (10-25 Hz);
√ duration of 10-80 seconds; √ first impulsive arrival;
√ low variability of the signal to the various stations; √ higher energy values compared to "volcanic” events ; √ they can occur in seismic swarms;
Several studies have also confirmed that the occurrence of these events can lead to changes:
√ on the chemical composition of the fumaroles (Chiodini et al., 1992);
√ on the heat flow (Barberi et al., 1991; Alparone and Aubert, 2000);
√ on the phases of ground deformation (Falsaperla et al., 1989, Barberi et al., 1991);
Considering instead the "seismo-volcanic" earthquakes it is clear that are characterized by:
√ absence of P or S phases clearly identifiable (elliptic-circular particle motion);
√ hypocentral depth less than 2 km; √ average duration of 20 s.;
√ magnitude usually <1.5 (even negative); √ amplitudes 10-6
-10-5 m/s (Luongo et al., 1989);
√ diffuse monochromaticy (typical of events related to fluid dynamics);
√ low detection at the stations: are mainly detected at "Vulcano crater" station (IVCR) on the northern slopes of the volcano; √ high heterogeneity of the waveforms;
The events belonging to this second category represent a quantitatively important percentage and provide useful information on the mechanisms of earthquake generation connected to the fluid dynamics inside the volcano.
Figure 3.4: Typical examples of waveforms of events: "seismo-volcanic" a) c) d);
Increases in the temperatures of the fumaroles and changes in the chemical composition of their emissions (mainly an increase in the CO2 flux and
concentration), called temperature and geochemical anomalies, respectively, occur at the same time as the number of seismo-volcanic events increases at La Fossa of Vulcano (fig. 3.5) (Alparone et al., 2010; Aubert et al., 2008; Granieri et al., 2006; Inguaggiato et al., 2008). The most recent anomalies were observed in the period 2004-2009. There is broad agreement among researchers about the fact that both seismic and geochemical anomalies are related to increased inputs of magmatic fluids into the fumarolic system, whereas their relationship to unrest processes leading up to eruptions is still being debated (Barberi et al., 1991; Italiano and Nuccio, 1992; Bukumirovic et al., 1997; Granieri et al., 2006; Nuccio et al., 1999; Nuccio and Paonita, 2001).
Figure 3.5: Photos of "La Fossa"crater in the north of Vulcano island, in the background it can see Lipari and Salina: the other two islands in the Aeolian archipelago.
Chapter 4
Time-space variation of volcano-seismic events at La
Fossa of Vulcano
4.1 Introduction
Three distinct areas can be recognised at Vulcano: the southern area, called Caldera del Piano, the central area, known as La Fossa crater, and Vulcanello, located in the northernmost part of the island (fig. 4.1). A magmatic body was identified by geophysical and geochemical studies at a depth of about 2–3 km below La Fossa crater (Ferrucci et al. 1991; Clocchiatti et al. 1994; Nuccio and Paonita 2001).
Since the last eruption in 1888-1890, volcanic activity has been characterised by fumarolic emanations of variable intensity and temperature, mainly concentrated at La Fossa crater.
According to the chemical and isotopic signatures, the fumarolic fluids have been interpreted as a mixture of two components whose proportions vary with time: (1) a magmatic component, which is deep and released from a magma body; (2) a hydrothermal component which is shallower and formed by the
evaporation of fluids of marine origin entering the zone near the conduits where deep hot fluids rise (Chiodini et al. 1995; Granieri et al. 2006). In particular, the magmatic component is richer in CO2, N2 and He than H2O (Chiodini et al.
1995). The development of the fumarolic field and the hydrothermal areas has significantly expanded in the last 20 years (Boyce et al. 2007).
The fumarolic fields are currently sited in different areas, as shown in fig. 4.1. Temperature increases and changes in the fumarolic gases chemistry, mainly consisting of an increase in CO2 and He flux, were observed in 1979-1981,
1985, 1996, 2004, 2005, 2006, 2007, 2008 and 2009. Such changes, mainly geochemical and geothermal anomalies, have been interpreted as an increase in the concentration of the magmatic component of the fumarolic fluid (Granieri et al. 2006). However, it is still uncertain whether these anomalies could lead to eruptions (Barberi et al. 1991; Italiano and Nuccio 1992; Bukumirovic et al. 1997; Granieri et al. 2006).
These geochemical and geothermal anomalies are often accompanied by increases in seismic energy release. However, few seismological studies have been performed at Vulcano (e.g. Blot 1971; Latter 1971; Del Pezzo and Martini 1981; Falsaperla and Neri 1986; Montalto 1994a, b). Seismic activity originating in the area of Vulcano is associated with double-couple sources and fluid dynamics that generate earthquakes and volcano-seismic events, respectively. Double-couple sources are related to the activity of tectonic structures; they typically occur in swarm-like sequences of low magnitude (generally, M≤ 2.5), and show clear P and S phases. Generally, they are clearly recorded at all the stations of the Aeolian seismic network. Conversely, the volcano-seismic events are related to fluid dynamics within the hydrothermal system at shallow depth, are characterised by poorly defined P and S phases and can only be detected in very narrow areas (Aubert and Alparone 2000). The main features of the volcano-seismic events at Vulcano, as well as their source mechanisms, are still not well known. Montalto (1994a) invokes two different processes for the volcano-seismic events: brittle fracturing of hydrothermally altered materials and resonance of the plumbing system. The first process gives
rise to the socalled N-shocks, characterised by broad-band spectra, the second to the so-called M-shocks, showing a monochromatic spectral content (Montalto 1994a).
The aim of this work is the study of the volcano-seismic events occurring at Vulcano during 2004-2009, in order to identify events with similar features and infer their source mechanisms. In addition, we analyse the time variation (if any) of the seismic events, which may provide information on the evolution of the hydrothermal system.
Fig. 4.1 Map of Vulcano island showing the location of the seismic stations used in this work.
The dashed rectangle highlights the region shown in fig. 4.11. The cross-hatched areas indicate the main fumarolic fields (Harris and Maciejewski, 2000; Diliberto et al., 2002).
4.2 Instrumental topics and data set
During 2004-2009, seismic monitoring at Vulcano was performed by a permanent seismic network (fig. 4.1) run by the Catania section of INGV. It was composed of four stations, equipped with three-component, analogue, short period (1 s cut-off period) geophones (Geotech S13) with seismic signal acquired at a sampling rate of 100 Hz. A mobile seismic network, run by the University of Catania and by the Catania INGV, was installed at the end of 2005; it comprised three digital 24-bit seismic stations, equipped with broadband Lennartz LE-3D 20 s, and was located on the northern rim of La Fossa (fig. 4.1). The seismic signal was acquired at a sampling rate of 125 Hz. Fourteen thousand and five hundred volcano-seismic events, occurring between January 2004 and December 2009, were analysed.
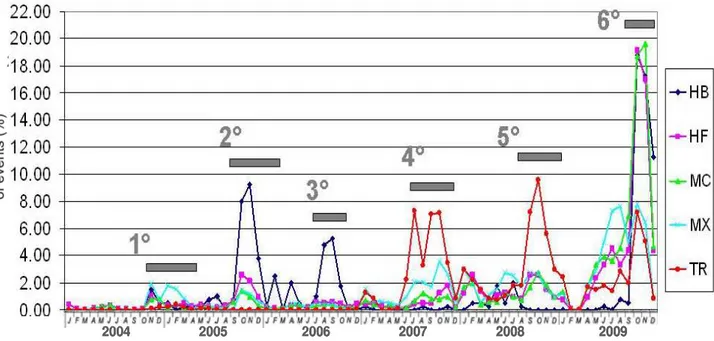
The very few double-couple earthquakes (the most powerful ones occurred in September 2005 and were located near La Fossa crater; Gambino et al. 2007) were neglected. Six increases in seismic activity (fig. 4.2a; seismic sequences) were identified during the analysed period. These sequences coincided with geochemical and geothermal anomalies and took place approximately during November 2004-April 2005, September 2005-January 2006, July-October 2006 (Diliberto et al. 2007), July-November 2007, August-December 2008 and May-December 2009 (fig. 4.2). The third seismic sequence is not as clear as the others and, as illustrated in the following paragraphs, is characterised by an increasing number of hybrid (HB) events, a type of volcano seismic event. In order to study the features of seismic events, we performed (1) spectral analysis by Fast Fourier Transform (FFT), continuous wavelet transform (CWT) and Sompi method; (2) cross-correlation analysis by a bridging technique and using the method described by Green and Neuberg (2006); (3) hypocentral location of the most powerful events.
Fig. 4.2 (a) Daily number of seismic events at Vulcano during 2004-2009. The brackets and
roman numerals at the top indicate the periods characterised by the six main seismic sequences. (b) Time variation of the temperatures and CO2 concentration at the crater
4.3 Classification
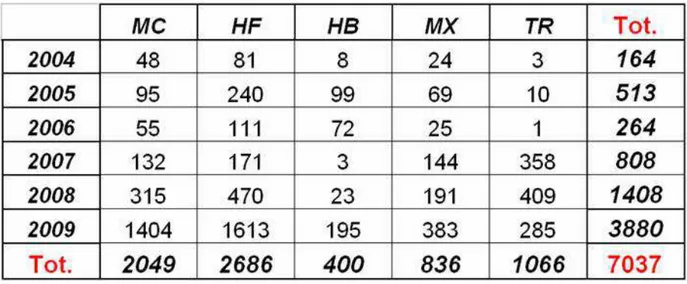
Among the roughly 14500 volcano-seismic events recorded from 2004-2009 at La Fossa of Vulcano, we selected 7037 events that exceed a specified amplitude threshold. All these events are characterised by magnitude lower than 1, and poorly defined P and S phases.
These 7037 volcano-seismic events were classified on the basis of visual inspection, spectral and frequency analyses. In particular, the time-frequency analysis was performed by means of Short Time Fourier Transform (STFT) and Continuous Wavelet Transform (CWT). While the classic Discrete Fourier Transform (DFT) is suited to stationary signals and is completely insensitive to the changes in coupling over time, the STFT and CWT are applied in order to represent signal variability in time-frequency space. The former represents a time-frequency analysis with fixed resolution, the latter transforms the signal into a multi-resolution time-scale with high frequency resolution at low frequencies and high temporal resolution at high frequencies. The simultaneous use of several time-frequency methods greatly improves the description of the recorded phenomena (Lesage et al. 2002).
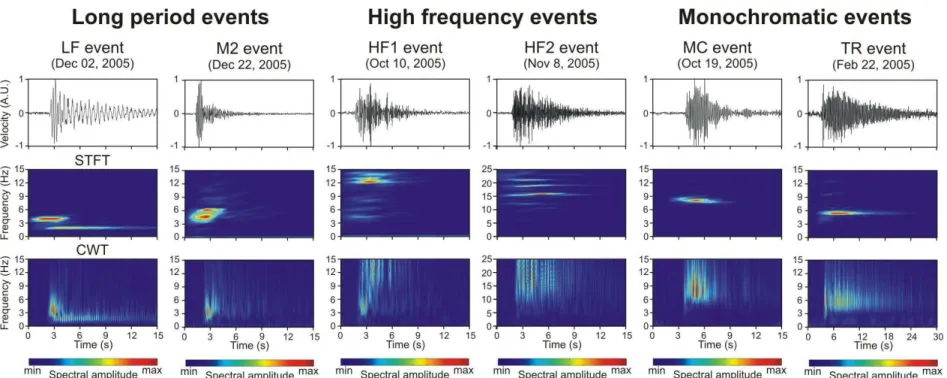
Three classes of events were recognised (fig. 4.3; Tables 4.1 and 4.2):
- Long period events, which are characterised by a spectral content mainly ranging between ~ 0.5 and 5 Hz, and are similar to the long period events observed in most volcanoes (Chouet 1996). Their waveforms are generally composed of phases with slightly different frequency following each other. Two distinct subclasses can be recognised within this class: i) hybrid (HB) events, that, similarly to the hybrid events described by Lahr et al. (1994), are characterised by a first phase with higher frequency (~ 4 Hz) and changing amplitude during the studied period, and a tail with lower frequency (~ 2 Hz); ii) mixed (MX or M2) events, characterised by a monochromatic first phase with duration of 1-2 s and frequency of 4 Hz, tail showing low amplitude and frequency ranging between 4 and 10 Hz.
- High frequency (HF) events, that are the most powerful among all the studied classes and are characterised by wide frequency range and by seismic energy between 5 and 25 Hz. Regarding their spectral content, these events resemble the typical volcano-tectonic (VT) earthquakes recorded in most of the volcanic areas and are interpreted as resulting from brittle failure of the rocks (e.g. Lahr et al. 1994). However, the emergent onset, the poorly defined P and S phases and the narrow areas where these events can be detected, make them different from VT earthquakes.
- Monochromatic (MC) events, which show a single frequency peak at 6 or 8 Hz and generally last about 10-15 seconds. Other events belonging to this class show a much longer duration (30-50 seconds) and a very slow amplitude decay (fig. 4.4a,b,c). These features make them highly similar to the “tornillos”, recorded at a small number of volcanoes, such as Galeras (Seidl and Hellweg 2003), Tongariro (Hagerty and Benites 2003), Tatun Volcano Group (Lin et al. 2005). Consequently, we also call tornillos (TR) these particular monochromatic events of Vulcano. Many different models have been proposed for the physical source of tornillos: fluid-filled cracks (Gil-Cruz and Chouet 1997; Hagerty and Benites 2003), lumped-parameter models (Julian 1994), self-excited eddy shedding and turbulent slug flow oscillations (Hellweg 2000). Moreover, according to Seidl and Hellweg (2003), tornillos can be interpreted as the free vibration response of a fluid-filled cavity to a pressure pulse (linear model) or as the initial transient leading into a tremor sequence generated by a non linear, self-excited oscillator (non-linear model) (see chapter 5).
Events belonging to high frequency and monochromatic classes showed an almost steady spectral content for their entire duration. Conversely, the long period events were characterised by successive seismic phases with different dominant frequency (fig. 4.3). It is worth noting that we did not find very long period events (characterised by period in the range 2-100 s; Ohminato et al. 1998), at least in the acquisition frequency band of the sensors (period lower than 20 s).
3
1
Fig. 4.3 From top to bottom: waveforms, Short Time Fourier Transform (STFT) and Continuous Wavelet
Transform (CWT) of examples of the classes of seismic events recorded at the vertical component of IVCR station. The STFT was obtained by splitting the seismic signal in 2.56-second-long windows with 50% overlap. The CWT was calculated with frequency resolution of 0.1 Hz.
Table 4.1 Classification scheme of the volcano-seismic events recorded at La Fossa of
Vulcano
Classes Features
Long period events HB – Hybrid events
MX – Mixed events
First phase with frequency of ≈ 4 Hz and amplitude changing during the studied period, and a tail with frequency of ≈ 2 Hz
Monochromatic first phase with duration of 1-2 s and frequency of 4 Hz, and tail showing low amplitude and frequency ranging between 4 and 10 Hz
High frequency events HF events Wide frequency range generally from 5 to 25 Hz, high values of energy
Monochromatic events MC events Single frequency peak generally equal to 6 or 8 Hz and duration mostly ranging between 10 and 15 s. A small number of MC events (tornillos) show a longer duration (30-50 s)
Table 4.2 Classification results of the volcano-seismic events recorded at La Fossa of Vulcano
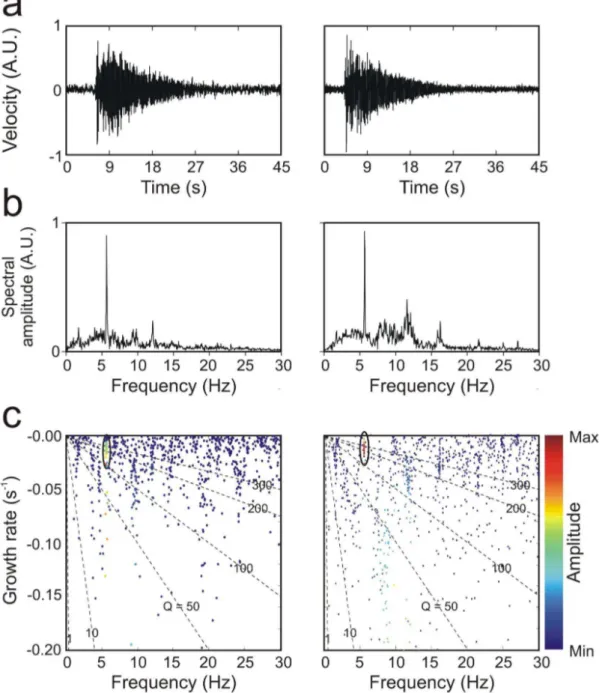
Fig. 4.4 (a) Two examples of waveforms of TR events, recorded by the vertical component of
IVCR station, and corresponding (b) STFT, obtained by splitting the seismic signal in 2.56-second-long windows with 50% overlap, (c) amplitude spectra and (d) f-g diagrams, obtained for all the trial AR orders (4-60). Dot colours indicate the amplitude values of the wave elements (see colour scale). The dashed lines represent lines along which the quality factor (Q) is constant. Clusters of points (encircled with solid ellipses) indicate dominant spectral components of the signal, scattered points represent noise.
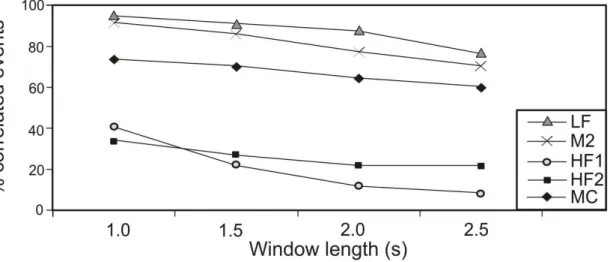
We performed cross correlation analysis on the events of each class recorded by the vertical component of IVCR station, by using the bridging technique (Barani et al. 2007). If two pairs of correlated events, (A, B) and (B, C) share a common event (B), then all the events are attributed to the same family, even if the cross correlation coefficient between A and C is lower than the chosen threshold. Therefore, event B represents the “bridge event” between these couples. The cross correlation function was calculated on windows with length ranging from 1 to 2.5 s, and beginning with the onset of the events. The events of each class and subclass were grouped into families by a threshold value of cross correlation coefficient. Then, for each threshold value the total number of events composing all the families with at least 2 events was taken into account and the percentage with respect to the total number of the events of the class and subclass (in the case of MX and HB events) was calculated. Multiple trials were performed with values of cross correlation threshold ranging from 0.7 to 0.9 with step of 0.05. This procedure was followed to evaluate the repeatability and stationarity of the seismic source. Some results of this analysis are reported in fig. 4.5. We observed that the events exhibit different degrees of waveform similarity, according to their class or subclass. In fact MC, HB and MX events showed a high degree of waveform similarity inside each group, whereas HF events were characterised by very variable waveforms.
Fig. 4.5 Percentage of correlated HB (LF) , MX (M2), HF and MC events versus window
4.4 Time variations
We investigated the time variations of the monthly number, waveform and spectral content of the events belonging to the seismic classes.
The monthly number of events was calculated for each class (and subclass in the case of MX and HB events). Then this number was transformed into a percentage with respect to the total number of events belonging to the same group (fig. 4.6). For example, in November 2005, 37 HB events were recorded; since we detected 400 HB events during the whole 6-year-long period, the percentage of HB events during November 2005 was 9,25%. This time distribution suggests that the number of events of all the classes increases during the first and second seismic sequences, while the third sequence is characterised by an increase only in the number of the HB events. Moreover, taking into account the six-year-long investigated period, HB events were recorded for the first time during the first seismic sequence, disappeared in the fourth and fifth seismic sequence and reappear at the end of 2009. Moreover, it is worth noting that while many TR events were observed in 2007-2009, only 15 TRs were recorded during the previous three years, 2004 – 2006. This topic will be analyzed in detail in chapter 5.
2004 2005 2006 2007 2008 2009
2004 2005 2006 2007 2008 2009
2004 2005 2006 2007 2008 2009
Fig. 4.6 Monthly distribution of HB, MX, HF, MC and TR events. Numbers and gray
As a second step, we studied the time evolution of the waveform by using the cross correlation function (Green and Neuberg 2006). This method entails the following steps: i) the signals, recorded by the vertical component of station IVCR, were filtered according to the spectral features of the considered class; ii) a cross correlation matrix was obtained for each class by using 5-second-long windows of signal, beginning with the onset of the events; iii) a master event was selected as the event with the largest number of values of cross correlation coefficient above the threshold of 0.7; iv) an average waveform of the family was found by stacking all events that were well-correlated with the master event (cross correlation coefficient > 0.7); v) this stacked waveform was then cross-correlated with the original seismic records, and all events with a cross correlation coefficient greater than the threshold were grouped into a waveform family; vi) the steps iii)-v) were repeated until the entire matrix was classified into distinct groups. In this procedure, the overlap between clusters was not allowed. Once an event was assigned to a given group, it was removed from the correlation matrix. Unlike the aforementioned bridging technique, this method allows identifying of gradual waveform variations because of the lack of “bridge events”.
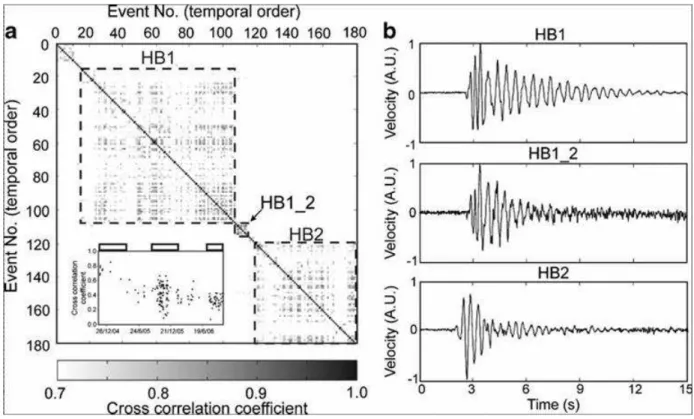
The most striking waveform variations were observed for HB events, as shown by the cross correlation matrix in fig. 4.7a. In particular, two sequential families of HB events (hereafter called HB1 and HB2) were found, with a third smaller family (HB1_2) briefly occurring between the two main families. The variation from HB1 to HB2 occurred at the end of the second seismic sequence (January 26, 2006). Family HB1 was composed of events characterised by a monochromatic first phase with duration of 1-2 s and frequency of 4 Hz, and a tail showing frequency of 2 Hz and duration of about 10 s. Family HB2 comprises events with frequency ranging between 2.4 and 3.1 Hz. Families HB1 and HB2 mainly characterised the second and third seismic sequences, respectively. Family HB1_2 was noted in the period between the occurrence of HB1 and HB2. In fig. 4.7a inset, the time distribution of the cross correlation coefficient, obtained by comparing the first HB event with all the other HB
events, is reported. This distribution suggests that the time variation of the waveform was gradual and mainly occurred during the periods between the seismic sequences. It is worth noting that this cross correlation analysis was also performed by using 8-second-long windows and gave the same results. With the aim of highlighting the average features of the three families, we obtained a stacked waveform for each family (fig. 4.7b).
Fig. 4.7 (a) Correlation matrix for HB events showing the three families (indicated as HB1,
HB1_2 and HB2) following each other. The inset in the lower left corner indicates the time variation of the cross correlation coefficient values, obtained by comparing the first HB event with all the other HB events (the top empty rectangles indicate the periods characterised by the seismic sequences). (b) Waveforms obtained by stacking the correlated events.
In order to study the time variation of the spectral features of MC, HF, HB and MX events, we performed two different frequency domain analyses: FFT and Sompi method (Kumazawa et al. 1990, and references therein). With FFT we calculated one spectrum for each event by using 10-second-long windows, whose onset coincided with onset of the event. Then, we normalised and averaged the spectra of the events occurring during 10-day-long time spans and
the obtained average spectra were visualised as pseudo-spectrograms. By using this method, we noted that HB events showed the most striking time variations of the spectral content. As depicted in the pseudo-spectrogram of fig. 4.8a, the HB events were composed of two main components at frequencies at ~ 2 and 4 Hz. It is worth noting that these two components gradually shifted toward higher frequencies during the two 6-month-long periods between the seismic sequences, and remained steady in the seismic sequence intervals. Moreover, the spectral amplitude of the first phase at about 4 Hz, the dominant component of HB events observed during the first sequence, diminished during the second sequence and almost disappeared by the third.
Many types of volcano-seismic signals, such as the long period events observed at most volcanoes, are characterized by simple waveforms and consist of a superposition of decaying harmonic oscillations, which may represent the impulsive response of a resonator system (Nakano and Kumagai 2005). In order to obtain information about the characteristic properties of the resonator systems and their variations, we studied the damping features of the volcano-seismic events at Vulcano by Sompi analysis. This technique was applied on the volcano-seismic events recorded at different volcanoes and highlighted time variations of the quality factor and frequency of these events, that were interpreted as resulting from changes in fluid composition within the plumbing system (e.g. De Angelis and McNutt 2005; Patanè et al. 2008) or changes in geometry of fluid-filled cracks (e.g. Kumagai et al. 2002). In this method of spectral analysis based on an autoregressive (AR) model, a signal is deconvoluted into a linear combination of coherent oscillations, called wave elements, with decaying amplitudes and additional Gaussian white noise. In this approach we define a complex frequency fc = f – ig where f is the frequency, g is the growth rate or gradient (that quantifies the growth/decay of the wave
element amplitude) and i is −1 (Kumazawa et al. 1990). The quality factor Q is then given by –f/2g. Generally, in order to represent a set of complex frequencies, they are plotted on a 2D-plane with f and g axes, called f-g
diagram. Since the Sompi method also provides information on the amplitude of the wave elements (Kumazawa et al. 1990), we can add this parameter in the f-g diagram by using a colour scale for the dots (see figs. 4.9b and 4.4d). Widely scattered wave elements in the plot, showing low amplitude values, are considered noise, while densely populated wave elements on the theoretical frequency lines (“iso-frequency” lines) and characterised by high amplitude are considered dominant spectral components of the signal (Hori et al. 1989). This analysis was applied only to long period events (both MX and HB events) and TR events because the other events did not show tails composed of a superposition of simple decaying sinusoids - the necessary condition to calculate the complex frequency. The complex frequencies of the wave elements for AR orders ranging from 4 to 60 were calculated. The spectral content evolution of the HB events, highlighted by the pseudo-spectrogram in fig. 4.8a, is confirmed by the frequency values obtained by Sompi method (fig. 4.8b). The Sompi analysis also indicates that the quality factor of these events changed, as shown for unfiltered signals (fig. 4.8c) and signals filtered below 3 Hz (fig. 4.8d). In fact, a decrease of quality factor, well evident especially for the signal component at about 2 Hz (from 28±15 to 11±6, fig. 4.8d), took place between the second and the third seismic sequences.
FFT and Sompi analyses were also applied on the stacked waveforms obtained for the HB1, HB1_2 and HB2 families reported in fig. 4.7b. The spectra (fig. 4.9a) and the f-g diagrams (fig. 4.9b) confirmed the aforementioned time variations: progressive shift of the frequency peaks toward higher frequency, gradual amplitude decrease of the signal component at 4 Hz and decrease of the quality factor of the signal component at about 2 Hz. Figures 4.7b, 4.8 and 4.9 show that Family HB1_2 was characterised by intermediate features between families HB1 and HB2.
Fig. 4.8 (a) Normalised pseudo-spectrogram of the HB events recorded at the vertical
component of IVCR station. Each spectrum was calculated by averaging the spectra of the HB events occurring during 10-day-long interval. The black rectangles, located inside the plot, show time intervals with no HB events. The top empty rectangles and roman numbers indicate the periods characterised by the seismic sequences. (b) Peak frequency of the vertical component of the seismic signal of IVCR station, obtained by Sompi method for autoregressive (AR) orders ranging between 4 and 60. (c-d) Quality factor of the vertical component of the seismic signal of IVCR station, not-filtered and filtered below 3 Hz, respectively, obtained by Sompi method for AR orders ranging between 4 and 60.
Fig. 4.9 (a) Amplitude spectra of the stacked waveforms of HB1, HB1_2 and HB2 families.
The values in the plots indicate the frequency of the highest spectral peak. (b) f-g diagrams obtained for all the trial AR orders (4-60). Dot colours indicate the amplitude values of the wave elements (see colour scale). The dashed lines represent lines along which the quality factor (Q) is constant. Clusters of points (encircled with solid ellipses) indicate dominant spectral components of the signal, scattered points represent noise.
A slight variation of the spectral content was also noted for the MX events at the end of the first seismic sequence (fig. 4.10): a shift of the spectral content toward higher frequency occurred without any significant changes of the quality factor.
Finally, we focused on TR events that were characterised by frequency peaks at about 6 or 8 Hz and much higher quality factor values than the other analysed events (150-200 on average), as evidenced by the slower amplitude decay (fig. 4.4d).
Fig. 4.10 (a) Normalised pseudo-spectrogram of the MX events recorded at the vertical
component of IVCR station. Each spectrum was calculated by averaging the spectra of the MX events occurring during 10-day-long interval. The black rectangles, located inside the plot, show time intervals with no MX events. The top empty rectangles and roman numbers indicate the periods characterised by the seismic sequences. (b-c) Peak frequency and quality factor of the vertical component of the seismic signal of IVCR station, obtained by Sompi method for AR orders ranging between 4 and 60.
4.5 Location
In order to locate the studied volcano-seismic events we used the HYPOELLIPSE program (Lahr 1989) using the velocity model from Falsaperla et al. (1985). We selected about 60 locations of events belonging to different classes on the basis of: high signal to noise ratio, error lower than 1 km and azimuth gap lower than 190°.
The space distribution of these events is shown in fig. 4.11. We noted that the seismic sources are mainly clustered below La Fossa crater, in the depth range 0.3-1.7 km b.s.l. Most of the events are clustered at depths 0.5-1.1 km b.s.l. Moreover, different space distribution can be distinguished for different groups of events. In particular, HB events are located south-east of La Fossa and aligned about NE-SW, as also confirmed by high precision locations (Gambino et al. 2009). Their focal depth is constrained in the narrow range 0.6-0.8 km b.s.l. HF and MX events are located on the western-central sector of the crater. Conversely, MC events are generally located south of La Fossa, with the exception of TR events that are clustered in a small volume to the north-west. The mean horizontal and vertical errors are about 500 m. Even after taking into account these error values, it should be noted that locations remain constrained inside La Fossa area.
Fig. 4.11 Hypocentral locations of some HB (LF), MX (M2), HF, MC and TR events (see
legend in the upper left corner of the map). The dashed black lines in the map indicate shallow fractures and normal faults (Mazzuoli et al., 1995).
4.6 Discussion and conclusions
Reconstructions of the eruptive histories of many volcanoes have shown that inactive periods of hundreds of years between eruptions are not uncommon. This is particularly true for highly explosive volcanoes (Scarpa and Gasparini 1996). Therefore, Vulcano, whose last eruption occurred in 1888-1890, is to be considered potentially active and dangerous for the local population. Moreover, the volcanic risk in this area increases greatly in summer, when the number of inhabitants swells from a few hundreds to several thousands.
During January 2004 - December 2009, six seismic sequences occurred at La Fossa, Vulcano, at the same time as anomalous increases of fumarolic CO2 flux
and temperature, as well as variations of other geochemical parameters were observed (Diliberto et al. 2007) (fig. 4.2). Such geochemical and geothermal anomalies are interpreted as an increase of the deep magmatic component constituting a portion of the hydrothermal fluids (Granieri et al. 2006). The six anomalies, the corresponding seismic sequences and the short time intervals separating them, suggest the importance of the analysed period in the recent history of Vulcano. In light of this, we made a detailed investigation into the volcano-seismic events recorded during 2004-2009. On the basis of the spectral content and waveforms, these events were grouped into three classes (Table 4.1): long period events, comprising HB and MX events; high frequency (HF) events and monochromatic (MC) events. It is also worth noting that other events belonging to monochromatic class were recorded. These events, that show a very long duration (30-50 seconds), are called tornillos, similarly to the volcano-seismic events with the same peculiar long duration recorded in other volcanoes. In particular, long period and monochromatic events are characterised by i) narrow spectrum with sharp dominant spectral peaks, ranging between 2 and 8 Hz, and ii) high degree of waveform similarity, suggesting stationary, non-destructive processes. These features, together with the prevailing theories on the source of long period events and tornillos (e.g. Chouet 1996; Aoyama and Takeo 2001; Kumagai et al. 2002; Molina et al.
2008), suggest the resonance of hydrothermal fluid-filled cracks or conduits, or simply fluid flow inside them, as the source mechanism for long period and monochromatic events of Vulcano. The analysed long period events are characterised by the presence of successive seismic phases with different frequency content (fig. 4.3). This suggests that the triggering mechanism linked to the first phase is different from the resonance process causing the second one (Battaglia et al. 2003; Caplan-Auerbach and Petersen 2005). For the HB events, the first phase may be related to the fluid pressure exceeding the mechanical resistance of obstruction inside the hydrothermal fluid-filled cracks or conduits; in fact, hydrothermal activity at Vulcano gives rise to processes of self-sealing and clogging of the fumarolic system (Montalto 1994b). Then, the second phase is caused by the consequent resonance of the plumbing system (Montalto 1994b). On the basis of the source mechanisms of these two phases the HB events share the same source mechanisms as hybrid events described by Lahr et al. (1994). The decrease in amplitude of the first phase of the HB events at ~ 4 Hz, observed during the studied period, suggests a gradual decrease of effectiveness of the self-sealing and clogging processes. On the other hand, the MX events, that lack a second seismic phase with lower frequency and amplitude comparable to the first phase, may be due to unblocking process resulting in weaker resonance. The significantly longer duration of TR events than long period and the other MC events, also confirmed by the very high quality factor values (fig. 4.4d), may be due to different fluid composition or to different aspect ratio of the resonating crack, generating these seismic events. In particular, the higher quality factor of the TR events could be attributed to the lower gas fraction causing oscillations with longer duration, as shown by Kumagai and Chouet (2000), or to a crack having smaller aspect ratio (Kumagai and Chouet 2001). However, the study of TR events at Vulcano deserves detailed analyses on a larger dataset, which will be the object of future work. Focusing on high frequency events, their main features are i) the wide frequency content, generally ranging from 5 to 25 Hz, similar to VT earthquakes, and ii) the low degree of waveform similarity, suggesting destructive source
mechanisms. This, together with the interpretation of the source mechanisms of VT earthquakes (e.g. Lahr et al., 1994), would suggest that fracturing processes of the rocks surrounding the hydrothermal system could be the source for the high frequency events (as also proposed by Montalto 1994a).
In view of these source processes, the time-relationship between geochemical and geothermal anomalies and seismic sequences can be inferred. The increasing magmatic component of the hydrothermal fluids during the anomalies can cause both the increase of the pore pressure within the volcanic system and the increase of the fluid flux rising up. Then, increased pore pressure gives rise to increasing fracturing processes, while increased fluid flux favours the resonance and vibration processes in cracks and conduits (fig. 4.12a). This model justifies the occurrence of the seismic sequences at the same time as the geochemical and geothermal anomalies.
Most of the volcano-seismic events affect a small volume (about 0.5 km3) located below La Fossa crater at depths ranging between 0.5-1.1 km b.s.l. (fig. 4.11). Furthermore, the space distribution of the HB event locations (fig. 4.11), aligned roughly NE-SW, as also confirmed by high precision locations (Gambino et al. 2009), is consistent with shallow fractures and normal faults, located in the inner sectors of the island, where intense fumarolic activity is concentrated (Mazzuoli et al. 1995).
The possible time variation of the features of the seismic events was investigated, and only HB events exhibited marked changes. In particular, they showed gradual shift toward higher frequencies and lower quality factors (figs. 4.8, 4.9). Time variations of the spectral features of volcano-seismic events have been observed in several volcanoes around the world, such as Mt. Etna (Patanè et al. 2008; Cannata et al. 2009), Galeras (Torres et al. 1996), Kusatsu-Shirane (Kumagai and Nakano 2005), Mt. Spurr (De Angelis and McNutt 2005) and Tungurahua (Molina et al. 2004). Such changes are generally interpreted to result from variations in the geometry of the resonating crack, which is the most appropriate geometry for mass transport condition beneath a volcano (e.g. Chouet 1986, 1988), and/or the features of the fluid filling the cracks. In