R E S E A R C H A R T I C L E
Open Access
Neural responses to a modified Stroop
paradigm in patients with complex chronic
musculoskeletal pain compared to matched
controls: an experimental functional
magnetic resonance imaging study
Ann M. Taylor
1*, Ashley D. Harris
2,3,4, Alice Varnava
5,6, Rhiannon Phillips
7, Owen Hughes
8, Antony R. Wilkes
1,
Judith E. Hall
1and Richard G. Wise
2Abstract
Background: Chronic musculoskeletal pain (CMSKP) is attentionally demanding, complex and multi-factorial; neuroimaging research in the population seen in pain clinics is sparse. A better understanding of the neural activity underlying attentional processes to pain related information compared to healthy controls may help inform diagnosis and management in the future.
Methods: Blood oxygenation level dependent functional magnetic resonance imaging (BOLD fMRI) compared brain responses in patients with CMSKP (n = 15) and healthy controls (n = 14) while completing a modified Stroop task using pain-related, positive-emotional, and neutral control words.
Results: Response times in the Stroop task were no different for CMSKP patients compared with controls, but patients were less accurate in their responses to all word types. BOLD fMRI responses during presentation of pain-related words suggested increases in neural activation in patients compared to controls in regions previously reported as being involved in pain perception and emotion: the anterior cingulate cortex, insula and primary and secondary somatosensory cortex. No fMRI differences were seen between groups in response to positive or control words.
Conclusions: Using this modified Stroop tasks, specific differences were identified in brain activity between CMSKP patients and controls in response to pain-related information using fMRI. This provided evidence of differences in the way that pain-related information is processed in those with chronic complex musculoskeletal pain that were not detectable using the behavioural measures of speed and accuracy. The study may be helpful in gaining new insights into the impact of attention in those living with chronic pain.
Keywords: Neuroimaging, fMRI, Complex chronic pain, Musculoskeletal, Stroop
* Correspondence:[email protected]
1Department of Anaesthetics, Intensive Care and Pain Medicine, Institute of Infection and Immunity, Cardiff University, Cardiff CF14 4XN, Wales, UK Full list of author information is available at the end of the article
© 2016 Taylor et al. Open Access This article is distributed under the terms of the Creative Commons Attribution 4.0 International License (http://creativecommons.org/licenses/by/4.0/), which permits unrestricted use, distribution, and reproduction in any medium, provided you give appropriate credit to the original author(s) and the source, provide a link to the Creative Commons license, and indicate if changes were made. The Creative Commons Public Domain Dedication waiver (http://creativecommons.org/publicdomain/zero/1.0/) applies to the data made available in this article, unless otherwise stated.
Background
Chronic musculoskeletal pain (CMSKP) poses a major clinical, social and economic problem [1, 2] and can be complex to manage [3]. Pain interrupts, distracts, and interferes with cognitive functioning [4] because it grasps attention [5]. Attentional bias to parelated in-formation can lead to mood and disability problems [6] and can constrain application of cognitively based treat-ments [7] and coping strategies [8].
Neuroimaging has improved our understanding of the neural processes underlying cognition, emotion and con-text that influence pain perception [9–11]. The majority of fMRI studies have focused on acute, experimentally-induced pain in healthy volunteers, where the subjective meaning of pain may be different in those with CMSKP [12, 13]. Relatively little is known about the neural mechanisms underlying an attentional bias in patients with CMSKP.
The Stroop paradigm focuses on the fact that cognitive interference occurs when the processing of one stimulus feature impedes the simultaneous processing of a second stimulus and is a well established paradigm for assessing attentional bias [14, 15]. It has been used in chronic pain populations to establish the degree to which patients at-tend to pain-related information [14, 16–18]. However not all studies show an attentional bias to pain-related and negative interference words and the specificity of ef-fects to chronic pain (versus healthy controls) has been debated [19]. It has been proposed [20] that CMSKP overrides the interference effects in the Stroop task; pain demands attention, competing attentional demands are less important. Previous anxiety research has shown that positive words (describing a state that is desired but feared will never be achieved) provide as much interference as negative words (threatening words) and these interference effects are attributable to the extent to which the words used are related to the likely emo-tional concerns of patients [21]. Therefore, positive words may be useful in CMSKP studies to address pre-vious debates.
To our knowledge, the only neuroimaging study to use a Stroop paradigm in a clinical pain population to date [22] examined patients with temporomandibu-lar disorders matched to healthy controls. The pa-tients had sluggish reaction times for all Stroop tasks and compared to controls, patients showed increased task-evoked responses in brain areas implicated in at-tention, emotional processes, motor planning and per-formance, and activation of the default-mode network. However, patients had mild to moderate and/or inter-mittent pain, and extrapolating these results to the specialist pain clinic population of CMSKP, with severe and complex pain problems, may not be appropriate.
The present study aims to examine the attentional, be-havioural and activation differences between patients with complex CMSKP (i.e. those requiring specialist management in secondary care) and healthy controls using a Stroop paradigm. Using this paradigm, we will investigate whether (a) there is a general deficit in atten-tional control (as assessed by the modified Stroop) be-tween patients and controls, (b) there is a specific attentional bias for pain-related stimuli (as opposed to positive emotional or neutral stimuli), (c) there are BOLD signal differences in patients compared to con-trols in pain and emotion related brain regions in re-sponse to the Stroop task including primary (SI) and secondary (SII) somatosensory cortices, prefrontal cor-tex, insula and anterior cingulate cortex (ACC) [23, 24].
Methods
Participants
With Dyfed Powys Research Ethics Committee approval, thirty participants were recruited and provided informed written consent for the study. Fifteen patients were re-cruited from a pain management program and a multi-disciplinary pain clinic in South Wales and 15 matched healthy (pain-free) controls were recruited from a volun-teer panel. Criteria used to match the patient with the healthy control were age, gender, educational level at-tainment, marital and work status. All participants re-ceived small honorarium for their participation to cover travel costs and refreshments.
Patients had been assessed by a pain specialist after primary care management and this had proven ineffect-ive due to the complex nature of the patient’s condition. Patients had been deemed suitable for specialist pain treatment and were awaiting this treatment. Criteria for patient inclusion in the study were: a physician-diagnosis of chronic non-malignant pain (International Association for the Study of Pain, [25] and pain had to be due to osteoarthritis. Each patient had to have an average pain score of 50 and above on a numerical rating scale of 0– 100 (‘No’ – ‘Worst Possible Pain’) over a three-month period prior to enrolment and to be suffering from con-tinuous pain. Patients were only included in the study if lying supine did not specifically evoke pain and if they expected to be comfortable lying in the scanner. An additional criterion for all participants was English as their first language.
Exclusion criteria for all participants were serious metabolic, rheumatoid, vascular or diagnosed psychiatric disorders, dyslexia or unable to read written English, in-ability to give informed consent, contraindications to MR scanning and claustrophobia. Patients were allowed to continue on their prescribed medication as long as there had been no changes made to the dose over the preceding 3 month period.
Questionnaires and assessment Pain
Within a month prior to scanning, participants were asked about their analgesic medication and intensity of pain. Patients rated their current pain on a numerical rating scale (NRS) from 0 (no pain) to 100 (worst pos-sible pain). Using the same scale, they also rated their worst pain, least pain, pain intensity over the last week and last 3 month period, and the degree to which the pain interfered with activities of daily living over the pre-vious week. The 101-point (i.e. 0–100) NRS of pain in-tensity is recommended as a core outcome measure in clinical trials of chronic pain [26]. Prior to scanning, par-ticipants were again asked about their current pain to ensure that no significant changes had been experienced over the preceding month.
Psychological distress
The Hospital Depression and Anxiety Scale (HADS) [27] was used as a unidimensional measure of psychological distress [28]. HADS is a fourteen item scale, seven relat-ing to anxiety and seven to depression. In line with the recommendation of Martin et al. [29], we adopted of a global total score of psychological distress as an alterna-tive to the original two subscale structure in this study.
Experimental paradigm
Pain-related (PR) and positive-emotional (PE) Stroop task development
The Stroop task [30] is a well-established paradigm for assessing attentional bias [14, 15]. The task used in this study was developed from the emotional counting Stroop where participants are asked to count the num-ber of words displayed [17, 22, 24]. This paradigm is suitable for block-design fMRI studies and pain research [31, 32]. An emotional Stroop paradigm is designed with psychopathology in mind and therefore the words used as stimuli consist of items related to a particular diag-nosed condition as well as more generally emotionally valenced words that are implemented as a comparison condition to reveal the disorder-specific nature of any observed Stroop effect [31]. It would be anticipated that increases in reaction times to disorder-specific versus general-emotional or neutral words would be expected to be in the patient population. Such differences would not be expected, or would be observed to a lesser extent, in healthy participants to whom the words would be less salient.
Pain-related words (affective and sensory) from the McGill Pain Questionnaire (MPQ) [33] (PRStroop) and a list of words that represented positive emotional states (e.g. ‘confident’, ‘motivated’, ‘able’) (PEStroop) were rated for salience in a pilot study (20 patients with CMSKP and 20 pain-free controls), none of whom were involved
in the primary imaging study. Patients were asked to rate the words that best described their pain (affective and sensory pain words, 0 ‘does not describe my pain’, 1 ‘mildly accurate description of my pain’, 2 ‘moderately accurate description of my pain’, 3 ‘exact description of my pain’), and these were ranked from the highest scor-ing down to the lowest scorscor-ing across the patient group. The positive emotional words were similarly rated but by both patients and the controls (0 ‘does not describe how I feel’ to 3 ‘exact description of how I feel’) and these were scored by ranking those that scored highest for the control group and lowest for the patient group.
The decision to use positive emotional words rather than negative ones was based on the study by Mathew and Klug [21] who found that positive emotional words caused as much interference with Stroop performance in anxious patients as negative words. Given the inconsist-encies in negative word use in previous Stroop studies [18], it was decided that we would examine positively valenced words in the current study. The top 16 words from each word group were used in the imaging study (see Table 1).
Positive emotional, sensory pain-related, and affective pain-related (collectively ‘interference’) words were then matched with neutral words (household objects) based on how often they were used in the English language, word length, and the number of orthographic neigh-bours (the number of words that are similar to the ac-tual word used after changing a letter) using the English Lexical Project [34] database. Quality of matching was confirmed with statistical analysis (Mann Whitney U test was performed given that analyses were undertaken on a word-group level) which demonstrated no statistically significant differences between the control and interfer-ence words.
Imaging paradigm for PRStroop/PEStroop
The implemented protocol was based on the research by Whalen and colleagues [31]; who originally validated the emotional counting Stroop for fMRI investigations. As the original emotional paradigm was not pain specific, this led to the development of the PRStroop and PES-troop in the current study. On each trial, participants viewed sets of one to four identical words on a screen and were instructed to report the number of words dis-played (see Fig. 1).
The correct answers were always 1, 2, 3, or 4. Subjects were instructed,‘work as quickly as possible, but do not sacrifice accuracy for speed, and do not blur your vision in an attempt to make the task easier – keep the words in sharp focus’. Subjects made their response using two response boxes, one held in each hand. Subjects used their middle and index finger of their left hand when their response was 1 and 2 respectively, and the index
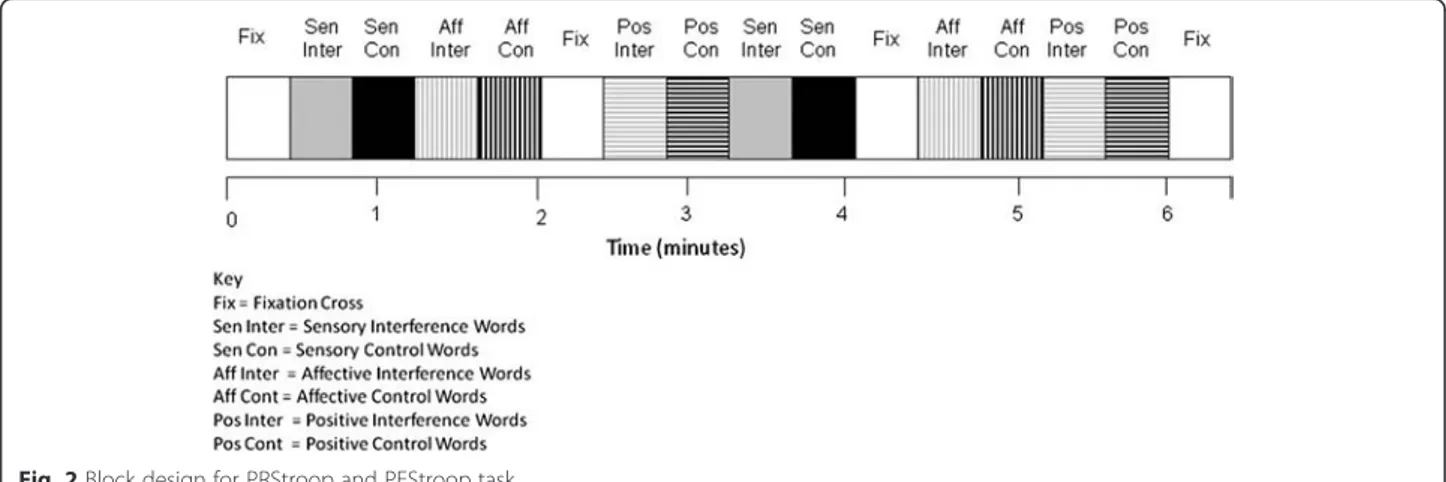
and middle finger of their right hand when their re-sponse was 3 and 4, respectively. Each trial lasted 1.5 s and there were 16 trials in a 24 s block. Each run in-cluded 16 blocks, of which there were 2 blocks for each word-type, 2 blocks for each corresponding control word set and four fixation-cross (rest) blocks (24 s duration) presented on the screen at the beginning and end of both runs and twice within a run (Fig. 2). A block con-sisted of one word type and the word type and appear-ance was randomized and counterbalappear-anced across subjects, within runs and across runs and subjects. Sub-jects completed two runs of the combined PRStroop/ PEStroop during MR imaging. Each run lasted 414 s so the whole session was less than 15 min, with a short break between the two runs.
Imaging paradigm
Prior to scanning, subjects completed a 96 s practice version of the task within a realistic mock scanner. This was to familiarize subjects with the tasks and to reduce
anxiety and fear for those that had not been in a scan-ner previously. All words used in the practice session were different to those presented in the scanning
ses-sion. Responses from the training session were
reviewed to ensure that the subject understood the task.
Imaging was performed on a 3 T MRI system (HDx, General Electric Healthcare, Waukesha, Wisconsin, USA) using an 8-channel receive-only head coil. Functional MRI data were acquired with a gradient-echo, echo-planar imaging sequence, scanning param-eters were: repetition time (TR)/echo time (TE) = 3000 ms/35 ms, 20.5 cm field of view, acquired on a 64 x 64 matrix with 53 contiguous 3.2 mm slices. Each run consisted of 138 repetitions. For anatomic localization, a T1-weighted, three-dimensional fast-spoiled gradient echo acquisition was performed, with
a voxel resolution 1x1x1 mm3 (scanning parameters
included: TR/TE = 7.8/3 ms, 450 ms inversion time) for each participant.
Table 1 Final word list for Stroop study
Interference block Control block Interference block Control block Interference block Control block
Sensory Interference (Sen Inter) Sensory Control (Sen Con) Affective Interference (Aff Inter) Affective Control (Aff Con) Positive Interference (Pos Inter) Positive Control (Pos Con)
1 aching 1 kettle 1 tiring 1 funnel 1 lively 1 fridge
2 tingling 2 armchair 2 torturing 2 saucers 2 comforted 2 lampshade
3 penetrating 3 bookshelves 3 exhausting 3 letterbox 3 liberated 3 calendars
4 hurting 4 ceiling 4 wretched 4 shelves 4 outgoing 4 cabinet
5 tender 5 plates 5 vicious 5 bucket 5 robust 5 ladder
6 pulsing 6 balcony 6 nagging 6 bedding 6 rested 6 sponge
7 stabbing 7 cupboard 7 sickening 7 polishing 7 cheerful 7 textiles
8 cramping 8 carpeted 8 agonising 8 dispenser 8 optimistic 8 appliances
9 tearing 9 laundry 9 dreadful 9 boarding 9 peaceful 9 painting
10 pressing 10 calendar 10 piercing 10 bathroom 10 enjoying 10 bedroom
11 wrenching 11 radiators 11 radiating 11 barometer 11 contented 11 bookcase
12 burning 12 glasses 12 intense 12 mirrors 12 relaxed 12 barrels
13 lacerating 13 tablecloth 13 troublesome 13 screwdriver 13 enthusiastic 13 refrigerator
14 throbbing 14 fireplace 14 miserable 14 fencing 14 achieving 14 container
15 sharp 15 chair 15 annoying 15 clothing 15 healthy 15 crystal
16 heavy 16 frame 16 killing 16 surface 16 capable 16 license
Analysis
Behavioural data
To test for differences in Stroop reaction times (RTs), a repeated-measures analysis of variance (RM-ANOVA) was used. The dependent variable was the RT and the fixed factor was the study group (CMSKP vs. healthy control). Run 1 and run 2 were analyzed separately to test for habituation; a comparison was undertaken be-tween the two runs looking for statistically different re-sponse latencies. The number of accurate rere-sponses was compared between groups (CMSKP vs. healthy control) using independent t-tests. Participants were judged to be responding accurately if the number pressed on the button box corresponded to the number of words presented on the screen. Significance was set at P-value of less than 0.05. Statistical analysis was per-formed using SPSS software version 16.0 for Windows (SPSS, Chicago, Illinois, USA).
Image analysis
Analysis of BOLD data was performed using FEATv5.98 (FMRI Expert Analysis Tool), part of FSL (FMRIB's Software Library, www.fmrib.ox.ac.uk/fsl). The func-tional data for each subject was motion corrected (MCFLIRT [35]) and field maps were processed using PRELUDE + FUGUE [36, 37] to correct for field distor-tions in the functional data. Registration to each sub-ject’s high resolution structural image was performed using FLIRT [35, 38] and registration to standard space was then performed using FNIRT nonlinear registration [39]. Data was smoothed spatially with a Gaussian ker-nel with a FWHM of 5 mm and filtered with a highpass temporal filter (cut off of 100 s) and the data was de-meaned on a voxel-by-voxel basis across the time course. At the voxel level, the signal was linearly mod-eled (FILM-FMRIB's Improved Linear Model) with autocorrelation correction [40].
Data were analysed at three levels:
1. Data were initially analyzed at the individual subject level for each run, modelling data as the convolution of the word block with a haemodynamic response function (a gamma-variate).
2. A second-level, fixed effects analysis was performed to combine the two runs for each subject.
3. A third level, mixed effects analysis was performed to indicate differences between patients and control groups. Two third level analyses were performed, one including HADS as a covariate as suggested in a previous Stroop study [41] and one without the inclusion of HADS.
Each interference word group (sensory pain, affective pain and positive emotional) was compared with the corresponding control word group. The affective and sensory interference words were also examined when combined together to reflect the way the McGill Ques-tionnaire is used clinically, as the word groups are not separated to provide a final score [33]. Combining of scores has been undertaken in previous Stroop research [20, 42]. For all analyses, statistic images were thre-sholded using clusters determined by a Z > 2.3 and clus-ter corrected (Family Wise Error) at a significance threshold of p = 0.05 [43]. FLAME [44] was used for the higher level analysis and examined the affective and sen-sory words which formed the PRStroop and positive words which formed the PEStroop. FSL was used to view the statistical parametric maps and the areas of BOLD signal differences were identified by using the Harvard-Oxford cortical and subcortical atlases.
Results
Demographic data and questionnaires
Twenty nine participants were scanned (5 male in the patient group, 4 in the control, 20 female, 10 in each group), age range 25 to 83 years old, including 15 pa-tients with pain and 14 age, gender and educational level
attainment-matched controls. One control subject was unable to tolerate being in the scanner and withdrew from the study. No patient complained of increased pain during the scanning period. Pain scores and HADS were compared between groups with a Mann–Whitney U test. As expected, patients and controls differed in pain scores and patients median current numerical rating score was 60 (range 40 – 70) (0 – ‘no pain’, 100 ‘worst possible pain’). The HADS illustrated that patients had more psychological distress compared to controls (see Table 2).
Patients’ clinical characteristics are described in Table 3. Of those scanned, 2 patients and 1 control were left handed. All patients but two had previously under-gone a diagnostic MRI scan and 9 volunteers had previ-ously been scanned as participants in previous studies or for non-pain related clinical reasons. All participants re-ported being comfortable in the scanner.
Behavioural responses to Stroop
There were no statistically significant RT differences for any word group (i.e., sensory, affective or positive word types, control or interference condition) between pa-tients and controls in an individual run or combined runs (Table 4). No habituation was found; there were no differences between run 1 and run 2, and response times were not significantly different when comparing the be-ginning of a run with the end of the run. Comparisons between each word group and the combined group (CMSKP patients and controls) showed no Stroop effect in relation to the pain-related or positive emotional words. There were also no correlation between response times and age group; older patients did not respond sig-nificantly differently compared to the younger age
groups. However, patients were significantly less
accurate than controls in completing the task (Table 5). Patients were similarly inaccurate in the responses to the interference (pain and positive emotional) words as they were for control words. Level of inaccuracy was not spe-cific to any word block or related to handedness.
Generalised linear mixed model (SPSS Version 20) was used to analyse the data. A separate analysis was carried out for each word type (Affective, Positive and Sensory) and level (Control and Interference) for both runs 1 and 2 (12 analyses in total). To allow for multiple testing, the significance level was set at 0.05/12 = 0.004. ‘Patient or Control’ and ‘repeat’ (each run comprised two repeats) were added as fixed effects and patient ID was added as a random effect, to allow for multiple responses. None
Table 2 Pain scores and HADS
Patient Control p = Value
Median values
(25th, 75thpercentiles) Median values(25th, 75thpercentiles) Mann–Whitney test
Current pain 60 (40–70) 0 (0–0) <0.001
0 (no pain)– 100 (worst possible pain) NRS
Worst pain (past week) 90 (70–95) 0 (0–0) <0.001
0 (no pain)– 100 (worst possible pain) NRS
Least pain (past week) 35 (25–54) 0 (0–0) <0.001
0 (no pain)– 100 (worst possible pain) NRS
Pain intensity (past week) 64 (50–70) 0 (0–0) <0.001
0 (no pain)– 100 (worst possible pain) NRS
Pain intensity (average 3 months), 0 (no pain)– 100 (worst possible pain) NRS 64 (50–70) 0 (0–0) <0.001
Pain disturbance (past week) 0 (no pain)– 100 (worst possible pain) NRS 61 (50–85) 0 (0–0) <0.001
HADS 19 (13–23) 5 (1.5-9.75) <0.001
<7 normal, 8–10 borderline abnormal, >11 abnormal
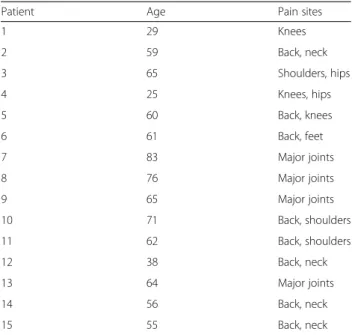
Table 3 Description of the patient group
Patient Age Pain sites
1 29 Knees 2 59 Back, neck 3 65 Shoulders, hips 4 25 Knees, hips 5 60 Back, knees 6 61 Back, feet 7 83 Major joints 8 76 Major joints 9 65 Major joints 10 71 Back, shoulders 11 62 Back, shoulders 12 38 Back, neck 13 64 Major joints 14 56 Back, neck 15 55 Back, neck
of the analyses indicated a significant difference between patients and controls.
Imaging results
There were no behavioural differences between the two runs of the Stroop task and therefore imaging analysis results were pooled across runs [32]. Whole brain ana-lysis revealed that the interference affective pain words compared to control words showed no differences be-tween the patients and controls.
When affective and sensory MPQ words (PRStroop) were combined in the second level analysis and in the third level analysis, differences in BOLD responses were observed in centres involved in pain, emotion and atten-tion between pain words and control words in patients contrasted with controls when HADS was used as a co-variate (see Fig. 3) and when it was not. When the third level analysis was undertaken with HADS as a covari-ate, 5 clusters were seen (see Table 6) and when HADS was excluded in the third level analysis, three clusters were seen (Table 7). There were no differences in BOLD responses between patients and controls to posi-tive interference words or control words (i.e. in the PEStroop task).
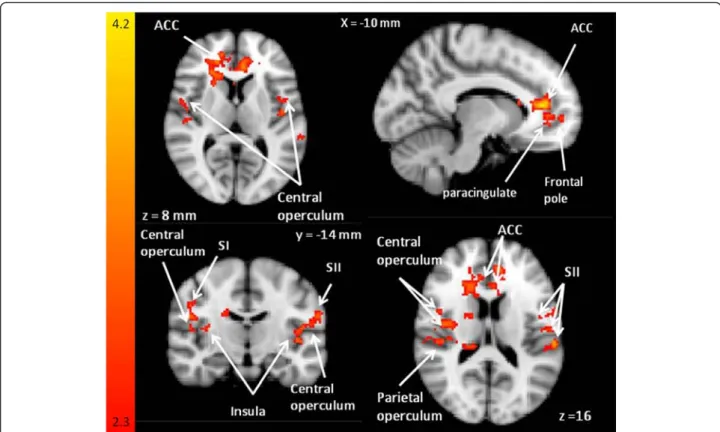
The sensory pain interference words compared to con-trol words showed differences in BOLD signal changes in patients relative to controls in the right insular cortex, right frontal operculum and right central opercular cor-tex (Fig. 4) in the third level analysis.
Discussion
To our knowledge, this is the first study that uses a Stroop paradigm in a complex CMSKP group of patients needing specialist pain management. The findings dem-onstrate that pain-related words used in a PRStroop task resulted in BOLD signal differences between CMSKP pa-tients and healthy controls in pain processing centers in the brain. Larger BOLD signal increases were seen in the patient group compared to the control group in pain-related regions including the ACC, insula, parietal operculum and SI, SII (see Fig. 2). Similar activation pat-terns are commonly seen when physical pain stimulus in used [18]. No differences in changes in BOLD signal were seen between the patients and controls for the positive interference words. Patients were significantly less accurate in the Stroop task compared with their matched controls across all word groups.
Previous studies using pain-related versions of Stroop have been equivocal; some have not demonstrated differ-ences in RTs [22, 41, 45] while others have found atten-tional bias for pain words in patients but not controls [14, 18]. Whalen et al. [31] proposed that in an emo-tional (but not pain-related) counting Stroop, the patient group should demonstrate RTs that are greater for inter-ference trials than for neutral trials, whereas such a dif-ference would not be observed in a healthy control group. They proposed that the ACC would coincide with greater response latencies and healthy participants would show a typical ‘deactivation’ in the pregenual/
Table 4 Response times (milliseconds). Expressed as mean (SD)
Run 1 Run 2
Patients Control p-value Patients Control p-value
Affective Control 767 (198) 713 (179) 0.11 752 (186) 688 (162) 0.031 Affective Interference 770 (194) 740 (209) 0.37 786 (179) 728 (176) 0.056 Positive Control 783 (194) 741 (181) 0.22 741 (167) 696 (175) 0.12 Positive Interference 789 (216) 704 (196) 0.015 767 (188) 698 (176) 0.040 Sensory Control 793 (198) 736 (182) 0.11 750 (177) 706 (157) 0.13 Sensory Interference 790 (226) 755 (207) 0.29 776 (192) 718 (156) 0.090
Table 5 Accuracy. Expressed as median (interquartile range), percentage of 16 possible correct responses
Run 1 Run 2
Patients Control Patients Control
Affective Control 94 % [55 % to 100 %] 100 % [94 % to 100 %] 100 % [70 % to 100 %] 100 % [94 % to 100 %] Affective Interference 94 % [55 % to 100 %] 100 % [94 % to 100 %] 97 % [66 % to 100 %] 100 % [94 % to 100 %] Positive Control 94 % [56 % to 100 %] 100 % [94 % to 100 %] 94 % [73 % to 100 %] 100 % [94 % to 100 %] Positive Interference 91 % [50 % to 100 %] 97 % [88 % to 100 %] 94 % [69 % to 100 %] 100 % [94 % to 100 %] Sensory Control 94 % [50 % to 100 %] 100 % [94 % to 100 %] 100 % [69 % to 100 %] 100 % [94 % to 100 %] Sensory Interference 91 % [50 % to 100 %] 100 % [94 % to 100 %] 100 % [88 % to 100 %] 100 % [100 % to 100 %]
Summary data for accuracy was reported as median and interquartile range to provide some information on the asymmetry of the distribution of the data and to allow for the fixed upper limit of 100 % for accuracy as many of the participants had accuracy scores close to or at this level
subgenual ventral ACC, PCC and hippocampus. In this context, our imaging results of BOLD differences in some of these regions in the absence of RT differences highlights specific differences in the processing of pain-related information that are not observable in the RT be-havioural Stroop data.
The lack of a Stroop effect may imply that RTs may be an imperfect or at least less sensitive measure of cogni-tion [46]. Patients were equally inaccurate in responding to both interference and control words in the current study, suggesting a more general impairment with cogni-tive performance rather than a specific attentional bias for pain-related information (i.e. information we ex-pected to be salient and attentionally demanding in this group), and therefore this does not indicate a Stroop ef-fect. In imaging studies of pain words using alternative paradigms to Stroop [47], changes in centers involved in pain perception have been observed, although direct comparison with our data is difficult due to use of a healthy subjects and different tasks. Nonetheless, it is clear that emotion and cognition are important in pro-cessing pain-related information. Patients were similarly inaccurate in processing the positive word category, yet there were no BOLD differences between patients and controls for this group of interference words. Therefore,
we do not consider the BOLD differences to just be re-lated to the accuracy in responding, and conclude that it appears to be the pain words that are influencing the BOLD responses in patients.
Pain has multiple dimensions; the sensory-discriminative (lateral pain pathway), affective-motivational (medial pain pathway) and cognitive-evaluative components [48]. While these three dimensions interact, it can be instructive to consider them independently to interpret these imaging re-sults in the context of a behavioural-cognitive task. We suggest that the current study shows that in processing pain words major regions that facilitate the sensory-discriminatory component of pain can be activated in this patient population in the absence of noxious stimuli. The sensory-discriminative component involves the lateral pain pathway and the cortical areas SI and SII [23]. These two regions showed different BOLD response in patients com-pared to controls (see Fig. 2). SI is considered important for attentional aspects of pain processing [49] and sensory localization and intensity discrimination [50]. SII has been shown to be activated in rating pain intensity of actions depicted as words [51], and in combination with the insula (see Fig. 2), may have a role in pain discrimination [52] and the memory of pain [53]. The right caudate (see Fig. 2) is engaged during evaluation of spatial locations of noxious
Fig. 3 Sensory word BOLD responses. BOLD signal differences during PRStroop task comparing sensory words to the control words (patient > control groups). This z-statistic map represents these group differences in a whole brain analysis and the z-statistic map is shown in standard MNI space. The color bar shows the scale of the z-statistic (2.3– 4.2). Cluster correction for multiple comparisons was performed at p < 0.05
stimuli [54], and showed increased activation in the patient group compared with the controls during the presentation of the pain interference condition.
We also propose that pain-related words, in the ab-sence of induced noxious stimulation, can activate the areas of the brain associated with affective-motivational aspects of pain in CMSKP patients. Regions involved in the affective-motivational dimension of pain include the insula cortex and rostral ventral ACC [55], inferior and superior parietal cortices and thalamus [49, 56–58]. This is consistent with the work of Legrain et al. [59] who proposed that the ‘pain matrix’ is largely a salience net-work reflecting a system involved in detecting, orienting attention towards, and reacting to the occurrence of sali-ent sensory evsali-ents. The insula receives its major input from the lateral system, but projects to the limbic system [60]. The anterior insula [61, 62] and the ACC [24, 61, 63]
are associated with the evaluative-cognitive and
affective-motivational aspects of pain. The insula is not only activated during painful compared to non painful
touch [64, 65], but also in anticipation of pain [66], pain empathy [67] and stimulation of the insula evokes pain-ful experiences [68]. The ACC is involved in pain affect and with the evaluation of emotional stimuli [69].
The parietal operculum and inferior parietal lobe (see Fig. 2) also showed BOLD signal differences between pa-tients and controls. The parietal operculum is activated with pain-related images [70–72] and has a substantial role in the cortical representation of pain [73]. Com-bined with the inferior partietal lobe (supramarginal gyrus) it is likely to play a significant role in attention to noxious stimuli [56]. We suggest that these regions showed BOLD response differences in patients com-pared to controls because patients were assessing the unpleasantness associated with pain triggered by the pain words.
The cognitive-evaluative component of pain involves evaluation and interpretation of the meaning of pain and emotional distress. BOLD signal differences were seen in patients compared to controls in the central
Table 6 Group differences for the modified Stroop task during third level analysis with HADS as a covariate
Co-ordinates z-stat
x y z
Cluster 1 (7011 voxels, resolution of 2 mm x 2 mm x 2 mm)
ACC (L) −6 40 12 4.37
Caudate (R) 16 20 16 2.58
Frontal pole (L) 38 36 8 3.72
Subcallosal gyrus (L) 0 18 0 4.11
Thalamus (R) 4 −8 0 3.66
Cluster 2 (1165 voxels, resolution of 2 mm x 2 mm x 2 mm)
Planum temporale/parietal operculum (L) −60 −28 14 3.85
Precentral gyrus/inferior frontal/pars operculum −58 6 28 3.35
Superior/middle temporal gyrus posterior, anterior (L) −56 −12 −8 3.81
Supramarginal gyrus, anterior/parietal operculum (L) −62 −28 20 4.05
Cluster 3 (526 voxels, resolution of 2 mm x 2 mm x 2 mm)
Insula (L) −32 −24 10 3.33
Parietal operculum (L) −40 −28 18 3.11
Cluster 4 (493 voxels, resolution of 2 mm x 2 mm x 2 mm)
Frontal pole (R) 28 40 40 3.23
Frontal pole and superior frontal gyrus (R) 22 38 46 3.88
Middle frontal gyrus (R) 22 28 30 3.03
Superior frontal gyrus (R) 16 28 40 3.31
Cluster 5 (394 voxels, resolution of 2 mm x 2 mm x 2 mm)
Post central gyrus (L) −54 −16 42 3.32
Pre/Post central gyrus (L) −48 −14 40 3.34
Precentral gyrus (L) −44 −8 32 3.09
Supramarginal gyrus anterior/post central gyrus (L) −62 −28 42 3.20
opercular cortex, paracingulate and in the left frontal pole. The central opercular cortex and frontal pole [74] are involved in memory processing and the paracingu-late is involved in reality monitoring in relation to memory processing [75]. We propose the differences in
these regions are related to the salience of the pain words for patients but this salience is not present in controls. The attention to pain-related words may be mediated by fear as the subcallosal cingulate cortex has a role in fear [76].
Table 7 Group differences for the modified Stroop task during third level analysis without HADS as a covariate
Co-ordinates z-stat
x y z
Cluster 1 (4265 voxels, resolution of 2 mm x 2 mm x 2 mm)
ACC (L) −6 38 12 4.01
ACC (R) 8 22 20 3.79
ACC/paracingulate (R) 6 34 22 3.70
Caudate (R) 16 18 16 2.87
Frontal pole (R) 16 58 −8 3.90
Cluster 2 (642 voxels, resolution of 2 mm x 2 mm x 2 mm)
Central opercular cortex (L) −56 −14 16 3.14
Planum temporale/parietal operculum (L) −60 −28 14 3.14
Postcentral gyrus (L) −60 −16 24 3.31
Precentral gyrus (L) −44 −8 32 3.28
Cluster 3 (379 voxels, resolution of 2 mm x 2 mm x 2 mm)
Central opercular cortex (R) 50 −6 14 3.13
Central opercular cotex/Heschl’s gyrus (R) 56 −10 6 2.82
Central opercular cortex/planum temporale (R) 56 −2 6 2.91
Parietal operculum (R) 32 −24 22 3.25
Fig. 4 Maps comparing activation during PRStroop task. Maps comparing activation during PRStroop task contrasting sensory and affective pain words compared with control words (patients > controls). Patients with CMSKP have significantly different BOLD signal responses in sensory-discriminatory pain related regions, the affective-motivational dimension and the cognitive evaluative dimension. Eachz-statistic map represents these group differences in a whole brain analysis. The color bar shows the scale of thez-statistic (2.3 – 4.2). Cluster correction for multiple comparisons was performed atp < 0.05
When HADS was not used as a covariate in the ana-lysis, there appeared to be more ACC, frontal pole, cen-tral opercular cortex, Heschl’s gyrus and planum temporale weighted differences between patients and controls when compared to the third level analysis which included HADS. ACC involvement in anxiety and depression is well recognised [77–80] and a recent meta-analysis of functional MRI studies in depression noted that the superior temporal gyrus is one of the most consistently identified regions involved in the pathophysiology of depression [81]; a region which in-volves Heschl’s gyrus and the planum temporale. More pain-related regions were revealed between patients and controls when HADS was used as a covariate than when it was not used supporting the notion that some of the variability between subjects, driven by anxiety and de-pression, has been accounted for by inclusion of the HADS scores.
Nonetheless, there are a number of limitations. There are problems in studying pain-cognition interactions in patients with severe and complex chronic pain, such as seen in those referred to specialist pain centres; extricat-ing pain-related cognitive effects from those resultextricat-ing in pain treatments, especially opioids, and separating pain-related effects on cognition from the effects of the emo-tional distress that is a key feature of chronic pain [82]. Therefore, it has been suggested that a pragmatic ap-proach to studying this group of patients is required [82]. Patients were not asked to stop their medications and therefore, the functional and structural changes as a result of taking these drugs over a long period [83] may have an impact on results. However, all patients had stable treatment regimens that had not been altered dur-ing the 3 months prior to imagdur-ing. It is also possible that the general increase in RT errors could be related to pa-tients’ drug regimens and if that is correct, the pain spe-cific results cannot be explained as drug effects. It was inappropriate to ask patients to stop their drug regimens from a clinical perspective.
Conclusion
The use of a pain word task is non-invasive, does not quire pain induction, and causes activation in brain re-gions associated with pain. Our study has shown that patients with complex CMSKP attend to parelated in-formation differently from healthy controls, which is reflected by BOLD signal changes in regions known to process pain and emotion. Patients with CMSKP did not demonstrate a specific behavioural Stroop effect, but performed worse across all Stroop tasks when compared to controls. This study adds to the literature regarding how people living with pain attend to pain-related infor-mation and offers insight to those living with complex needs where evidence is sparse. Research such as this,
can support further studies looking at adapting or devel-oping new ways of assessing cognitive biases that are more sensitive based on further imaging research to help improve diagnosis.
Abbreviations
3 T MRI:3 Tesla Magnetic Resonance Imaging; Aff Con: Affective Control; Aff Inter: Affective interference; ACC: Anterior cingulate cortex; BOLD fMRI: Blood oxygenation level dependent functional magnetic resonance imaging; CMSKP: Chronic musculoskeletal pain; TE: Echo time; FMRI: Functional magnetic resonance imaging; HADS: Hospital Depression and Anxiety Scale; MPQ: McGill Pain Questionnaire; Mm: Millimeters; Ms: Milliseconds; NRS: Numerical rating scale; PRStroop: Pain-related Stroop; Pos Con: Positive Control; Pos Inter: Positive Interference; PEStroop: Positive-emotional Stroop; SI: Primary somatosensory cortices; RTs: Reaction times;
RM-ANOVA: Repeated-measures analysis of variance; TR: Repetition time; SII: Secondary somatosensory cortices; S: Seconds; Sen Con: Sensory control; Sen Inter: Sensory interference; USA: United States of America.
Competing interests
The authors declare that they have no competing interests.
Authors’ contribution
All authors have made substantial contributions to conception and design, interpretation of data, drafting the article and revising it and all gave final approval of the version to be published. Specifically, AMT, RP and OH conceived of the study; ADH, RW and AV designed the Stroop paradigm and the fMRI methods; ADH, RW, AMT, participated in data acquisition and analysis and interpretation of the fMRI data, RP, OH and JEH advised on behavioural study design, ARW provided statistical advice.
Authors’ information
AMT and OH are involved in strategic pain activities that challenge ways of traditionally managing people living with chronic pain who have complex needs who are on long waiting lists for treatment. The study came from trying to better understand this population as currently, management strategies are not really addressing the complexities presented clinically. Trying to generalise from the literature to inform clinical practice is limited in that studies usually address homogeneous groups where most variable are controlled, e.g. osteoarthritis of the thumb, temporomandibular joint disorders, and in patients who are not taking any analgesics. These are not the groups that tend to use large amounts of health care resources when compared to the chronic musculoskeletal pain population and hence, while there are limitations in pragmatic studies, as long as the limitations are recognised, these may be very useful in guiding new ways of thinking about how to assess and support those who present with complex pain needs. AMT and OH approached highly respected academics to work in partnership to address some of these issues through neuroimaging research.
Acknowledgements
The authors would like to thank the patients, volunteers and the staff at CUBRIC, Pain Clinic, Cardiff and Vale University Health Board and Pain Management Service, Powys Health Board for their support.
This work was supported by Higher Education Funding Council for Wales (https://www.hefcw.ac.uk/home/home.aspx to RW), Welsh Institute of Cognitive Neurosciences (http://psych.cf.ac.uk/wicn/ to AMT, AV, RP, OH, JH, RGW), National Institute of Academic Anaesthesia (http://www.niaa.org.uk/ to AT, RGW, JH, OH, AV, RP) and the Banting Postdoctoral Fellowship Program (NSERC of Canada (http://banting.fellowships-bourses.gc.ca/homeaccueil-eng.html to ADH).
Author details
1
Department of Anaesthetics, Intensive Care and Pain Medicine, Institute of Infection and Immunity, Cardiff University, Cardiff CF14 4XN, Wales, UK. 2Cardiff University Brain Research Imaging Centre (CUBRIC), School of Psychology, Cardiff University, Cardiff CF10 3AT, Wales, UK.3Russell H. Morgan Department of Radiology and Radiological Science, The Johns Hopkins University, Baltimore, MD, USA.4F. M. Kirby Center for Functional Brain Imaging, Kennedy Krieger Institute, Baltimore, MD, USA.5Department of Psychology, Swansea University, Singleton Park, Swansea SA2 8PP, Wales, UK.
6School of Psychology, Cardiff University, Cardiff CF10 3ATWales, UK. 7Institute of Primary Care and Public Health, Cardiff University, Cardiff CF14 4YS, Wales, UK.8Bronllys Pain and Fatigue Management Centre, Powys, Brecon LD3 0 LUWales, UK.
Received: 25 February 2015 Accepted: 28 January 2016
References
1. Torrance N, Elliott AM, Lee AJ, Smith BH. Severe chronic pain is associated with increased 10 year mortality. A cohort record linkage study. Eur J Pain. 2010;14(4):380–6.
2. Woolf AD, Akesson K. Understanding the burden of musculoskeletal conditions. The burden is huge and not reflected in national health priorities. BMJ. 2001;322(7294):1079–80.
3. Foster NE, Pincus T, Underwood MR, Vogel S, Breen A, Harding G. Understanding the process of care for musculoskeletal conditions–why a biomedical approach is inadequate. Rheumatology (Oxford). 2003;42(3):401–4. 4. Eccleston C. Chronic pain and attention: a cognitive approach. Br J Clin
Psychol. 1994;33(Pt 4):535–47.
5. Janssen SA, Arntz A. Anxiety and pain: attentional and endorphinergic influences. Pain. 1996;66(2–3):145–50.
6. Niv D, Kreitler S. Pain and quality of life. Pain Pract. 2001;1(2):150–61. 7. Kreitler S, Kreitler M. Psychological approaches to treatment of pain. In:
Kreitler S, Beltrutti D, Lamberto A, Niv D, editors. Handbook of Chronic Pain. New York: Nova Science; 2007.
8. Esteve R, Ramirez-Maestre C, Lopez-Marinez AE. Adjustment to chronic pain: the role of pain acceptance, coping strategies, and pain-related cognitions. Ann Behav Med. 2007;33(2):179–88.
9. Tracey I, Mantyh PW. The cerebral signature for pain perception and its modulation. Neuron. 2007;55(3):377–91.
10. Apkarian AV, Sosa Y, Sonty S, Levy RM, Harden RN, Parrish TB, et al. Chronic back pain is associated with decreased prefrontal and thalamic gray matter density. J Neurosci. 2004;24(46):10410–5.
11. Baliki MN, Geha PY, Apkarian AV, Chialvo DR. Beyond feeling: chronic pain hurts the brain, disrupting the default-mode network dynamics. J Neurosci. 2008;28(6):1398–403.
12. Crombez G, Eccleston C, Baeyens F, van Houdenhove B, van den Broeck A. Attention to chronic pain is dependent upon pain-related fear. J Psychosom Res. 1999;47(5):403–10.
13. Buck R, Morley S. A daily process design study of attentional pain control strategies in the self-management of cancer pain. Eur J Pain. 2006;10(5):385–98. 14. Crombez G, Hermans D, Adriaensen H. The emotional stroop task and
chronic pain: what is threatening for chronic pain sufferers? Eur J Pain. 2000; 4(1):37–44.
15. Derbyshire SW, Vogt BA, Jones AK. Pain and Stroop interference tasks activate separate processing modules in anterior cingulate cortex. Exp Brain Res. 1998;118(1):52–60.
16. Andersson G, Haldrup D. Personalized pain words and Stroop interference in chronic pain patients. Eur J Pain. 2003;7(5):431–8.
17. Beck JG, Freeman JB, Shipherd JC, Hamblen JL, Lackner JM. Specificity of Stroop interference in patients with pain and PTSD. J Abnorm Psychol. 2001;110(4):536–43.
18. Roelofs J, Peters ML, Zeegers MP, Vlaeyen JW. The modified Stroop paradigm as a measure of selective attention towards pain-related stimuli among chronic pain patients: a meta-analysis. Eur J Pain. 2002;6(4):273–81. 19. Asmundson GJ, Kuperos JL, Norton GR. Do patients with chronic pain
selectively attend to pain-related information?: preliminary evidence for the mediating role of fear. Pain. 1997;72(1–2):27–32.
20. Pincus T, Morley S. Cognitive-processing bias in chronic pain: a review and integration. Psychol Bull. 2001;127(5):599–617.
21. Mathews A, Klug F. Emotionality and interference with color-naming in anxiety. Behav Res Ther. 1993;31(1):57–62.
22. Weissman-Fogel I, Moayedi M, Tenenbaum HC, Goldberg MB, Freeman BV, Davis KD. Abnormal cortical activity in patients with temporomandibular disorder evoked by cognitive and emotional tasks. Pain. 2011;152(2):384–96. 23. Seminowicz DA, Mikulis DJ, Davis KD. Cognitive modulation of pain-related
brain responses depends on behavioral strategy. Pain. 2004;112(1–2):48–58. 24. Bantick SJ, Wise RG, Ploghaus A, Clare S, Smith SM, Tracey I. Imaging how
attention modulates pain in humans using functional MRI. Brain. 2002; 125(Pt 2):310–9.
25. Merskey H, Bogduk N. Pain terms: Classification of Chronic Pain. 2nd ed. Seattle: International Association for the Study of Pain; 1994.
26. Dworkin RH, Turk DC, Farrar JT, Haythornthwaite JA, Jensen MP, Katz NP, et al. Core outcome measures for chronic pain clinical trials: IMMPACT recommendations. Pain. 2005;113(1–2):9–19.
27. Zigmond AS, Snaith RP. The hospital anxiety and depression scale. Acta Psychiatr Scand. 1983;67(6):361–70.
28. Herrmann C. International experiences with the Hospital Anxiety and Depression Scale–a review of validation data and clinical results. J Psychosom Res. 1997;42(1):17–41.
29. Martin CR, Tweed AE, Metcalfe MS. A psychometric evaluation of the Hospital Anxiety and Depression Scale in patients diagnosed with end-stage renal disease. Br J Clin Psychol. 2004;43(Pt 1):51–64.
30. Stroop JR. Studies of interference in serial verbal reactions. J Exp Psychol. 1935;18:643–62.
31. Whalen PJ, Bush G, Shin LM, Rauch SL. The emotional counting Stroop: a task for assessing emotional interference during brain imaging. Nat Protoc. 2006;1(1):293–6.
32. Bush G, Whalen PJ, Shin LM, Rauch SL. The counting Stroop: a cognitive interference task. Nat Protoc. 2006;1(1):230–3.
33. Melzack R. The McGill Pain Questionnaire: major properties and scoring methods. Pain. 1975;1(3):277–99.
34. Balota DA, Yap MJ, Cortese MJ, Hutchison KA, Kessler B, Loftis B, et al. The English Lexicon Project. Behav Res Methods. 2007;39(3):445–59. 35. Jenkinson M, Bannister P, Brady M, Smith S. Improved optimization for the
robust and accurate linear registration and motion correction of brain images. Neuroimage. 2002;17(2):825–41.
36. Jenkinson M. Fast, automated, N-dimensional phase-unwrapping algorithm. Magn Reson Med. 2003;49(1):193–7.
37. Jenkinson M: Improving the registration of B0-distorted EPI images using calculated cost function weights. In: Tenth International Conference on Functional Mapping of the Human Brain. Budapest, Hungary; 2004. 38. Jenkinson M, Smith S. A global optimisation method for robust affine
registration of brain images. Med Image Anal. 2001;5(2):143–56. 39. Andersson J, Jenkinson M, Smith SM. Non-linear registration, aka spatial
normalisation, FMRIB Technical Report TR07JA2. Tech.rep. Oxford, United Kingdom: FMRIB Centre; 2007.
40. Woolrich MW, Ripley BD, Brady M, Smith SM. Temporal autocorrelation in univariate linear modeling of FMRI data. Neuroimage. 2001;14(6):1370–86. 41. Pincus T, Fraser L, Pearce S. Do chronic pain patients 'Stroop' on pain
stimuli? Br J Clin Psychol. 1998;37(Pt 1):49–58.
42. Snider BS, Asmundson GJ, Wiese KC. Automatic and strategic processing of threat cues in patients with chronic pain: a modified stroop evaluation. Clin J Pain. 2000;16(2):144–54.
43. Worsley KJ. Statistical analysis of activation images. In: Jezzard P, Matthews PM, Smith SM, editors. Funtional MRI: An Introduction to Methods. Oxford: Oxford University Press; 2001.
44. Woolrich MW, Behrens TE, Beckmann CF, Jenkinson M, Smith SM. Multilevel linear modelling for FMRI group analysis using Bayesian inference. Neuroimage. 2004;21(4):1732–47.
45. Duckworth MP, Iezzi A, Adams HE, Hale D. Information processing in chronic pain disorder: a preliminary analysis. J Psychopathol Behav Assessment. 1997;19:239–55.
46. Wilkinson D, Halligan P. The relevance of behavioural measures for functional-imaging studies of cognition. Nat Rev Neurosci. 2004;5(1):67–73. 47. Gu X, Han S. Neural substrates underlying evaluation of pain in actions
depicted in words. Behav Brain Res. 2007;181(2):218–23.
48. Melzack R, Casey KL. Sensory, motivational, and central control determinants of pain. In: Kenshalo DR, editor. The Skin Senses. IL: Thomas: Springfield; 1968. p. 423–39.
49. Worthen SF, Hobson AR, Hall SD, Aziz Q, Furlong PL. Primary and secondary somatosensory cortex responses to anticipation and pain: a
magnetoencephalography study. Eur J Neurosci. 2011;33(5):946–59. 50. Bushnell MC, Duncan GH, Hofbauer RK, Ha B, Chen JI, Carrier B. Pain
perception: is there a role for primary somatosensory cortex? Proc Natl Acad Sci U S A. 1999;96(14):7705–9.
51. Gu X, Han S. Attention and reality constraints on the neural processes of empathy for pain. Neuroimage. 2007;36(1):256–67.
52. Brooks JC, Nurmikko TJ, Bimson WE, Singh KD, Roberts N. FMRI of thermal pain: effects of stimulus laterality and attention. Neuroimage. 2002;15(2): 293–301.
53. Albanese MC, Duerden EG, Rainville P, Duncan GH. Memory traces of pain in human cortex. J Neurosci. 2007;27(17):4612–20.
54. Oshiro Y, Quevedo AS, McHaffie JG, Kraft RA, Coghill RC. Brain mechanisms supporting spatial discrimination of pain. J Neurosci. 2007;27(13):3388–94. 55. Whalen PJ, Bush G, McNally RJ, Wilhelm S, McInerney SC, Jenike MA, et al. The emotional counting Stroop paradigm: a functional magnetic resonance imaging probe of the anterior cingulate affective division. Biol Psychiatry. 1998;44(12):1219–28.
56. Duncan GH, Albanese MC. Is there a role for the parietal lobes in the perception of pain? Adv Neurol. 2003;93:69–86.
57. Ralston 3rd HJ. Pain and the primate thalamus. Prog Brain Res. 2005;149:1–10. 58. Kulkarni B, Bentley DE, Elliott R, Youell P, Watson A, Derbyshire SW, et al.
Attention to pain localization and unpleasantness discriminates the functions of the medial and lateral pain systems. Eur J Neurosci. 2005;21(11): 3133–42.
59. Legrain V, Iannetti GD, Plaghki L, Mouraux A. The pain matrix reloaded: a salience detection system for the body. Prog Neurobiol. 2011;93(1):111–24. 60. Treede RD, Kenshalo DR, Gracely RH, Jones AK. The cortical representation
of pain. Pain. 1999;79(2–3):105–11.
61. Peyron R, Laurent B, Garcia-Larrea L. Functional imaging of brain responses to pain. A review and meta-analysis. Neurophysiol Clin 2000. 2000;30(5):263–88. 62. Porro CA, Baraldi P, Pagnoni G, Serafini M, Facchin P, Maieron M, et al. Does
anticipation of pain affect cortical nociceptive systems? J Neurosci. 2002; 22(8):3206–14.
63. Rainville P. Brain mechanisms of pain affect and pain modulation. Curr Opin Neurobiol. 2002;12(2):195–204.
64. Price DD. Psychological and neural mechanisms of the affective dimension of pain. Science. 2000;288(5472):1769–72.
65. Apkarian AV, Bushnell MC, Treede RD, Zubieta JK. Human brain mechanisms of pain perception and regulation in health and disease. Eur J Pain. 2005; 9(4):463–84.
66. Ploghaus A, Tracey I, Gati JS, Clare S, Menon RS, Matthews PM, et al. Dissociating pain from its anticipation in the human brain. Science. 1999; 284(5422):1979–81.
67. Singer T, Frith C. The painful side of empathy. Nat Neurosci. 2005;8(7):845–6. 68. Ostrowsky K, Magnin M, Ryvlin P, Isnard J, Guenot M, Mauguiere F.
Representation of pain and somatic sensation in the human insula: a study of responses to direct electrical cortical stimulation. Cereb Cortex. 2002; 12(4):376–85.
69. Phillips ML, Gregory LJ, Cullen S, Coen S, Ng V, Andrew C, et al. The effect of negative emotional context on neural and behavioural responses to oesophageal stimulation. Brain. 2003;126(Pt 3):669–84.
70. Jackson PL, Rainville P, Decety J. To what extent do we share the pain of others? Insight from the neural bases of pain empathy. Pain. 2006;125(1–2): 5–9.
71. Ogino Y, Nemoto H, Inui K, Saito S, Kakigi R, Goto F. Inner experience of pain: imagination of pain while viewing images showing painful events forms subjective pain representation in human brain. Cereb Cortex. 2007; 17(5):1139–46.
72. Benuzzi F, Lui F, Duzzi D, Nichelli PF, Porro CA. Does it look painful or disgusting? Ask your parietal and cingulate cortex. J Neurosci. 2008;28(4): 923–31.
73. Treede RD, Apkarian AV, Bromm B, Greenspan JD, Lenz FA. Cortical representation of pain: functional characterization of nociceptive areas near the lateral sulcus. Pain. 2000;87(2):113–9.
74. Bonda E, Petrides M, Evans A. Neural systems for tactual memories. J Neurophysiol. 1996;75(4):1730–7.
75. Buda M, Fornito A, Bergstrom ZM, Simons JS. A specific brain structural basis for individual differences in reality monitoring. J Neurosci. 2011;31(40): 14308–13.
76. Dunsmoor JE, Prince SE, Murty VP, Kragel PA, LaBar KS. Neurobehavioral mechanisms of human fear generalization. Neuroimage. 2011;55(4):1878–88. 77. Konarski JZ, McIntyre RS, Kennedy SH, Rafi-Tari S, Soczynska JK, Ketter TA.
Volumetric neuroimaging investigations in mood disorders: bipolar disorder versus major depressive disorder. Bipolar Disord. 2008;10(1):1–37. 78. Lorenzetti V, Allen NB, Fornito A, Yücel M. Structural brain abnormalities in
major depressive disorder: a selective review of recent MRI studies. J Affect Disord. 2009;117(1–2):1–17.
79. Ball TM, Stein MB, Paulus MP. Toward the application of functional neuroimaging to individualized treatment for anxiety and depression. Depress Anxiety. 2014;31(11):920–33.
80. Zhang H, Chen Z, Jia Z, Gong Q. Dysfunction of neural circuitry in depressive patients with suicidal behaviors: a review of structural and functional neuroimaging studies. Prog Neuropsychopharmacol Biol Psychiatry. 2014;53:61–6.
81. Fitzgerald PB, Laird AR, Maller J, Daskalakis ZJ. A meta-analytic study of changes in brain activation in depression. Hum Brain Mapp. 2008;29(6):683–95. 82. Kreitler S, Niv D. Cognitive impairment in chronic pain. Pain Clinical
Updates. 2007;15(4):1–4.
83. Upadhyay J, Maleki N, Potter J, Elman I, Rudrauf D, Knudsen J, et al. Alterations in brain structure and functional connectivity in prescription opioid-dependent patients. Brain. 2010;133(Pt 7):2098–114.
• We accept pre-submission inquiries
• Our selector tool helps you to find the most relevant journal • We provide round the clock customer support
• Convenient online submission • Thorough peer review
• Inclusion in PubMed and all major indexing services • Maximum visibility for your research
Submit your manuscript at www.biomedcentral.com/submit