Proceedings of IMECE 2008 2008 ASME International Mechanical Engineering Congress and Exposition
October 31 – November 6, 2008, Boston, Massachusetts, USA
DRAFT PAPER_IMECE2008-67275
COMBINING SIX SIGMA WITH LEAN PRODUCTION TO INCREASE THE PERFORMANCE
LEVEL OF A MANUFACTURING SYSTEM
Francesco Aggogeri University of Brescia
Department of Mechanical and Industrial Engineering Via Branze, 38
25123, Brescia (Italy) [email protected]
Marco Mazzola University of Brescia
Department of Mechanical and Industrial Engineering Via Branze, 38
25123, Brescia (Italy) [email protected]
ABSTRACT
The application of innovative methodologies and problem solving methods to organize and manage manufacturing processes is essential to increase the business performance of a company and satisfy the customer demand. Specifically, combining Six Sigma quality with Lean Production speed empowers all companies to reach customer satisfaction through continuous improvement and reduction of non added value activities. The goal of this paper is to explain and show the power and the effectiveness of the Six Sigma and Lean production combination in a manufacturing company that realizes brass extruded and drawn pieces. Lean Six Sigma represents one of more dynamic and innovative program of management to improve quality of products and efficiency of manufacturing. This project focuses on the increase of customer satisfaction and savings by eliminating defects of the product and reducing scraps and non value added activities of the mechanical manufacturing stream. The authors implemented the DMAIC problem solving method applying different quality management and lean tools. The paper shows a complete roadmap in order to analyze and eliminate defect and waste causes, and improve the performance level of a manufacturing system. The obtained results highlight a reduction of Costs of Poor Quality by 20% and an increase of process cycle efficiency of 6%.
Key words: Six Sigma, Lean Production, DMAIC INTRODUCTION TO LEAN SIX SIGMA
Lean Six Sigma (LSS) is a disciplined and rigorous problem solving technique that guarantees significant changes of company results using a management philosophy for operations and organizational activities. This approach has not only the goal to modify and improve business performances but
also to create an awareness, in every employee, of a new technique to act upon and to consider industrial improvement.
The methodology key concept is to remove all “defects” and non added value activities that hinder an optimal deployment of manufacturing and transactional processes [1]. Upfront Lean Six Sigma quantifies economic savings underlining the feasibility and convenience of a project. This aspect is often neglected in other improvement methodologies deployed in recent years. To implement a Lean Six Sigma means to approach a problem with order and clarity without causality. It is necessary to define accurate goals, coherently with the available resources, and a heterogeneous project team that can involve all the organization to achieve and obtain excellent results.
The Lean Six Sigma model attacks costs of poor quality (COPQs) that often absorb a significant part of sales. This aspect focuses on what is really important for the company success with a relevant saving of money and resources. The basic approach is that every business process can be measured and therefore assessed objectively. By measuring the features that impact on business performances significantly, it is possible to know what should be analyzed and improved.
The main Lean Six Sigma goal is to improve a system eliminating defects and non value added activities for the customer, because they are costs and money for a company and therefore a reduction of the price-cost margin [2]. Lean Six Sigma offers a smart set of techniques and tools to facilitate the implementation of methodology guaranteeing a utilization of resources that are often unheeded.
The methodology, supported by Six Sigma, suggests two problem solving methods: DMAIC (define, measure, analyze, improve, control) and DFLS (design for Lean Six Sigma). It is possible to use the DMAIC when the processes or the systems are already in existence, while it is preferable to apply the
DFLS in optimizing a design process. The DMAIC has five principle phases: define, measure, analyze, improve and control a problem [3]. The DFLS is a structured process to create a new process that will operate at Lean Six Sigma standards.
The significant importance, that the economic community has attributed to Lean Six Sigma in recent years, is justified by obtained results of quality levels, reduction of costs, increase of profits that multinational companies had achieved using a rigorous application of the method. Nevertheless it is wrong to think that Lean Six Sigma can not be applied into SMEs (small and medium enterprises). The flexibility of methodology ensures success for every company environment, as shown in this case study.
WHAT IS LEAN SIX SIGMA?
The main goal of a company is to maximize profits. A company that wants to compete in the market must minimize production costs, speed up manufacturing and service processes, deploy flexibility, answer demand effectively, ensure deliveries on time and assure a high quality level of output [4].
All these features can be summarized by the Lean Six Sigma methodology oriented on customer satisfaction. Lean Six Sigma was born in the companies for the companies, it has not an academic origin. Its success is founded on experience deployed by companies that have already implemented it. Lean Six Sigma shows an able strategy to combine the synergy between two valid methods: Six Sigma and Lean production. This synergy creates speed of processes (manufacturing or transactional), ensuring more flexibility to answer customer demand. At the same time it enables more quality for products reducing variability.
Six Sigma is a technique which when applied to business management, is able to improve the processes reducing variability. It is a strategic tool to gain quality and process effectiveness in order to satisfy customers [5].
Instead the principles of Lean Production, developed originally for Toyota [6], enables the company to deliver on demand, minimize inventory, maximize the use of multi-skilled employees and focus resources where they are needed, reducing a significant part of costs and improving cycle times. By applying Lean Six Sigma it possible to revolutionize efficiency performances in every company area of manufacturing and transactional processes.
Separately Lean Production and Six Sigma have changed the business management of industrial processes. Together, as Lean Six Sigma, they represent one of more dynamic and innovative strategies of management to improve quality of products and efficiency of manufacturing. They guarantee high profits by cutting costs. In fact a fast manufacturing process has high quality, even if this is not easy to imagine. For a manufacturing process it is normal to believe that if a company increases the productivity (i.e. many pieces per hour) it rises the defect probability. Therefore, as a consequence, costs of poor quality can increase too. On the contrary Lean Six Sigma demonstrates that by operating on elimination of non value added activities, reducing lead time and optimizing the critical processes for a manufacturing flow, there is a decrease in defects.
A relevant voice of cost is due to waste or reworks on defect products. These are operations apparently unavoidable to
satisfy customer requirements. The application of Lean Six Sigma can reduce the impact of these operations significantly and lower associated costs drastically. The Lean Six Sigma key is that only a fast process is able to satisfy a high quality level and at the same time only a high quality level process can support a speed in production. The effect of quality merged into speed ensures many benefits. A low lead time implies delivery demand on time satisfying customer requirements and thus increasing profits. A high quality level of output guarantees more satisfaction and contemporaneously a significant reduction of customer assistance costs.
It is possible to define Lean Six Sigma as a continuous improvement strategy oriented to customer satisfaction that focuses on output quality and process speed. A Lean Six Sigma project is constituted by five operative phases: define, measure, analyze, improve and control. The DMAIC problem solving method is not only succession of phases but it is also a philosophy that defines logical passages. This method is a forma mentis and it constitutes an ordinate structure to follow in every level of organization. In the DMAIC method the communication is an important key for its success, it is fundamental to involve all aspects of the organization, showing the philosophy principles, tools and tactics [7].
PROJECT STATEMENT
This Lean Six Sigma project has been developed in a mechanical company that is a known manufacturing leader in brass extruded and drawn pieces. It is investing in innovation technologies and human resources in order to increase its product portfolio, persevering in supplying special products suitable for different requirements and applications. The production volume is 33,000 tons per year of brass bars. Its integrated manufacturing systems are characterized by a significant number of mechanical processes and activities.
This project rose from a strong need of the company top management to increase performance level of the manufacturing system and gains in satisfying customer requirements. In fact, the last year has shown a significant number of customer complaints and a reduction of the internal yield. Thus the main goal of this project was to improve the company yield and savings by eliminating product defects and abating scraps and non value added activities of the manufacturing stream. Identified the VOC (dissatisfaction of bar dimensional tolerances, scratches on the bar, incorrect delivery documentations), the LSS team calculated the performance level of the system at start of the project (87.1% - internal yield) and the possible gap.
Using the QFD methodology the team defined the main CTQs (extrusion and wire drawing processes) on which it had to focus for an immediate improvement. For every product item the process capability, dpm, yield and sigma level were calculated [8].
Applying cause - effect diagrams and Kaizen Blitz analysis it was possible to identify the main defect causes. In particular the team applied two effective tools, DOE to understand the variability sources of the extrusion process and SMED to reduce the changeover time of the drawing process.
In the improvement phase the team implemented a significant number of solution actions obtaining an important increase of productivity and yield, and a significant reduction COPQs.
DEFINE PHASE
The need for globalization, the saturation and instability of markets, the life-cycle time reduction of products and the customer demands have been the main factors that have contributed to a radical change of management conceptions and strategies. In this context the application of Lean Six Sigma, which suggests techniques and methods to organize and manage manufacturing and service processes, is essential to increase the business performance. For these reasons the company of this project has chosen to implement the LSS methodology, not focusing only on the goal to modify and improve business performances but also to create an awareness, in every employee, of a new technique to act upon and to deliver industrial improvement. The core business of this company is the realization of brass bars characterized by different profiles (rectangular, square, hexagon and round), see Figure 1. A bar brass can be the main raw material of other complex manufacturing systems, that represent the customers of this company. Starting by a brass bar it is possible to obtain a significant number of final products. For example, by using turning processes it is possible to realize valves, padlocks, door locks, gauges or pipe fittings.
Fig 1: Project product: a brass bar
The implementation of the LSS methodology and project completion had to take ten months in order to reduce waste of time and resources that are essential for company business. This project wanted to attack costs of poor quality (COPQs) that absorbed a significant part of sales. In this project the LSS team applied the DMAIC problem solving method, suitable in order to improve already existing processes or systems.
The definition of the main goals has been deployed by the top management having a complete and structured vision of the activities, priorities and necessities of the organization. It was important to define clear and ordered goals related to the resources and business context. If it was necessary the top management should subdivide complex problems into smaller issues that are easier to improve in a short time.
Comparing customer complaints and process performances the top management had decided to focus on the whole manufacturing system, including supplier relationships. Thus the main goal of this project was to improve internal yield and savings of the manufacturing system by eliminating product defects and reducing scraps and non value added activities. For this reason an identification of the main KPIs (Key Performance Indicators) was necessary in order to understand the status of the system and quantify the goals. In fact, this company realizes different items of bars and therefore a prioritization was necessary, as shown in VOP identification section. The definition of the project goals should be supported by creation of a heterogeneous team to push the whole
organization towards reaching of the desired results. The project team was characterized by different figures: the production manager, a person of quality department, the maintenance manager, two operators and a financial analyst. These figures were namely change agents and should be the reference for the organization during the deployment of a LSS project.
VOC Identification
The definition of the VOC (voice of the customer) allows to identify those features that have an immediate impact on customer satisfaction. If an organization discovers its weak points, it can plan the priorities of improvement and, as a consequence, create a significant increase of the satisfaction level in short time [9]. It is fundamental to remember that the customer is not only the final user but represents the totality of entities that are down stream of a department or a process that we are analyzing. In this project the definition of the VOC it was a complex step.
The first activity was to identify who was the client. In this case it was possible to divide customers into internal and external. For external customer, the team analyzed the different market complaints in collaboration with the customer service department, defining the following critical to customer (CTCs): dissatisfaction of dimensional tolerances, scratches on the bar, incorrect documentations incorrect invoices and dissatisfaction of chemical feature tolerances. In particular, analyzing data and information of the last two years (2006 - 2007, supposing a production volume of 45,000 tons) the team calculated that the total yield was 98%. Table 1 shows the different defect percentages.
Defect category Defect % Dissatisfaction of dimensional tolerances 67%
Scratches on the bar 12%
Incorrect documentation 10%
Dissatisfaction of chemical feature tolerances 7%
Other 4% Total 100% Tab. 1: VOC vs. external yield
Table 2 and Figure 2 highlight that the main internal defect categories and percentages are the same of the external customer analysis, even if a dramatic change in yield!!!
Defect category Defect % Dissatisfaction of dimensional tolerances 78%
Scratches on the bar 13%
Dissatisfaction of chemical feature tolerances 5%
Other 4% Total 100% Tab. 2: VOC vs. internal yield
In fact the internal yield was 87.1%. The goal of this project was to increase the internal yield and, consequently, improve external customer satisfaction.
Pareto Chart 0 10 20 30 40 50 60 70 80 90 100 Dissatisfaction of dimensional tolerances
Scraps on the bar Dissatisfaction of chemical feature tolerances Other # O b serva ti o n s 0 0.1 0.2 0.3 0.4 0.5 0.6 0.7 0.8 0.9 1
Fig 2: Pareto diagram of defect categories (internal customers)
VOP Definition
In a global evaluation of a company it is important to compare the VOC analysis with the VOP (voice of the process). In the same way it is restrictive to assess a process without considering the market requirements. Therefore it is important to know and measure all processes of a manufacturing stream. In order to understand the VOP the team considered for every involved process the following steps: start and end time, involved activities, output (products, services and information) and input (6M: man, machine, method, material, measurement, mother nature).
The first step of this phase was the deployment of the process mapping using Lean Six Sigma tools. In particular the team applied the SIPOC tool to identify the main suppliers and customers, and the process flow to map the main internal processes [10].
Figure 3 shows the main processes involved in the project. The manufacturing system is characterized by the following processes: raw material acceptance, melting and casting, cutting, preheating, extrusion, cold wire drawing, cutting, packaging, weighing and delivery. The process mapping was deployed involving employees of the different departments to discover critical inputs and outputs of processes. The second step of this phase was the performance level calculation.
In order to develop an effective performance level analysis it was important to define the main critical items on which the team had to focus to calculate process capability. In fact, the project company realizes different items of brass bars and a prioritization was fundamental in order to obtain an immediate increase of the system performance level. For this reason a trade-off between production volume and process yield was necessary.
Figure 4 shows the trade-off matrix. It is possible to note that the main critical items are: T17 and T22. In fact they are characterized by a high production volume and a low process capability. Following this way, the team considered T17 and T22 data and information of the last two years (2006 and 2007) and it calculated the main significant capability indicators, as shown in Table 3.
It was possible to define the yield using discrete data:
year per tons realized year per tons sold Yield=
In the measure phase the team developed a more detailed analysis, considering continuous data in order to assess the dimensional tolerances for extrusion and drawing processes.
Fig 3: Manufacturing system mapping
Nevertheless these first data allowed to define the performance level of the system and therefore the possibility to calculate the Costs of Poor Quality
Fig 4: Trade-off matrix per item: production volume vs. yield
Item Yield Cp Sigma level Sigma capability
T17 0.74 0.71 0.63 2.10
T22 0.78 0.75 0.77 2.20
Tab. 3:VOP identification
Raw material acceptance Preheating Cooling Extrusion Melting and casting Melting scrap Cutting Raw material Billet Hot saw Lubricant Ingot Label Operator Raw material Scrap Temp. 1000°C Operator Operators Roll Tools Billet Bar Packaging, weighing Cutting Cold drawing Straightening Ingots Slag Billet Temp. 600°C Billet Die Speed Operator Roll Bar Die Speed Operator Bar
Production Volume (%) vs Yield
0.65 0.7 0.75 0.8 0.85 0.9 0.95 1 5.00% 7.00% 9.00% 11.00% 13.00% 15.00% 17.00% 19.00% Volume Yield T17 T33 T22 T18 T35 T30 T24 T34 T26 T25
COPQs Calculation
The main economic advantage the Lean Six Sigma application is a significant reduction of Costs of Poor Quality (COPQs) [11]. The calculation of these costs represented a fundamental condition for business. Their determination identified which are those critical areas of the mechanical system to obtain an immediate improvement of the performance level. It was possible to divide these costs into direct and indirect costs.
The calculation of COPQs was deployed in collaboration with the financial department. In particular it was possible to define them in more details:
- rework costs; they were due to all reworks of defective bars. Using melting and casting processes, this company could cover all scraps. Thus, only an extra employee use and machinery, and facility utilization defined this voice of cost;
- scrap costs; this voice of cost was due to physiological loss of extrusion and drawing processes;
- control costs; they were due to the utilization of two operators in order to control the performance level of the system at the end of the extrusion process. These operators measured the bar diameter verifying tolerance compliance;
- management costs; they were costs defined by an extra management of customer complaints;
- lost sells and penalties; they were calculated in base on the customer relationship.
In the light of these results the team, in accordance with the top management, defined the economical goal. This goal was to reduce the COPQs by 20% and therefore to increase the savings about 800,000.00 €.
CTQ DETERMINATION
In order to identify the main critical to quality features (CTQs) the team applied the QFD technique. CTQs represent the greatest opportunity for improvement in cost, quality and lead time. The Quality Function Deployment methodology provided a structured and smart roadmap that identified and quantified customer requirements and translated them into key critical parameters using a mathematical tool (relationship matrix) [12]. The team deployed the QFD method in a meeting of two days, in which the project members and different involved department persons discussed of the CTQs identification using many tools such as brainstorming techniques, market complaints and process charters.
The QFD followed four phases:
- the presentation of the project to other involved persons using the first colleted data and information;
- the identification of the Customer Axis: the team determined market requirements using the voice of the customer analysis;
- the determination of the Technical Axis by applying process mapping, capability indicators and product parts. The team identified those technical features that were critical to satisfy the customer targets;
- the calculation of Critical to Quality features by adopting the relationship matrix. This step was fundamental to create a prioritization to increase the performance level of the system. The relationships are shown at the intersection of the what and how, using different symbols. The team
calculated “how much” for each “how” multiplying every symbol rank with the importance of weightings in each column.
In this way, the team identified two main CTQ features: - extrusion process;
- wire cold drawing process;
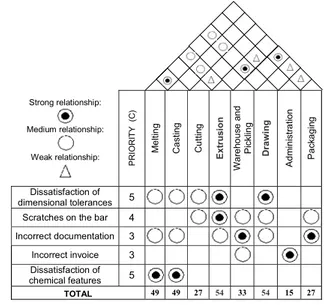
on which it had to focus for an immediate increase of the performance level of the manufacturing system. As shown in Figure 5, extrusion and drawing processes impact directly on “dissatisfaction of dimensional tolerances” and “scraps on bars”, that have an important priority on customer satisfaction. In particular they are connected by a strong relationship, as shown in the roof of the “House of Quality”.
Strong relationship: Medium relationship: Weak relationship: P R IO R ITY (C ) M e ltin g Ca st ing C u tti ng E xt rus io n W a re hous e a n d Pi ck ling Dr a w ing Adm ini st ra tio n Pac kagi ng Dissatisfaction of dimensional tolerances 5
Scratches on the bar 4
Incorrect documentation 3
Incorrect invoice 3
Dissatisfaction of
chemical features 5
TOTAL 49 49 27 54 33 54 15 27
Fig 5: “House of Quality” MEASURE PHASE
The goal of this phase is to map and measure the manufacturing system understanding the company performance level. For this reason the team focused on the main critical processes in order to collect all data and information that could be useful for the analysis phase [13].
As shown in the “House of Quality” the main CTQs were extrusion and drawing processes.
Extrusion process
Extrusion is defined as the process of shaping material by forcing it to flow through a shaped opening in a die. Extruded material emerges as an elongated piece with the same profile as the die opening. Press size determines how large of an extrusion can be produced. The IPO of Figure 6 shows the main inputs and output of an extrusion process. It is possible to understand that the quality of the final product (brass bar) is defined by different factors, in particular the temperature of the billet, the speed, the feed, the maintenance or the temperature of the die. In fact in extrusion a wide variety of shapes can be made, but there are limiting factors to be considered. These include size, shape, alloy, extrusion ratio, tongue ratio, tolerance, finish, factor, and scrap ratio. If a part is beyond the limits of these factors, it cannot be extruded successfully.
The project company has an indirect extrusion press in which the billet remains stationary while the die assembly,
located on the end of the ram, moves against the billet creating pressure needed for metal to flow through the die.
Fig 6: Extrusion process IPO
Studying and analyzing the extrusion process, the LSS team developed an effective data collection sheet. It was fundamental to understand which were the main factors that should be monitored. Involving the operators and the main figures of the production department in a brainstorming meeting, it was important to define a data sheet considering new elements and variables, and eliminating obsolete data from the old format. The team focused on three fundamental aspects of the process: the die, the billet and the final bar diameter. For example the “Die code” (i.e. A, B or C) indicated the number of dies applied to realize a batch. Usually the operators used a die for 4 “pressing” activities and then they substituted it with a new device. This procedure was due to operator experience. Nevertheless during the different pressing activities the die lost its performance. For this reason the team wanted to study the “die port dimensions and temperature” before and after its application on the press, understanding if there was a correlation between process capability and die features. In particular a die was characterized by two ports to realize two bars simultaneously. In this case it was also possible to compare the quality of two bars made by the same die in the same time.
The final goal of this collection was the study of the process variability identifying the main critical factors.
To increase the effectiveness of the analysis the team required a double control for every extruded rod (100% inspection): at the top and the down of the bar. In this case involving two inspectors it was possible to obtain a significant number of data. Nevertheless in order to verify the reliability (repeatability and reproducibility) of the inspectors the team deployed a measurement system analysis (MSA). Recreating measurement procedures the inspectors measured a sample of 10 bars for three times. For every sample bar the team had calculated a reference value. The results, Table 4, showed that the measurement system (inspector) was not satisfactory and thus it was necessary a training for operators to define a new effective procedure (where, what, and how) to obtain reliable measurements, see Improve Phase.
Using data collection it was necessary to develop a stability and capability evaluation of the extrusion process per every extruded item. Table 5 shows that the process was under control for a significant number of items and the different
behaviors of the diameter distributions could be approximated to a normal curve.
Source Variance Standard Deviation % Contribution p Value Total Measurement (Gage) 0.00221 0.047010637 100.00%
Repeatability 0.0018025 0.042455859 81.56%
Reproducibility 0.0004075 0.020186629 18.44%
Operator 0.00011139 0.010554093 5.04%
Oper * Part Interaction 0.00029611 0.017207879 13.40% 0.2837
Product (Part-to-Part) 0 0 0.00%
Total 0.00221 0.047010637 100.00%
USL 27.04
LSL 26.65
Precision to Tolerance Ratio 0.72324057
Precision to Total Ratio 1
Resolution 0.0
Tab. 4: MSA results
Nevertheless the Cpk indicators were significantly lower than the acceptable value, confirming the evaluation deployed during the “define” phase. The main critical items were T17 and T22 on which the team had to focus for an immediate improvement of the performance level of the extrusion system, see Analysis Phase.
Item Control Distribution Normal Cpk dpm
T17 N Y 0.29 206,157 T18 Y Y 0.52 109,139 T22 Y Y 0.39 219,392 T24 Y Y 0.46 144,181 T25 N Y 0.85 5,118 T26 Y Y 0.67 20,795 T30 Y Y 0.87 8,844 T33 Y Y 0.59 73,126 T34 N Y 0.65 25,534 T35 Y Y 0.41 117,976
Tab. 5: Stability and capability analysis results Cold wire drawing process
As shown in QFD analysis, the wire drawing process represented a critical to quality feature. Wire drawing is a metal-reducing process in which a wire rod is pulled or drawn through a single die or a series of continuous dies, thereby reducing its diameter. Because the volume of the wire remains the same, the length of the wire changes according to its new diameter. Various wire tempers can be produced by a series of drawing and annealing operations. The final wire size is reached as the wire passes through the last die in the series.
The LSS team measured the wire drawing process in order to understand and analyze the behaviors of the main process parameters. The goal of the drawing process is to reduce the bar diameter and finish the rod surface. For this reason it was important to know which process parameters could impact on the voice of the customer.
The team developed a data collection sheet involving the operators and the main figures of the manufacturing department. It was fundamental to understand the different process parameters (i.e. code, lubrication, rod diameters, cycle time). Usually capability of a cold shape forming process (such as drawing process) is higher than capability of a hot shape
Extrusion process Operator Maintenance Operator Ex. Temperature Billet Temp Speed Die Raw Material Feed Equipments Pression Brass Bars
forming process (such as extrusion process). The team confirmed this assumption calculating wire drawing performance indicators for every item. The process capabilities were satisfactory (Cpk > 1). However, it was also important to study the lead time of the process. In fact a cold drawing process can be characterized by a significant number of bottle necks if the raw material (extruded bars) does not comply with the drawing process requirements. For example a significant over metal of extruded rods could damage the die or block the process activities unexpectedly. For this reason the PCE (Process Cycle Efficiency) calculation was necessary [14]:
time lead Total time added Value PCE=
in order to measure the efficiency level of the process.
The main goal was to improve the system eliminating defects and non value added activities for customer, because they were costs and money for the company and therefore a reduction of the price-cost margin. It is possible to define “value” as a set of activities and processes that concur to fulfill the explicit and implicit expectations of customer. The value added activities and processes define the value stream. It is the only necessary stream to satisfy the market demand.
In this way the team had to focus on those activities that were essential for the system eliminating, or at least reducing, all remaining processes, that were source of additional costs. Using Time Value Map diagram [15], the team measured which were the main value added activities. Figure 7 shows the value analysis for an internal batch realization (500 bars).
Fig 7: Time value map of the wire drawing process
The Process Cycle Efficiency index is equal to 52%. Therefore a significant number of the process activities did not concur to create “value” impacting on the total lead time.
The last step of the measurement phase was a global analysis of the other involved processes. For every process the team calculated the yield considering all items and checking a significant number of batches. A further analysis was only necessary for the “delivery” process. In fact the yield was equal to 0.94. It was also interesting to calculate the PCE indicator of the whole manufacturing system, considering the main processes, storages and control activities. The value added activities impacted only on 23.2% (PCE) of the total company lead time.
ANALYZE PHASE
The main goal of the analyze phase is to assess and study the collected data and information in order to identify the main causes and sources of variability [16]. This phase should be the starting point of the improvement action plan.
In this project, the first step was a study of the CTQs established in the define phase and collected in the measure phase.
The team developed a Kaizen Blitz on the manufacturing stream that allowed to find the defect sources. It must be noted
that all operators were involved in the deployment of the project, and their advice and actions led to the final success. The Kaizen Blitz highlighted a significant number of defect sources related to effectiveness and efficiency.
Extrusion process analysis
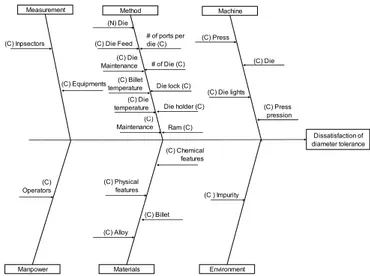
The first step of the analysis phase was a qualitative assessment of the possible variability sources of the bar diameter dimensions using a Cause – Effect diagram. The team involved the main employees of the extrusion process department in a meeting. Using an Ishikawa diagram it was possible to divide the different defect and variability sources into six classes (6M), as shown in Figure 8.
Fig 8: Extrusion process Cause – Effect diagram
For every class the team listed a number of defect causes on which it was important to focus to obtain an immediate improvement, as follows:
- machine: it was indisputable the significant contribution of the press and its components on the variability of the whole system. For example the functionality of the press engine, the die ram, the main cylinder of the billet, the container, the die lock, the die holder or the press/billet oven could impact directly on the value of the bar diameter. For this reason, in the measure phase the team had collected information and data in order to study the behavior of these critical parameters.
- method: the setting of the main press parameters had a fundamental effect on the performance level of the extrusion process. In fact extrusion speed varies directly with metal temperature and pressure developed within the container. Temperature and pressure are limited by the alloy used and the shape being extruded. Lower extrusion temperatures will usually produce shapes with better quality surfaces and more accurate dimensions. Lower temperatures require higher pressures. Sometimes, because of pressure limitations, a point is reached where it is impossible to extrude a shape through a given press. The preferred billet temperature is that which provides acceptable surface and tolerance conditions and, at the same time, allows the shortest possible cycle time. The ideal is billet extrusion at the lowest temperature which
Set up
16.30 min
Bar Calibrat ion
14.30 min Testing 10.20 min Production 42.20 min Packaging 2.00 min Value added activities
Lead time Non Value added activities
(C) Inpsectors
Measurement Method Machine
Manpower Materials Environment
Dissatisfaction of diameter tolerance (C) Equipments (C) Die temperature (C) Maintenance (C) Billet temperature (C) Die Maintenance (C) Die Feed (N) Die Ram (C) Die holder (C) Die lock (C) # of Die (C) # of ports per die (C) (C) Press pression (C) Die lights (C) Die (C) Press (C) Operators (C) Alloy (C) Billet (C) Chemical features (C) Physical features (C ) Impurity
the process will permit. At excessively high billet temperatures and extrusion speeds, metal flow becomes more fluid.
- man: the experience of the extrusion process operators could impact on the variability of the diameter dimensions of a bar. In fact they could intervene in order to change the process parameters if the extrusion did not satisfy the requirements. A definition of a clear and rigorous procedure could be necessary;
- material: the chemical and physical features of the raw material were fundamental to satisfy the customer requirements. These characteristics of the alloy could influence the other process parameters and therefore the performance level of the system. For this reason a further study of the casting process data could be important; - measurement: the unacceptable measurement system
(inspectors, equipments) could affect the performance level of the whole system maintenance, therefore a study of the measurement system reliability was necessary (as shown in “measure” phase);
- mother nature: a last important aspect of the extrusion process was the presence of impurities inside the die during the extrusion process activities. This fact was due to the environmental conditions of the department. The team associated a letter (i.e. C, N, or X) to classify every cause. The main causes were “C”, therefore it was possible to study and eliminate them to improve the performance level of the system. For this reason the team studied and interpreted different diagrams. In order to deploy an effective quantitative analysis of the extrusion process, the team evaluated the main process parameters using different tools, such as run-charts, box-plots, control charts or histograms, focusing immediately on the critical items (T17 and T22). The analysis was developed studying process capability stratified per die, die ports, process temperature and speed.
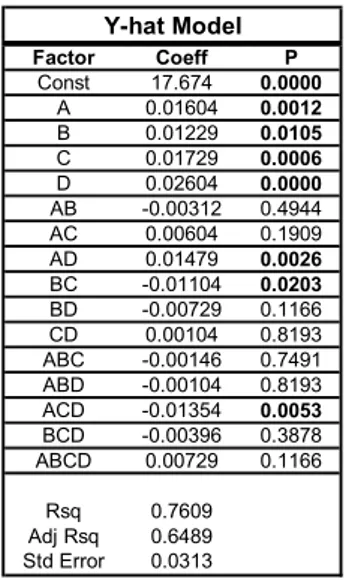
In the light of these results the team decided to deploy a full factorial design (2k, k = 4) considering four input factors (die - A, die port - B, die temperature – C, extrusion process speed - D) and the bar diameter (DIA) as response (output).
For every factor, the team defined two main levels: - die: A; B = (1; -1)
- die port: 1; 2 = (1; -1)
- die temperature: H (t > 625°C); L (t < 625°C)=(1; -1) - extrusion process speed: H (high); L (low)
The experiments were deployed following the common operating procedures of the extrusion process for three repetitions per each run. Table 6 (Analysis of Variance) shows that all factors impacted on the final result. In particular substantial contributions due to interactions between die / speed, die port / die temperature and die / die port / speed may be observed. It was possible to note that the model represents the system with a good approximation (Rsq = 0.76 and AdjRsq = 0.64). The residual histogram was a normal distribution. This experiment provided a significant number of information in order to improve the performance of the system. A first consideration was related to speed of the press in order to maintain a low temperature of the die. The maintenance of the die and the cleaning method of its ports could impact on the results. For this reason the team defined a list of improvement actions. For example it was important to identify a new procedure in cleaning the ports of the die using an air
compression device rather than a paper sheet applied by the operator handily. A review of the press pressure was necessary in fact it was noted a different performance of die ports.
Y-hat Model Factor Coeff P Const 17.674 0.0000 A 0.01604 0.0012 B 0.01229 0.0105 C 0.01729 0.0006 D 0.02604 0.0000 AB -0.00312 0.4944 AC 0.00604 0.1909 AD 0.01479 0.0026 BC -0.01104 0.0203 BD -0.00729 0.1166 CD 0.00104 0.8193 ABC -0.00146 0.7491 ABD -0.00104 0.8193 ACD -0.01354 0.0053 BCD -0.00396 0.3878 ABCD 0.00729 0.1166 Rsq 0.7609 Adj Rsq 0.6489 Std Error 0.0313
Tab. 6: Summary of ANOVA pertaining to response (bar diameter - DIA);single factors (i.e. die - A, die port - B, die temperature – C, extrusion process speed D) are significant as
some their interactions Wire drawing process analysis
As shown in the measurement phase, the cold drawing process showed a strong capability. The real problem was due to a lack of efficiency of the main process activities. In fact the PCE indicator (Process Cycle Efficiency) was equal to 52% therefore a significant number of the process activities did not concur to create “value” to customer, impacting on the total lead time. For this reason the main analysis focused on the non value added activity elimination. The first step was the definition of the meaning of the “value” for the cold drawing process.
During a meeting the team identified all causes that created non value added activities, divided per class:
- man: the experience of the changeover operators could impact on the non added activity creation. In fact their ability and capability to deploy the machine changeover and start up had an important effect on the PCE indicator; - materials: the chemical and physical features of the raw
material could be a source of non added value activities. In fact material features could block the machine during the production (i.e. scraps on the dies etc…);
- measurement: the control of the bar diameter could represented an over processing activities;
- method: the set-up procedure represented a significant part of non value added activities. The SMED application could be the best solution in order to reduce the set-up time. A further scrap was that part of the bar rejected during the start up time;
- machine: different problems (die performance, roll effectiveness) due to a lack of maintenance could afflict the efficiency of the cold drawing process;
- mother nature: layout of the manufacturing site defined a significant part of NVA such as transportations and motions;
The team deployed an improvement action plan. For example in order to reduce the set-up time it was necessary the application of the SMED (Single Minute Exchange of Die), see Improve Phase.
The last step of the analysis phase was a global evaluation of the other processes, involving the operators to identify different wastes. In particular a critical step was the delivery process of the bars. In this case the main defect causes were: missing information, incomplete information and wrong information. For this LSS project the top management decided to focus only on the main processes (extrusion and drawing processes). The optimization of the other steps will be deployed in future projects.
IMPROVE PHASE
The improvement phase was deployed by the application of effective tools and feasibility analysis. The goal was to eliminate the defect sources and to reduce the variability causes [17]. In order to improve the effectiveness of the extrusion process inspectors, the team deployed a training to explain the main measurement procedures. For example the team showed how the operators should control the pieces in particular taking into account critical samples. After the training deployment the repetition of a new MSA showed a significant increase of the measurement system effectiveness (40%). In order to maintain the obtained results the team prepared a standard operation sheet (SOP), explaining the main guidelines of the inspection process.
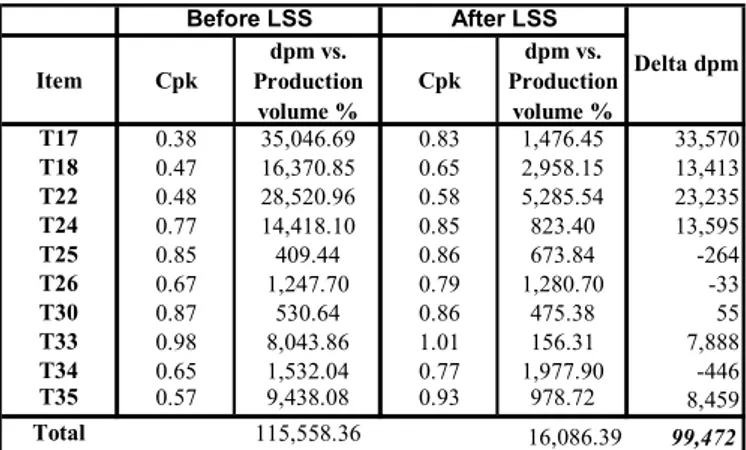
The analysis phase highlighted the main critical parameters that could impact on the process variability. Implementing a maintenance action on the press (in particular on the ram piston) the team obtained the same “push” pressure on the die surface eliminating the “port” type effect (1 or 2). The same way it was possible to define a new procedure to clean the die port using compressed air, avoiding to damage the port light during the changeover operations. The team set pressing speed on the low level increasing the die performance level. Table 7 shows the capability analysis before and after improvement action implementation. It is possible to note a global increase of the process performance.
In the light of the results of analysis phase, the LSS team focused on the increase of the efficiency of the drawing process. In fact the capability analysis had shown a good performance of the process for each item.
The real problem was a significant number of non added value activities that afflicted the drawing process impacting on the total lead time. For this reason the team decided to apply the SMED tool [18,19]. The first activity was the calculation of the duration of the changeover. (equal to 41.20 min). The second improvement activity was a mapping of the main steps of the changeover process. It was necessary to divide these activities in internal and external processes.
Internal processes were activities that an equipment operator performed while the production line was idle. The external processes were activities deployed while the line was still running. For every process the team made a checklist of all parts and steps required in the current changeover, including names, specifications, numeric values for all measurements and dimensions, part number and further special settings. The team
identified problems and waste associated with changeover activities moving internal processes towards external processes.
Item Cpk dpm vs. Production volume % Cpk dpm vs. Production volume % T17 0.38 35,046.69 0.83 1,476.45 33,570 T18 0.47 16,370.85 0.65 2,958.15 13,413 T22 0.48 28,520.96 0.58 5,285.54 23,235 T24 0.77 14,418.10 0.85 823.40 13,595 T25 0.85 409.44 0.86 673.84 -264 T26 0.67 1,247.70 0.79 1,280.70 -33 T30 0.87 530.64 0.86 475.38 55 T33 0.98 8,043.86 1.01 156.31 7,888 T34 0.65 1,532.04 0.77 1,977.90 -446 T35 0.57 9,438.08 0.93 978.72 8,459 Total 115,558.36 16,086.39 99,472 Before LSS After LSS Delta dpm
Tab. 7: Process capability before and after Lean Six Sigma For example the first important activity was the definition of a new procedure to establish the preparation of necessary changeover equipments before the machine setup. Another solution was to remove the old die as soon as possible during the old production. It was also necessary to reduce the new die installation involving a line operator to help the changeover operators for deploying elementary activities. Another important improvement step was a complete review of the maintenance procedures reducing the “scratches on the bar” defect category. The adopted solution was the use of an air compression device to clean the die port every changeover process. To maintain the obtained results the team defined a standard operation sheet (SOP) establishing a work sequence for every operator. These actions enabled to increase the wire drawing PCE indicator by 15% (6% considering whole manufacturing system).
The last improvement actions of this project focused on the performance increase of the delivery process. In this case the team deployed a training to the administrative employees in order to explain them the main mistakes and problems incurred during the delivery process. The main mistakes were associated to shipment documentations. Implementing an effective procedure it was possible to avoid possible errors and mistake during the preparation of the delivery documents.
CONTROL PHASE
The main goal of the control phase was to maintain and sustain the obtained results [20,21]. For this reason the team created a general control plan monitoring the main key performance indicators. In particular the team defined a control plan for each involved department (extrusion, cold drawing and supply chain dpt.). The same time the cold drawing productivity followed the obtained values during the improvement phase. In the light of the improvement actions it was possible to calculate an economical analysis of the Lean Six Sigma implementation. Before Lean Six Sigma the extrusion process yield was 87.1% with a global capability of 0.66. In applying the Lean Six Sigma methodology the new yield was 98.7% and the dpm reduction was 99,500 pieces. Supposing to eliminate an inspector at the end of the extrusion process (this choice can be justified by the obtained increase of the process capability) a further saving can be obtained. The
total COPQs reduction was equal to 681,291.12 €/year. It is more difficult to reduce the scrap COPQs. In fact the extrusion process has always a physiological scrap due to the machine start-up. It will be suitable to plan a new Lean Six Sigma project in order to study and eliminate this problem as soon as possible. Considering the cold drawing process, the reduction of the internal activities of the changeover enabled to increase the productivity of 10%. This aspect can increase the company gains (150,000.00 €/year). Another important aspect of the cold drawing process improvement was related to the definition of a new maintenance procedure. This action can impact on the external yield directly. In fact the new technique in cleaning the die ports should abate the “bar scratches” complaints of the customer allowing further savings. The same way the administrative employee training, deployed to avoid errors and mistake on delivery documents, should reduce the COPQs of management and penalties.
CONCLUSIONS
This project wants to demonstrate the effectiveness of the Lean Six Sigma methodology in increasing process capability and reducing non value added activities in a SME. The improvement actions applied to the extrusion and cold drawing processes enabled a saving of 800,000 €/year.
The possibility to extend this approach to whole manufacturing system will able to provide further gains and savings. Lean Six Sigma was a new method for this company and the obtained results will push it to create an apposite infrastructure that offers a tactical approach to determinate the best solutions for a given situation. In particular this project shows that Lean Six Sigma gives employees the opportunity to make the difference involving them in the root cause investigation and the improvement action decisions. This aspect is very important in this context, where an effective definition of operator efforts can be decisive in order to obtain significant savings.
The main recommendations are to standardize the improvement procedures (SOPs) showed in this project, and to undertake new projects following a rigorous and structured roadmap such as DMAIC. The project highlights also the power of the statistical tools (i.e. ANOVA, DOE, Hypothesis test) to increase the capability of processes characterized by many factors and parameters. For the future it will be important to focus on other departments of the company identifying the main goals that we would like to reach, the project owners, the VOC and the VOP (at start and gap). In particular it will be fundamental to involve employees in a root cause investigation and a quantitative analysis using statistical tools.
REFERENCES
[1] George, M., 2002, Lean Six Sigma, McGraw-Hill, New York, pp.7-8
[2] Wheat, B., Mills, C., Carnell, M., 2003, Leaning Into Six Sigma, McGraw-Hill, New York.
[3] Pyzdek, T. 2003., The Six Sigma Handbook, McGraw-Hill, New York, NY, pp. 121-122.
[4] Aggogeri, F., Gentili, E., 2006, Lean Six Sigma: la nuova frontiera per la qualità, Franco Angeli, Milan, Italy (in Italian), pp. 21-24.
[5] Stamatis, D.H., 2002, Six Sigma and Beyond: Foundations of Excellent Performance, St. Lucie Press, New York, NY, vol.1, pp.71-72.
[6] Liker, J.K., 2004, The Toyota Way. 14 Management Principles from the World’s Greatest Manufacturer, McGraw-Hill, New York, pp 15-17.
[7] George, M., Rowlands, D, Kastle, B., 2004, What is Lean Six Sigma?, McGraw-Hill, New York
[8] Oakland J.S., 2003, Statistical Process Control, Butterworth-Heinemann, Oxford, pp.51-52.
[9] Adams C., Gupta P., Wilson C., 2002) Six Sigma Deployment, Butterworth-Heinemann, New York. [10] Brassard M., Ritter D., 1994, The Memory Jogger,
GOAL/QPC, Salem, NH, pp.56-58.
[11] Juran, J.M, Godfrey, B.A., 1999, Juran’s Quality Handbook, McGraw-Hill, New York, NY, pp.73-74. [12] Re Velle, J.B., Moran, J.W., Cox, C.A., 1998, The QFD
Handbook, John Wiley and Sons Inc., New York, NY, pp. 13-15.
[13] Brue G., 2002, Six Sigma for Manager, McGraw Hill, Inc. New York.
[14] George M.L. (2002), Lean Six Sigma for Service, McGraw Hill, Inc. New York, pp. 26-27.
[15] Bicheno, J., 2000, The Lean Toolbox. PICSIE Books, Buckingham
[16] Pande, P.S., Neuman, R.P., Cavanagh, R.R., 2000, The Six Sigma Way. How GE, Motorola, and Other Top Companies are honing their performance, McGraw-Hill, New York, NY.
[17] Womack, J.P., Jones, D.T., 2005, Lean Solutions. How Companies and Customers can create Value and Wealth Together, Simon & Schuster, London, UK. [18] Six Sigma Academy, 2002, The Black Belt Memory
Jogger, GOAL/QPC, Salem, NH.
[19] MacInnes, R.L., 2002, The Lean Enterprise Memory Jogger, GOAL/QPC, Salem, NH, pp.55-62.
[20] Stamatis, D.H., 2002, Six Sigma and Beyond: Foundations of Excellent Performance, St. Lucie Press, New York, NY.
[21] Pande, P., Holpp, L. 2002, What is Six Sigma?, McGraw-Hill, New York, NY.