Alma Mater Studiorum – Università di Bologna
FACOLTA’ DI INGEGNERIA
DOTTORATO DI RICERCA IN
BIOINGEGNERIA
Ciclo XXII
Settore scientifico-disciplinare di afferenza: ING-INF/06
Tesi di Dottorato
PERCEZIONE DELLA DIREZIONE DEL
PROPRIO MOVIMENTO: DALLA
REGISTRAZIONE DELL’ATTIVITA’
CORTICALE AL MODELLO
COMPUTAZIONALE
Candidato: Ing. Chiara Carrozzini
Supervisore:
Chiar.mo Prof. Ing. Angelo Cappello
Co-supervisori:
Chiar.mi Prof. Salvatore Squatrito,
Dott.ssa Milena Raffi (Dip. Fisiologia
Umana e Generale, Bologna)
Controrelatore:
Chiar.mo Prof. Ing. Mauro Ursino
Acknowledgements
I am grateful to Prof. Angelo Cappello, my official advisor, for providing the intellectual and personal support to the project and for financially supporting part of my graduate research. He constantly followed my progresses and always helped me with his suggestions, that improved significantly the theoretical and mathematical aspects of this thesis. I admire the way he encouraged me and helped me in becoming a more independent researcher, without even making me notice it.
Neuroscience is a vast field: without the guidance provided by Prof. Salvatore Squatrito and Milena Raffi I would have easily got lost. Their knowledge and passion for research have always been a constant source of motivation. I have always enjoyed the discussions with them, because every day I could learn something new. Prof. Squatrito helped me understand the importance of devotion to research and uprightness. Milena, with her constant good humor and smile, cheered up the long days of experiments and data analysis in the lab. I would alsothank Andrea Meoni for sharing his knowledge and kindness on animal caring.
I would also mention Prof. Mauro Ursino, who was the first who introduced me to Neuroscience and neuronal model network during the University years with clarity and professionalism.
Abstract
The main aim of this thesis is strongly interdisciplinary: it involves and presumes a knowledge on Neurophysiology, to understand the mechanisms that undergo the studied phenomena, a knowledge and experience on Electronics, necessary during the hardware experimental set-up to acquire neuronal data, on Informatics and programming to write the code necessary to control the behaviours of the subjects during experiments and the visual presentation of stimuli. At last, neuronal and statistical models should be well known to help in interpreting data.
The project started with an accurate bibliographic research: until now the mechanism of perception of heading (or direction of motion) are still poorly known. The main interest is to understand how the integration of visual information relative to our motion with eye position information happens. To investigate the cortical response to visual stimuli in motion and the integration with eye position, we decided to study an animal model, using Optic Flow expansion and contraction as visual stimuli.
In the first chapter of the thesis, the basic aims of the research project are presented, together with the reasons why it’s interesting and important to study perception of motion. Moreover, this chapter describes the methods my research group thought to be more adequate to contribute to scientific community and underlines my personal contribute to the project.
The second chapter presents an overview on useful knowledge to follow the main part of the thesis: it starts with a brief introduction on central nervous system, on cortical functions, then it presents more deeply associations areas, which are the main target of our study. Furthermore, it tries to explain why studies on animal models are necessary to understand mechanism at a cellular level, that could not be addressed on any other way. In the second part of the chapter, basics on electrophysiology and cellular communication are presented, together with traditional neuronal data analysis methods.
The third chapter is intended to be a helpful resource for future works in the laboratory: it presents the hardware used for experimental sessions, how to control animal behaviour during the experiments by means of C routines and a software, and how to present visual stimuli on a screen.
The forth chapter is the main core of the research project and the thesis. In the methods, experimental paradigms, visual stimuli and data analysis are presented. In the results, cellular response of area PEc to visual stimuli in motion combined with different eye positions are shown. In brief, this study led to the identification of different cellular behaviour in relation to focus of expansion (the direction of motion given by the optic flow pattern) and eye position. The originality and importance of the results are pointed out in the conclusions: this is the first study aimed to investigate perception of motion in this particular cortical area. In the last paragraph, a neuronal network model is presented: the aim is simulating cellular pre-saccadic and post-saccadic response of neuron in area PEc, during eye movement tasks.
The same data presented in chapter four, are further analysed in chapter fifth. The analysis started from the observation of the neuronal responses during 1s time period in which the visual stimulation was the same. It was clear that cells activities showed oscillations in time, that had been neglected by the previous analysis based on mean firing frequency. Results distinguished two cellular behaviour by their response characteristics: some neurons showed oscillations that changed depending on eye and optic flow position, while others kept the same oscillations characteristics independent of the stimulus. The last chapter discusses the results of the research project, comments the originality and interdisciplinary of the study and proposes some future developments.
List of Figures
Pag.
Figure 1: Optic Flow as seen from an airplane 7
Figure 2: Optic Flow of a fly flying forward and rotating 8 Figure 3: Optic Flow pattern as seen by a fly flying forward and rotating
9
Figure 4: Optic Flow while hovering 10
Figure 5: A collection of retinal-flow fields 13
Figure 6: Central nervous system 22
Figure 7: Four areas of the cerebral cortex 23
Figure 8: The six layers of the cortex 26
Figure 9: Orientation sensitivity of columns in the striate cortex 27
Figure 10: Two cytoarchitectonic maps of the cortex 28
Figure 11: Main areas of the brain 33
Figure 12: Comparison between human and macaque brains 37
Figure 13: Area MST, VIP, 7a, STP and PEc in the macaque brain 39
Figure 14: Typical neuron physiology 42
Figure 15: Schematic of recording technique used with behaving monkey
45
Figure 16: Example of a raster plot 49
Figure 17: Temporal averaging of neural spikes to calculate mean firing rate
51
Figure 18: Mean firing rate calculated over several trials 52
Figure 19: Example of a neuronal network 53
Figure 20: Two general kinds of connections between neurons 55 Figure 21: Symmetric cross-correlogram of two cells activity 56
Figure 22: Another symmetric cross-correlogram 57
Figure 23: Cross-correlogram with a peak 57
Figure 24: Experimental paradigms 67
Figure 25: Behavioral protocol 72
Figure 26: Retinotopic, retinotopic eye-position and non retinotopic tasks
75
Figure 27: Text file format generated by the acquisition system 76 Figure 28: Output text files with mean frequences over time 78
Figure 29: Two conditions of stimulation 81
Figure 31: Response of a PEc neuron to luminous bar and translational visual stimuli
86
Figure 32: Response of a PEc neuron to all stimuli 87
Figure 33: Spike density plot (50 ms bin) and regression planes for FP/FOE positions of non-retinotopic EP test in two cells
91
Figure 34: Comparison of the same retinal stimulation at different eye positions
93
Figure 35: Comparison of the same retinal stimulation at different eye positions, by means of a total least square linear regression method
94
Figure 36: Comparison of regression planes in retinotopic and retinotopic EP tests, in four cells
96
Figure 37: Anatomy of the recording regions 97
Figure 38: Saccade behavioural task 98
Figure 39: Directional curve of real data and simulated 105
Figure 40: Experimental paradigm 109
Figure 41: Output text file of the acquisition system 115
Figure 42: Raster plot of the activity of a neuron 116
Figure 43: Raster plot of the activity of a neuron during the presentation of a particular combination of FOE/FP positions
116
Figure 44: Spline interpolation of the PSTH discrete values, for the response to expansion optic flow
118
Figure 45: Spline interpolation of the PSTH discrete values, for the response to contraction optic flow
118
Figure 46: Spline interpolation of the PSTH discrete values, for the response to expansion optic flow
120
Figure 47: Spline interpolation of the PSTH discrete values, for the response to contraction optic flow
Table of Contents
Acknowledgements ... i Abstract ... ii List of Figures ... iv 1. Introduction ... 1 1.1. Overall aim ... 11.2. Why study perception of motion? ... 2
1.3. Perception of motion ... 5
1.4. Main contribution and organization ... 18
2. Background ... 19
2.1. Animal research in brain studies ... 21
2.2. Organization of the nervous system ... 21
2.2.1. Association areas ... 31
2.3. Non-human primates vs. human brain ... 34
2.3.1. Perception of motion in the macaque cerebral cortex ... 38
2.4. Electrophysiology ... 42
2.5. Neural data analysis ... 47
3. Hardware and software for neurophysiologic experiment with behaving monkey ... 59
3.1. Hardware for neural data acquisition ... 59
3.2. Behaviour control during experiments ... 61
3.3. Visual stimuli presentation ... 64
4. Multimodal representation of optic flow processing in monkey area PEc ... 69
4.1. Methods ... 70
4.1.1. Experimental paradigm and stimuli ... 70
4.1.2. Data analysis... 76
4.2. Results ... 82
4.4. Model of a neuronal network for eye position coding... 103
4.4.1. Experimental paradigm ... 104
4.4.2. Data analysis... 105
4.4.3. Results and neuronal model ... 107
5. Spike train oscillation modulated by optic flow stimuli in area PEc ... 111
5.1. Methods ... 114
5.1.1. Experimental paradigm and stimuli ... 114
5.1.2. Data Analysis ... 116
5.2. Results ... 122
5.3. Conclusions and Discussion ... 123
7. Overall Conclusions and Discussion ... 127
Bibliography ... 133
1.
Introduction
“
The body, by the place which at each
moment it occupies in the universe,
indicates the parts and the aspects of
matter on which we can lay hold:
our perception, which exactly
measures our virtual action on things,
thus limits itself to the objects which
actually influence our organs and
prepare our movements.”
Henri Bergson
This chapter has the aim of introducing the topic of the thesis: fist, the overall aim of the research project is presented, then the reason why it is important to study mechanisms of the perception of motion is discussed. The third paragraph concentrates on how perception of motion has been studied until now. The last paragraph presents the personal contribution of the author to the research project.
1.1. Overall aim
The principal subject of this work is the investigation of the mechanism of the visual perception of space and motion. There’s a question researcher and scientists of many fields have tried for a long time to address: how do we see the world around us?
“The questions is at once a theoretical one, a factual one and a practical one. The theories to be considered have to do with the history of philosophy and psychology. The facts come from psychology, physics and physiology. The applications extend to art, aviation, photography and mountain-climbing.” (Gibson 1950)
The problem of visual perception has a long history and scientists concentrated on the need of explaining why things are seen. It has long been known that vision depends on retinal picture, but these static images seem inadequate when compared with the result we perceive of scenes with depth, distance, solidity. The most amazing aspect of vision is how the third dimension that characterizes the world we live in is restored in perception. But vision also provides a major source of information for the control of self-motion. It’s very difficult to walk to a goal with eyes closed. The visual motion we experience as a result of walking, running, driving, is a powerful signal to control the parameters of our own movements.
A main question is: how can men perceive the direction of their motion?
1.2. Why study perception of motion?
The theoretical approach to understand how visual perception happens started at the beginning of world war II, concomitantly with a sudden need to understand the perception of depth and distance applied to aviation. A critical task was to evaluate the distance from the ground while landing.
Researchers defined a list of cues for the perception of distance, classified in monocular and binocular. The “air theory” seemed to underlie the earlier researches: subjects were in darks rooms in which points, lines and subjects were presented. Later, the “ground theory” was hypothesized: there’s no perception of space without the perception of a continuous background surface. The experimenter started to study not the differences between two
object, but the variation in stimulation corresponding to a continuous background.
The main principles of such theory are:
• The elementary impressions of a visual world are those of surfaces (conceived as background) and edges (outline or figure against the background)
• Every variable in visual stimulation corresponds to a property of the spatial world.
• Many properties of visual space do not have any copy in the two-dimensional retinal image, but they may have correlates.
• The pattern of retinal images can be considered a stimulus.
• The problem of how we perceive the visual world can e divided into two separate problems: there’s the perception of spatial world, of colours, textures, surfaces, slopes, edges, shapes, and then there’s the world of significant things, as objects, places, people, symbols. The latter is too complex to be attended all at once, so our perception is selective.
When we look around in a room, we see a perfectly stable scene of floor and walls, with other familiar object at defines locations and distances. This is the
visual world. If we try to look at the same room in a different way,
concentrating on areas or patches of colored surfaces, edges, with only one eye, and paying attention to the whole range of what we can see, the scene starts to appear different. This is the visual field. Let’s underline the differences between these two visual perceptions.
The visual field has oval boundaries, even if hard to notice, it extends about 180° laterally and 150° up and down. If we close one eye, it even becomes smaller. It has a sharp, clear center but it loses details towards its boundaries:
it possesses a central-to-periphery gradient of clarity. The visual field shifts whenever the eyes perform a saccade, that is a rapid change of fixation point. If the shifts are wide, the head also moves in the same direction and as a result the boundaries of the visual field sweep across. In the field, as a projection, the background is not different from the objects, and every head movement produces a deformation of the visual field. In the visual field, the impression of distance never quite vanishes but it’s quite reduced.
The visual world, in contrast, is not delimited: floors and walls are seen as a continuous and we’re aware they extend backward behind our heads. Since it doesn’t have any boundaries, it doesn’t have a center. It is usually perceived with the eyes scanning around, so it’s always clear and sharp. One of the most familiar characteristic of the visual world is its stability: things possess a direction not respect to the margin of the visual field but of an external frame of reference which seems incomprehensible on the basis of retinal images. In the visual world, natural visual scenes have many items that can be considered as background or figures, and we can perceive if an object is in front of another and it hides part of it. When the head moves, visual world is not distorted: objects remain constant despite changes in the observer’s viewing position. Clear and certain distance perception is a characteristic only of the visual world.
When we interact with the environment, we’re usually active. Our head never remains in a fixed position, the adjustments in posture produce some changes in the position of our eyes in space. Shifts of the images on our retina occur all the time during vision, but the result is that vision is enriched rather than spoiled. It must be noted that motion of the image produced by head movements it’s not the same as that produced by eye movement: the former is a sensory correlate of locomotor behavior that deforms the image, while the latter is only a transpose of the image. All these information are important to determine what is called heading direction. Heading perception is the process of inferring the speed and direction of elements in a scene based on visual,
vestibular and proprioceptive inputs. Although this process appears straightforward to most observers, it has proven to be a difficult problem from a computational perspective, and extraordinarily difficult to explain in terms of neural processing.
1.3. Perception of motion
How can we perceive heading direction?
The visual information during locomotion, called Optic Flow (OF), is very important to perceive heading direction, and its value becomes apparent when OF is not matched to true locomotion. For instance, when the walls of a surrounding room are set into motion, toddlers that have just learned t walk fall, while adults modify their walking speed depending on OF (Lee 1980) (Prokop 1997). In stationary subjects, OF induces illusory feeling of self-motion and causes self-motion sickness after prolonged exposure.
The importance of OF for the control of heading and visual navigation was first recognized by J.J. Gibson. Over 60 years ago Gibson stated that we use optic flow (the pattern of motion flow available at the eye as an observer moves through their environment), rather than object position, to control our direction of locomotion. He noted that the visual motion in the optic array surrounding a moving observer radially expands out of a singular point along the direction of heading. This focus of expansion (FOE) position with respect to the fovea is a critical cue for heading perception. When the observer moves forward fixating his/her final destination, heading computation is a simple brain function (e. a. Warren 1988) (e. a. Warren 1991) (van den Berg 2000). Recovering heading from such an image would be trivial were it not for an issue called “rotational problem”: the problem is more difficult than Gibson’s analysis suggested. The analysis of motion in the optic array is complicated by the fact that the sensors of the visual systems, our eyes, are still respect to
the body: in real life, eye and head movements almost always occur together with the optic flow. Thus the observer experiences a retinal flow resulting from eye, head and body movements that change the FOE position with respect to the fovea. Eye rotation induces a coherent visual motion on the retina. To estimate heading accurately, the visual system must first decompose resulting complex vector fields into the component that is caused by the gaze shift and the component that results from our movement. Note that the visual system has to use retinal and not optic flow, as the basis of self-motion estimation.
How this is accomplished is not well understood yet, despite extensively studies. Different mechanisms have to be considered whether observer gazes at targets away from the FOE or he/she tracks a slowly moving object during locomotion. In any case, heading must be computed integrating retinal and extra-retinal signals.
Let’s see some characteristic of Optic flow we experiment in life.
When we move, for example flying on a plane or driving a car, distant objects like clouds and mountains move so slowly they appear still. The objects that are closer, such as buildings and trees, appear to move backwards, with the closer objects moving faster than the distant objects. Very close objects, such as grass or small signs by the road, move so fast they whiz right by you. There are clear mathematical relationships between the magnitude of the optic flow and where the object is in relation to you. If you double the speed which you travel, the optic flow you see will also double. If an object is brought twice as close to you, the optic flow will again double.
Also the optic flow will vary depending on the angle between your direction of travel and the direction of the object you are looking at. Suppose you are travelling forward. The optic flow is the fastest when the object is to your side by 90 degrees, or directly above or below you. If the object is brought closer to the forward or backward direction, the optic flow will be less. An object
directly in front of you will have no optic flow, and appear to stand still. However, since the edges of that forward object are not directly ahead of you, these edges will appear to move, and the object will appear to get larger. In Figure 1 different OF are shown:
• A passenger looking downward would experience a strong optic flow pattern due to the ground and rocks on the ground. The optic flow is faster directly below the aircraft. It is especially fast where the tall rock protrudes from the ground.
• Looking forward from the cabin, there is another optic flow pattern due to the upcoming rock and anything else the aircraft might be approaching. The circle directly at the center shows the FOE. The FOE tells the specific direction of motion. This OF is larger to the right of the FOE, due to the large rock, while to the left it’s smaller, due to the farther ground.
• Towards the upper left, the pilot would see no optic flow because this region of the visual field only has the sky.
Figure 2 shows an overhead view of a fly, and the resulting optic flows in the sideways direction. The figure on the left shows the dragon fly travelling forward. The optic flow travels from the forward to backward direction, and is generally faster sideways than in front. The figure on the right shows a fly rotating to the righ. Here the optic flow is to the left in all directions. OF can be also much more complicated: if the fly were flying on a curved path, the optic flow patterns would be a combination of these two patterns.
Figure 2: OF of a fly flying forward and rotating
Figure 3 shows the OF seen from the point of view of the fly, and with the 360 degree field of view flattened onto the screen. When travelling forward, the optic flow will diverge from the forward direction, flow backwards, and converge in the rear. When the fly is rotating, or yawing, to the right, the optic flow will be everywhere to the left. However in the directions along the axis of rotation, the optic flow will be zero.
Figure 3: OF pattern as seen by the fly of fig. 2
As already said, sensing OF is useful when interacting with the world.
Suppose you want to hover in one place. The best way to achieve this is to try to keep the OF zero everywhere (Figure 4). This method will only work if the rest of the world is still. What if the “world” is moving? Flies solved this problem swaying with the same rhythm as moving branches or grass.
Figure 4: OF while hovering
In avoiding obstacles, a large optic flow on one side warns of an approaching object. The clue may also be that the FOE is inside the obstacles, and the optic flow is expanding rapidly.
The field of heading perception mechanism has been extensively studied and reviewed. A large body of experimental and theoretical evidence has built up in support of the optic flow hypothesis (Lappe M. 1999). Recently, the use of simple egocentric direction (the sum of extra-retinal gaze direction and retinal location) has been offered as an alternative source of visual information (Rushton, Harris, et al. 1998). In the real world, optic flow and egocentric-direction strategies both provide information that can be used to reach a target. When displacing prisms are placed over the eyes during locomotion, the information provided by optic flow and direction-based strategies can be dissociated (Rushton, Harris, et al. 1998). Displacing prisms shift the image of the world on the retina by an amount corresponding to the power of the prism. The result is that objects that appear to be straight ahead when viewed through the prisms, are actually positioned to one side of the observer’s body midline. If observers use a simple egocentric-direction strategy to direct them to the target, then while wearing prisms they will attempt to walk directly towards the image of the target, rather than the target itself. The constant heading error (difference between the direction in which the participant is walking and the
actual direction of the target) induced by the prisms will cause them to walk a curved path. In contrast, flow-based locomotion strategies should be unaffected by prisms (apart from on the first step, when flow is not available). This is because displacing prisms do not change differential properties of the flow field such as the focus of expansion (FOE). Instead, they change the visual direction of the FOE. Thus, the FOE will still coincide with the image of the target to which one wants to walk and if FOE is used to control locomotion, the observer should walk along a straight path to the target. Rushton et al.’s study (1998) was the first to use the prism technique to dissociate egocentric direction from flow. The study has now been replicated and extended by several groups (Rogers e Allison 1999) (Rogers e Dalton 1999) (Wood 2000) (Harris e Carrè 2001) (e. a. Warren 2001).
It is now generally agreed that under some circumstances, participants walk a curved path and make heading errors consistent with the use of perceived egocentric direction. The debate now centers around how scene structure and optic flow information influence locomotion in addition to simple egocentric direction (Fajen e Warren 2000).
It has been argued that structure and flow cues could act directly, for example through the use of classic optic flow strategies (e. a. Warren 2001) and the use of motion parallax (Harris e Carrè 2001) or indirectly, by influencing the perception of egocentric direction (Rushton e Salvucci 2001).
For example, both static scene structure and changing structure (flow) are known to have an effect on perceived direction. Such an effect could play a part in the control of locomotion in addition to the possible direct use of flow to guide locomotion.
Heading detection during eye rotation
Experimental investigations of visual self motion perception have benefited from the availability of specialized 3D graphic workstations that can simulate motion through an environment in real time. The most basic experiment use linear movement in simple random-dot environments. The resulting visual motion is presented on a screen in front of a subject and heading judgements are determined either as a just noticeable difference or by a pointing response. For these simple linear movements without eye rotation FOE can be used as an indicatory of heading. Accuracy is largely independent of the 3D layout and density of the dots (e. a. Warren 1988). Large errors occur when the FOE is outside the visible area of the screen (Crowell 1991). The estimation of the FOE is mostly based on the pattern of directions of the individual dot movements, less on their speeds (e. a. Warren 1991).
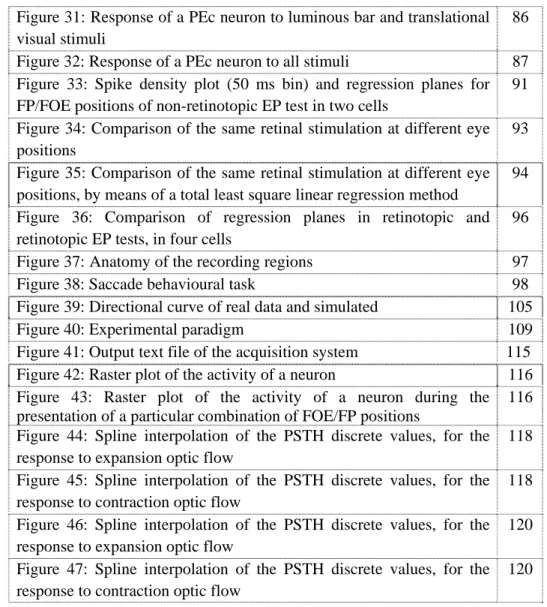
Figure 5: A collection of retinal-flow fields. The retinal flow experienced by a moving observer depends on translation, eye rotation, and the composition of the environment. Columns represent different environments: a flat horizontal plane (the ‘ground plane’), a 3-D volume of random dots, and a vertical wall. Rows represent different combinations of observer translation and eye rotation. (A–C) Pure forward movement in the absence of eye movement. The flow consists of a radial expansion. All motion is away from the focus of expansion (circle) which indicates heading. (D–F) Forward movement while gaze is directed towards an element in the environment. Heading is indicated by a cross, direction of gaze by a circle. An eye rotation is necessary to stabilize gaze onto the target element. The direction of this eye movement is coupled to the motion of the observer because it is along a flow line away from the heading point. Retinal flow becomes a superposition of the visual motion induced by forward movement and that induced by eye movement. The singular point no longer corresponds to heading, which is now on the target element in the direction of gaze, because
this point is stabilized on the retina. In the ground plane (D), the retinal flow obtains a spiralling structure. (E) demonstrates motion parallax: dots near the observer move fast and follow an expansion pattern. Their motion is dominated by the forward movement. Dots far from the observer move more slowly and in a more laminar, unidirectional pattern. Their motion is dominated by the eye rotation. The vertical wall (F) is a special case: the uniform motion introduced by the eye movement transforms the flow field such that a new center of expansion appears in the direction of gaze (circle). Often human subjects confuse this flow field with that of a pure forward movement (C) . The only difference between the two is the distribution of speeds in the periphery. (G–I) Forward movement (cross) with an eye rotation that tracks a horizontally moving target (circle). This target is not attached to the environment, thus the direction of the eye movement is uncoupled from heading. In G and I eye movement is towards the left, in H to the right. The flow field in G is reminiscent of the flow experienced during movement in a curve and human subjects sometimes confuse.
Visual versus extraretinal mechanisms
Eye rotation or combined eye-head rotation induce additional retinal image motion which modify the retinal flow pattern and uncouples retinal from optic flow. This upsets the use of solely FOE as an indicator of heading. Hence, a different strategy should be used. Two alternatives have been proposed. First, eye and eye-head rotations are usually accompanied by non visual or extraretinal signals. These encompass proprioceptive or vestibular signals or an internal copy of motor commands (“efference copy”). This hypothesis assume that extraretinal signals are used to compensate for the rotational components of retinal flow and to calculate the FOE.
The second hypothesis starts from the idea that retinal flow itself contains enough information to separate translational and rotational components. Studies on the contribution of visual and extravisual signals usually involve the paradigm of simulated eye movements (Rieger 1985) (e. a. Cutting 1986). The idea is to present retinal flow normally experience during combined translation and eye rotation to the stationary eye. In this case only visual
mechanism of heading perception can be used, because no extraretinal signal participate when the eye position is fixed.
During eye rotations and active head rotations heading errors are small. However, this result does not by itself prove that extraretinal signals are required because both extraretinal and visual signals are available (and congruent) in this situation. In the simulated eye movement paradigm, the conflict case, results are more variable. The initial study by Warren and Hannon (Warren e Hannon 1990) showed small errors, comparable to those observed during real eye movements, provided that the simulated scene contained large depth variations. Warren and Hannon modelled their stimuli after normal locomotor behavior. They simulated rather slow (up to 1.5 deg/s) eye movements that stabilized gaze on an environmental target. Banks and colleagues (Banks e Royden 1994) (e. a. Banks 1996) used higher rotation rates and simulated pursuit of an independently moving target. They found much larger errors, up to 15 degrees for rotation rates of 5 deg/s. They suggested that direct visual estimation of heading can only be performed for very slow eye movements. At rotation rates greater than 1 deg/s extraretinal information would be required.
The true heading performance and the prediction for an observer that ignores the rotation and simply estimates the FOE in the retinal flow can be compared. The former would correspond to pure visual heading detection, the latter to complete reliance on extraretinal input.
Path perception
The above descriptions assume linear motion and a rotational component induced by eye movement. However, a combination of translational and rotational self-motion also arises during movement along a curved path. In this case the rotation axis is not in the eye but at the center of the motion curve. This creates a further problem for heading detection from retinal flow
because the flow field cannot specify the location of the rotation axis and hence the origin of the rotational component. The retinal flow is ambiguous in that respect. Decomposition of the retinal flow in rotational and translational components only specifies the momentary retinal heading. To relate this to a path in the visual scene requires additional transformations which can give rise to additional errors (Stone e Perrone 1997) . In principle, curved movements can be distinguished from straight movements (Turano e Wang 1994). Observers can discriminate whether an object is on their future curved path with similar precision as during linear movement (e. a. Warren 1991). Sometimes, however, subjects erroneously perceive curved motion paths where linear motion is presented. When pure expansion patterns differ with respect to the average speed of motion in the left and right hemifields, a curved self-motion towards the side with the lower speed is perceived.
Combining retinal flow with information about the environment
Another factor that could influence heading judgements is information about 3-D scene layout. Knowledge of the depth structure of the scene could aid the separation of translation and rotation, because the motion of objects in the flow depends on their distance from the observer. The motion of distant points can be used to estimate rotation while the motion of near points is more useful to obtain translational information. Independent knowledge about the depth structure of the scene is normally available through binocular vision.
Dynamic properties and saccadic eye movements
Saccadic gaze shifts disrupt the retinal flow and change the retinal projection of the direction of heading on average twice per second. Heading judgements are possible for presentation times as short as 228– 400 ms, that is, within the time available between two saccades. Yet, visual search for the heading
direction is only rarely accomplished in a single saccade, indicating that heading direction is usually processed across successive saccadic intervals. But there might be different temporal dynamics of visual and extraretinal contributions to heading perception. Grigo and Lappe suggested that heading detection in the typical time interval between two saccades uses visual mechanisms and that extraretinal inputs become important only at a later time or during longer fixations or eye pursuits (Grigo e Lappe 1998).
OF is the distribution of apparent velocities of movement of brightness patterns in an image and can give important information about the spatial arrangement of the objects viewed and the rate of change of this arrangement. So, many works concentrated also on OF images analysis. Discontinuities in the optical flow can help in segmenting images into regions that correspond to different objects. Attempts have been made to perform such segmentation using differences between successive image frames. Some recent papers have considered the problem of recovering the motions of objects relative to the viewer from the optical flow (Hadani, Ishai e Gur 1980) (Koenderink e van Doom 1974) (Longuet-Higgins e Prazdny 1980).
In some cases information about the shape of an object may also be recovered (Koenderink e van Doom 1974) (Clocksin 1980).
One of the major functions of visual perception is to enable us to interact with and move around in our environment. A crucial task for a mobile animal such as ourselves is to be able to walk or run precisely towards (or away from) an object of interest.
1.4. Main contribution and organization
My personal contribution to the research project I was part of during these three years of PhD studies is underlined in each Chapter. To summarize: • I followed the initial experimental hardware setup with the new equipment for the neuronal data acquisition. This included hardware installation and test of the performances compared to the old acquisition system (see Chapter 3).
• I wrote the C language routines to show the visual stimuli on the screen and to control the behavior of the animal during the training and the experimental sessions. These routines also control neural data recording and synchronization with visual stimuli. (see Chapter 3)
• I performed most of data analysis, by means of MatLAB routines. This included basic and more advanced statistical analysis as well as the implementation of neuronal models (see Chapter 2, 4 & 5).
• I am the second author of the article under review that was written to public the results of the main experiments carried on (see Chapter 4).
2.
Background
This chapter consists of five sections, beginning with some thoughts about the use of animal in scientific research. A brief description of the central nervous system, cerebral cortex and association areas follows. The third paragraph concentrates on the analogies and differences between the human and other primates brain. Then, some brief notes about electrophysiology are explained, and at last some traditional neuronal data analysis are presented.
2.1. Animal research in brain studies
It’s always hard to speak and write about animal research. This section cannot be exhaustive on the topic, it just wants to be a starting point for meditation.
Most of people are emotionally involved when they hear word as vivisection or animal research, because they think it’s an act of violence without any therapeutic aim.
In the last years many animalists raised the debate over the use of animals in biomedical and behavioural research, disputing the value and necessity of these studies and promoting alternative methods. These activities raised confusion and doubts in people’s minds over the importance of animal research.
But scientists agree that when there’s no other way to encourage the progress of scientific knowledge, animal studies are necessary.
From a recent study by National Academy of Science (NAS) and the Institute of Medicine in the USA (IOM) it’s been found that 94% of animals in research do not suffer from experimentation, or at least they are given drugs to
relieve pain. The remaining 6% are exposed to pain only because involved in drug research against pain.
Animals are mainly subjects of three sort of studies: biomedical research, teaching and pharmaceutical.
Biomedical research helps to understand how biological systems work. It’s based over the “experimental physiology”, founded by Claude Bernard. A scientific study, to be valid, needs to follow two rules: every variable must be controlled and results must be repeatable. It can be basic research or applied. Applied research has more practical and understandable aims, but it leans on basic research knowledge. We cannot say one is more important than the other.
In teaching, animal experiments are necessary for surgeons and veterinaries to acquire the skills to operate on patients, as well as new for knowing the effects of new drugs.
Animalists stand up to the idea that we can learn only from studies on humans, because other species differ too much from us. This is not true, especially because scientists choose a particular species for a study because they know it may have similar response to humans. Dogs for example were of unbelievable value for kidney transplant, for studying heart disease, for better understanding how insulin is involved in diabetes.
Animalists also insist that there are alternatives to animal research: in vitro research and computer simulation. They both helped a lot researchers in the last decades, but first isolated cells will never react as cells in a living body. Some in vitro results may have nothing to do with real cellular behavior. Regarding computer simulation, the main problem is that a model is good only when supported by a deep knowledge of reality: most of biological mechanisms are still unknown, so no model can simulate their behavior.
When speaking of studies on non human primates, the objection is even stronger: animalists believe primates can feel the same sufferance as humans. This may be true, but this similarity makes them even more precious: they can get most of the same disease we have, their immune system is quite similar to ours, they have extraordinary intellectual and social abilities and in some motor act they are even better than humans. Primates are used only in 0.5% of animal studies, but they contribution is enormous: they helped to find the vaccine against polio and hepatitis, to study hypertension, Parkinson disease. It’s true, there might be chances that the animals suffer, but this has nothing to do with maltreatment: scientists try their best to avoid every stress and pain in animals.
Scientists agree that animal research is necessary for reducing pain and illness in humans, and most progresses made by medicine in the past involved animal research. And most of all, scientists are aware there are no other choices.
2.2. Organization of the nervous system
This chapter aims to introduce some basics about the nervous system. The anatomy of the brain and the pattern of its interconnections appear (and are) rather complex, but the functional organization of the nervous system is governed by a relatively simple set of principles that make the anatomy more comprehensible.
All our behavior are governed by the central nervous system, which consist in the spinal cords and the brain. The main brain divisions are the cerebellum, the brain stem and the cerebral hemispheres. The cerebral hemispheres are interconnected by the corpus callosum and consist of the cerebral cortex, the white matter, the basal ganglia, the amygdale and the hippocampus.
Figure 6: Central nervous system
The description of the nervous system divisions goes beyond the aim of this work, so I’ll concentrate only on the cerebral cortex.
The cerebral cortex is the highly folded sheet of grey matter encasing the brain, home to most higher cognitive functions. Its thickness varies significantly by cortical region, changes across the human life-span, and is affected in multiple disease and disorders.
The brain operations responsible for our cognitive abilities occur primarily in the furrowed gray matter that cover the cerebral hemispheres. Humans have the most elaborated cerebral cortex, highly convoluted in shape, with many sulci that separates the regions. It’s 2-4mm thick, but thanks to the convolutions (gyri and sulci) the surface area is incredibly larger that other primates. The cerebral cortex is divided into four lobes: frontal, parietal, temporal and occipital.
The frontal lobe is largely concerned with planning future actions and controlling movements, the parietal lobe with somatic sensation, sensory integration and relating our body with extrapersonal space, the occipital lobe
is involved in vision and the temporal lobe with hearing. The deep structures (hippocampus and amygdala) are involved in memory, learning and emotions.
Figure 7: Four areas of the cerebral cortex: frontal, parietal, temporal, occipital.
Many areas of the cerebral cortex are involved in the processing of sensory information or motor commands, and are called primary. The primary visual cortex is in the occipital lobe, the primary auditory cortex is in the temporal lobe and the primary somatosensory cortex is in the parietal lobe. The primary motor cortex contains neurons that directly projects to the spinal cord and has a different meaning: it’s the last site for the cortical processing of motor commands. Sensory information is processed along several parallel pathways from peripheral receptors through primary sensory cortex. Each primary area sends information to adjacent unimodal high-order areas. Sensory information representing different modalities converges upon multimodal association areas that integrate that information into a polisensory event. The last step is integrating these sensory information to plan a motor action: the posterior association areas are highly interconnected with the frontal association areas responsible for planning a motor action.
There are six organizing principles behind the cerebral cortex: 1. The cortex is composed of varying neuronal types. 2. The cortex is horizontally structured in layers. 3. The cortex is vertically organized into columns.
4. The cortex is organized into cytoarchitectonically unique regions. 5. Functional systems in the cortex are hierarchically organized, whereby cortical regions interact, either through direct connections or via sub-cortical mediation, to achieve higher-order mechanisms of sensori-motor and cognitive processing.
6. Structure-function relationship.
1. The cortex is composed of varying neuronal types
There are two main categories of neurons in the cerebral cortex: projection neurons and local inter-neurons (Kandel et al., 2000). Cortical neurons can be further classified into different types based on several criteria, such as cell form, usual position within the cortical laminae, type of synaptic terminals, direction of trans-synaptic action, and type of transmitter molecules. Two main types of synapses occur within the neocortex. The first are asymmetrical, excitatory synapses which make up about 75-80% of the total. The remaining synapses are symmetric and inhibitory (Mountcastle, 1998). Spiny pyramidal cells make up 70-80% of cortical neurons in mammals. They are located in different densities in all cortical layers except for layer I. Pyramidal cells in different layers have different targets and receive inputs from intrinsic cortical neurons, collaterals of other pyramidal cells, axonal terminals of pyramidal cells in other cortical areas, thalamic nuclei, brainstem monoaminergic systems, and from the claustrum (Mountcastle, 1998). Non-pyramidal excitatory neurons make up another 2-3% of the cortex
(Mountcastle, 1998). The remaining 20% of neurons in the cortex are non-pyramidal inhibitory neurons whose connections remain intrinsic to the cortex.
Neuron structure varies across the cortex, identified by three features: cell size, branching pattern, and number/distribution of inputs. These regional variation in structure underlie fundamental differences in cortical circuitry.
2. The cortex is horizontally structured in layers. T
he neocortex is organized into six layers (Brodmann, 1909). Layers are differentiated by cell composition and density. Layer I, the outermost layer, is called the molecular layer and is generally acellular, being occupied by dendrites of cells located deeper in the cortex. Layer II, the external granule
cell layer, contains tightly packed small granule cells. Layer III, the external pyramidal cell layer, is comprised of pyramidal cells which increase in size
towards the depth of the cortex. Layer IV, the internal granule cell layer, is similar to layer II, also mostly containing small granule cells. Layer V, the
internal pyramidal cell layer, is similar to layer III, containing large
pyramidal cells. Finally, layer VI, the polymorphic, fusiform or multiform
layer, contains spindleform cells and gradually blends into the white matter.
The layering of neurons provides means of organizing inputs and outputs of the cortex.
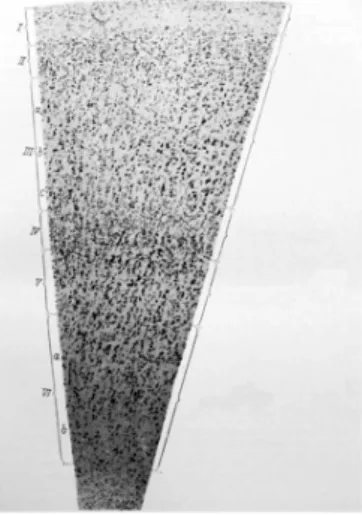
Figure 8: The six layers of the cortex illustrated on a single silver stained slice. Adapted from (Economo and Koskinas, 1925).
3. The cortex is vertically organized into columns
Along with the horizontal laminar pattern cortical neurons are also vertically or radially structured into columns. Columnar organization varies throughout the cortex, being prominent in the parietal lobes, less visible in parts of the frontal lobe (Economo e Koskinas 1925). Neurons within a particular column have similar response properties, likely being part of the same local processing network.
Evidence for the functional organization comes from microelectrode penetrations into the cortex along with transection and nerve regeneration studies. The primary visual cortex responds selectively to differentially oriented lines. Electrode penetration studies of the visual cortex found that perpendicular penetrations showed constant responses to a stimulus of a single orientation, whereas penetrations made nearly parallel to the surface found a consistent change in sensitivity to differently oriented stimuli (Obermayer e Blasdel 1993) (V. Mountcastle 1998)
Figure 9: This figure shows orientation sensitivity of columns in the striate cortex. Vertical penetrations (rightmost arrow) show a single orientation, whereas parallel penetrations (diagonal arrow) show multiple orientations. The small lines above the diagonal penetration show the orientation of the line in the visual field which that particular column responds to. From (Mountcastle, 1998).
Figure 9 provides a schematic illustration of these results. Similarly, studies in the somatic sensory cortex found columns coding for both modality as well as location (point on finger). Evidence for columnar existence in the sensory cortex includes nerve regeneration experiments in monkeys. It was found that neurons in adjacent columns are related to adjoining and overlapping peripheral receptive fields.
4. The cortex is organized into cytoarchitectonic areas
Differential composition of neurons, along with varying lamination, subdivides the cortex into cytoarchitectonic areas, as mapped in figure 10. An example to illustrate the difference between two cytoarchitectonic areas is that of Brodmann Area (BA) 44 and 45, both part of Broca's area and implicated in language function. In BA 44 layer IV is dysgranular and barely recognizable, often invaded by pyramidal cells from layers III and V. BA 45 features a pronounced layer IV, though still less clear than its rostrally adjoining areas 46 and 10 (Economo e Koskinas 1925) (Amunts 1999).
Figure 10: Two cytoarchitectonic maps dividing the cortex into morphologically similar areas are shown here. Part A shows the map from Brodmann, part B from Economo. Reproduced from (Amunts 1999). The boundaries for areas 44 and 45 are in bold. Economo–Koskinas with Cytoarchitectonic areas encompass the functional subdivision of the cortex.
The cellular, laminar, and columnar structures that are reflected in cytoarchitectonic boundaries clearly contribute to the functional specialization of different cortical areas.
5. Functional systems are hierarchically organized
Each cytoarchitectonic area is responsible for a set of functions; entire functional modalities, such as language or vision, need multiple cortical areas operating within a connected network. The classic example of such a cortical network comes from the vision literature. Two processing streams, the "what" and "where" streams, are believed to exist: the dorsal pathway, running from the primary visual cortex to the parietal lobes, is responsible for motion, depth, and spatial information. The ventral pathway, also originating in the primary visual cortex in the occipital lobes and extending to the temporal lobes, analyses form and color (Kandel et al., 2000). It is worth examining cortical processing of visual information in some more detail as it provides an excellent overview of some general properties of the cortex. Input from the retina is passed via the optic chiasm to the lateral geniculate nucleus (LGN). Information at this point is already separated into the parvocellular (P) pathway, responding to color, and the magnocellular (M) pathway, which processes. Output from the LGN is sent to the primary visual (striate) cortex - BA 17. Within the primary visual cortex, cortical columns code primarily for the orientation of the visual input, the eye from whence the input came (occular dominance), as well as the color. Every part of the visual field is represented by multiple columns ultimately coding for all possible orientations, colors, and ocular inputs; the sum of these representations is often referred to as a hypercolumn. As alluded to earlier, the ventral visual pathway, running from the primary visual cortex to the interior temporal cortices, is responsible for form and color - the details of objects in the visual
field. The dorsal visual pathway, also originating in the striate cortex and progressing to the parietal lobes, analyses the location and movement. Neurons in the higher processing centers of either pathway have larger receptive fields than those in the lower cortical areas. Moreover, they respond to increasingly complex stimuli. Neurons in the inferior temporal cortex, for example, respond to a given shape at any position in the visual field, whereas neurons in the primary visual cortex only respond to a particular edge in a precise position within the visual field. Higher visual processing centers are also more dependent on selective attention than cortical areas lower in the pathway (Kandel et al., 2000). The structure of pyramidal neurons changes with cytoarchitectonic area, increasing their number of spines in areas subserving higher order visual processing tasks. This increase in spines raises the number of putative excitatory inputs along the dendrites. The pattern of connectivity of individual neurons changes as well, with higher order areas featuring neurons capable of sampling from larger areas of the visual field. The example of visual processing in the cortex highlights the significance of the structural elements of the cortex discussed above to its function. Laminar structure underlies local input processing and output redirection; cytoarchitectonic boundaries subserve different functions within the data processing network, and the structure of individual neurons is important for their participation in different tasks within the network.
6. Structure-function relationship
The cerebral cortex does not only follow a stereotyped pattern of development that can be altered through disease processes, it can also be changed with experience. Such plasticity can be due to recovery from injury as well as training within a functional paradigm. It is the latter of these two that can teach us the most about the structure function relationship in the cortex. Pascual-Leone and colleagues showed that five days of piano finger exercises
were sufficient to enlarge the cortical representation of the long finger flexor and extensor muscles (Pascual-leone 1995). Early acquisition of motor skills in string players also featured larger finger representations in the sensory-motor cortex. These types of changes in cortical representations are likely caused by a combination of formation of new synapses, recruitment of cortical tissue for a task that was previously not used for that purpose, as well as a strengthening of existing synapses. The brain is adaptable to change, and that task-specific specializations have their structural correlates. The microstructural component of these changes is not precisely known, though likely contains components of generations of new neurons (in the hippocampus at least), strengthening of existing synapses as well as the formation of new synapses. Changes in morphology based on functional adaptations suggest that the cortical thickness of areas subserving related functions might change in a correlated fashion.
2.2.1. Association areas
Association areas take up an increasingly larger percentage of the cerebral cortex as brain size increases among different species. The increasing size of association cortex correlates with the complexity of behavior and inferred mental functions that different species show.
Each sensory system has its own association areas on the cerebral cortex. The sensory systems (vision, hearing, etc.) each have their own primary area on the cortex, which gets the most direct connections from its sense. Each primary sensory area sends information to its own cortical association areas, which are next to their primary areas. The motor system is organized in the same way, but in the reverse direction: from motor association areas to the primary motor area to the motor systems in the brain stem and spinal cord. The processing that occurs in the sensory association areas is the basis of complex mental processes associated with each sense. Each sensory
association area appears necessary for perception of objects and events in its sensory modality. The information that each sensory association area gets from its primary area is about simple contours, boundaries, and sensory qualities like color or pitch. Sensory association areas combine this kind of information to represent complex objects. For example, the visual association area on the lower part of the temporal lobe plays a primary role in your ability to recognize faces, dogs, cars, trees, etc., whereas the primary visual cortex is required for detecting basic features of the visual world: edges, light and dark, location, etc.
The activity of nerve cells in visual association cortex also shows that these areas are involved in a higher level of processing. For example, nerve cells in (a part of) the visual association area respond to visual stimuli that have some kind of complex pattern or structure. They usually respond only when the eye looks at complex patterns, such as images of objects, abstract forms, hands, faces, or even specific faces. This means that when such cells respond, the brain has information telling that the specific stimulus object that triggers the active cells is getting to the sense organ.
The same kind of effects appear in the somatosensory (touch) and auditory association areas. For example, damage to the auditory association cortex (around the primary auditory cortex on the top of the temporal lobe) leaves sensitivity to sound unaffected, but disturbs recognition of what sounds mean. Neurons in the auditory association areas respond much better to complex sound patterns like bird calls and speech sounds than to simple pure tones. Damage to the somatosensory association cortex (on the parietal lobe behind the primary somatosensory cortex) leaves sensitivity to touch unaffected, but disrupts ability to recognize objects by touch.
Higher order association cortex carries out complex mental processes not associated with any particular sense. Each sensory and motor association areas sends signals to higher order association areas, which combine this information to form the basis of the highest mental processes. These highest
mental processes, like language, thinking, and planning, do not depend on specific sensory information. For example, language can use vision (reading, sign language) and touch (Braille for the blind), as well as hearing.
The higher order association areas combine information from several sensory association areas.
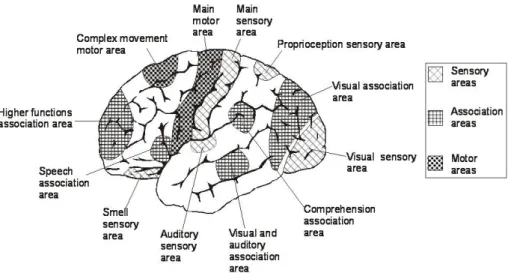
Figure 11: Main area in the brain, with particular interest on the association areas.
Associations areas are capable of mediating complex cognitive processes because they receive information from higher-order motor areas and convey information to high-order motor areas.
The link between specific mental functions and brain structure is quite obvious in the posterior parietal cortex: this association area is concerned with extrapersonal space and with creating a coherent whole from the details of a visual scene. Study of lesions in this area underlined problems with disorientation in the environment space, inability to discriminate between sensory stimuli, inability to locate and recognize parts of the body (Neglect), inability to recognize self, inability to write.
The parietal lobe is defined by four anatomical boundaries: the central sulcus separates the parietal lobe from the frontal lobe; the parieto-occipital sulcus separates the parietal and occipital lobes; the lateral sulcus is the most lateral boundary separating it from the temporal lobe; and the medial longitudinal fissure divides the two hemispheres.
2.3. Non-human primates vs. human brain
Monkeys have been used for studies of the neural mechanisms of cognition for over 70 years (Jacobsen 1936). Most of this work has been carried out on macaque monkeys. The assumption was that studies on monkeys will help us to understand the human brain. There could be two challenges.
The first accepts that these studies could be helpful but argues that they are no longer needed. The claim is that fMRI, MEG, TMS can now tell us everything that we need to know about the human brain for the purposes of cognitive neuroscience. However, this objection fails to distinguish between methods that record from whole populations of cells and methods that record from cells one at once or in small populations. The spatial resolution of imaging methods is adequate if one is interested in the functions of an area. But if one is interested in mechanism, that is in how the area does what it does, there is no alternative to using methods with a much finer spatial resolution. The reason is that one needs to know how the different cells interconnect within a module and how the differential coding of each cell within a module contributes to the population signal.
The second challenge is more serious. This is that the lines leading to modern monkeys and humans have been separated for 25 million years (Kumar 1998) . Thus, one would expect to find significant differences between the brains of
monkeys and humans. Furthermore, there are very marked behavioural differences and these must depend partly on differences in the brain. For example, humans, but not monkeys, can speak and use grammar, can reflect on their own mental states and those of others and can achieve an explicit understanding of causes in the physical and mental world. We already know some of the specializations of the human brain that make this possible.
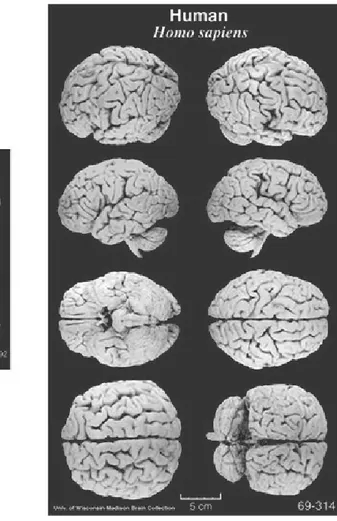
The physical difference are remarkable: the human brain is 4.8 times the size for a hypothetical monkey of the same body weight (Rilling 2006). But the human brain is not just a scaled up version of the monkey brain. The proportions of the human brain are not those that would be predicted by a plot of the changes in proportions in other primates as brain size increases. For example, the neocortex is 35% larger than predicted for a primate with as large a brain. The first consequence of an increase in size is that there is an increase in the number of specialized subregions, for example in the visual areas and in parietal cortex (Orban GA 2004). The second is that there are consequential changes in the microstructure.
Why using functional anatomic data from one species (macaque monkey) to make inferences about the functional organization of neural systems in another (human)?
We can learn a lot from animal models.
Macaque monkeys are widely used in order to understand some mechanisms of the human brain that would be unreachable otherwise.
The reason why a macaque model can still be valid for human brain is that evolution is opportunistic, as we know not only from comparative anatomy and embryology but also from recent comparisons of the coding sequences of the DNA in different animals. Evolution is a historical process. It works in
two ways. Where something works it retains it; where novel changes are required, they are typically made by adapting what was there in the first place. It is for this reason that the macaque monkey model can remain productive even in cases where humans have cognitive abilities that have not developed in other animals.
There are, of course, many respects in which human abilities can be found in monkeys. In these cases one can give the same tasks to monkeys and human subjects. Examples are visual conditional tasks, spatial working memory tasks or visual matching and non-matching rules.
Besides, recordings from electrodes in the human brain are always going to be restricted for ethical and practical reasons. For example, recordings can be taken for short periods during surgery for temporal lobe epilepsy and for longer periods with depth electrodes implanted so as to detect the source of the seizure onset. In these cases the aim of the recordings that are made for experimental purposes is not the clinical well-being of the patient, and there will always be strict limits to this type of research. However, recordings can also be taken so as to guide prostheses and here there is a clear clinical justification. Nonetheless, the basic work on decoding the activity of populations of cortical cells has first to be pioneered on macaque monkeys.
Figure 12: Comparison between human and macaque brains. The physical differences are remarkable.
We should not abandon the monkey model: whenever possible, it should be tested whether generalizations can be made. One useful strategy, that has been applied by scientists in the last years to verify the correctness of their assumption, is to use fMRI to visualize activations in humans, and compare these with activations in monkeys. Where the results are the comparable, it is possible to use information from single unit cellular
recording in those same areas to suggest the mechanisms by which functions are performed in the human brain.
2.3.1. Perception of motion in the macaque cerebral
cortex
Motion is analyzed primarily in the dorsal pathway from the primary visual area to the parietal cortex. Motion is detected by comparing images recorded at different times. Most cells in the visual system are sensitive to retinal position and can resolve events separated in time by only 10-20ms, so most cells in the visual system may be able to extract information about the object that is moving and its position. Why is there any need of a specialized neural subsystem?
In the primary visual area V1 of the macaque brain cells respond to motion only in one direction. Area MT (middle temporal area, at the edge of parietal cortex) was the first area reported to respond to motion visual stimuli, while most of its cells do not respond to colors and shapes. MT has a retinotopic map of the controlateral visual field as V1, but the receptive fields are 10 times wider than those in the primary cortex. Cells in MT respond to motion of luminous bars but also to color in motion. In the human brain, a correspondent area devoted to motion has been identified at the junction of the parietal, temporal and occipital cortices.
The mechanism underlying motion perception, in particular self-motion perception, are not clear yet, but hypothesis has been made: the visual system analyzes the visual components of motion and then it combines them with other retinal and extraretinal signals (Lappe M. 1999). Another issue related to self-motion perception is the role of stationary and moving objects: self motion perception can be affected by these cues. Moving objects are part of the retinal flow and by analyzing the speed, location in space and in relation
with other objects and the observer, the system can calculate detailed information for heading perception (J. Cutting 1996) (e. a. Cutting 1999). In monkeys, many areas show responsiveness to optic flow stimuli, but the tuning characteristics of the neurons may vary. Many studies investigated the progressive refinement of feature selectivity in the visual processision stream towards area MT (Lappe 2000) (C. Duffy 2000), but not much on the areas further in the dorsal pathway.
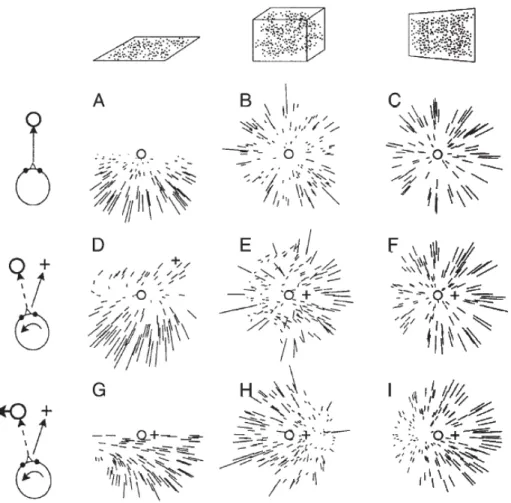
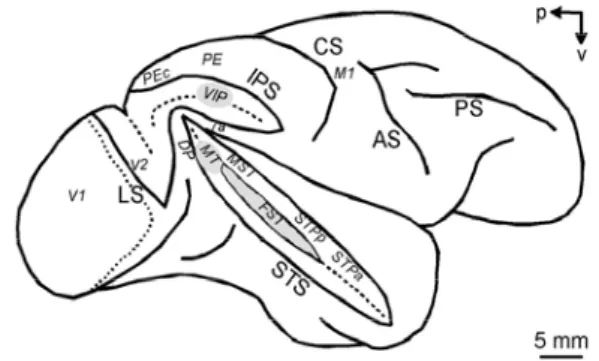
Figure 13: area MST, VIP, 7a, STP and PEc in the macaque brain
Area MST, found in the depths of the STS sulcus adjacent to MT, is
considered part of the parietal stream and responds to visual motion as well in particular to stimuli of optic flow. The first studies on this area suggested that it performs a linear combination of motion information from MT (Saito 1986) (Tanaka 1989). Neurons in area MSTd are more responsive to large-field visual stimuli and give best responses to one type of optic flow (radial, rotation, spiral) (C. J. Duffy 1991) (C. &. Duffy 1995) (C. J. Duffy 1997), are tuned with different speeds, are selective for the position of the FOE and also encode extraretinal signals (Shenoy 1999) of current eye position and speed or smooth pursuit movement, with or without visual stimulation. It seemed that