2020-12-28T16:16:26Z
Acceptance in OA@INAF
Anatomy of a Cooling Flow: The Feedback Response to Pure Cooling in the Core
of the Phoenix Cluster
Title
McDonald, M.; McNamara, B. R.; Voit, G. M.; Bayliss, M.; Benson, B. A.; et al.
Authors
10.3847/1538-4357/ab464c
DOI
http://hdl.handle.net/20.500.12386/29241
Handle
THE ASTROPHYSICAL JOURNAL
Journal
885
Anatomy of a Cooling Flow: The Feedback Response to Pure Cooling in the Core of the
Phoenix Cluster
M. McDonald1 , B. R. McNamara2 , G. M. Voit3 , M. Bayliss1 , B. A. Benson4,5,6, M. Brodwin7 , R. E. A. Canning8,9, M. K. Florian10 , G. P. Garmire11 , M. Gaspari12,23 , M. D. Gladders5,6, J. Hlavacek-Larrondo13 , E. Kara1,14, C. L. Reichardt15 , H. R. Russell16, A. Saro17,18,19, K. Sharon20 , T. Somboonpanyakul1 , G. R. Tremblay21 , and
R. J. van Weeren22
1Kavli Institute for Astrophysics and Space Research, Massachusetts Institute of Technology, 77 Massachusetts Avenue, Cambridge, MA 02139, USA
2
Department of Physics and Astronomy, University of Waterloo, Waterloo, ON, Canada
3
Department of Physics and Astronomy, Michigan State University, East Lansing, MI 48824, USA
4
Fermi National Accelerator Laboratory, Batavia, IL 60510-0500, USA
5
Kavli Institute for Cosmological Physics, University of Chicago, Chicago, IL 60637, USA
6
Department of Astronomy and Astrophysics, University of Chicago, Chicago, IL 60637, USA
7
Department of Physics and Astronomy, University of Missouri, 5110 Rockhill Road, Kansas City, MO 64110, USA
8
Kavli Institute for Particle Astrophysics and Cosmology, Stanford University, 452 Lomita Mall, Stanford, CA 94305, USA
9
Department of Physics, Stanford University, 382 Via Pueblo Mall, Stanford, CA 94305, USA
10
Observational Cosmology Lab, Goddard Space Flight Center, 8800 Greenbelt Road, Greenbelt, MD 20771, USA
11Huntingdon Institute for X-ray Astronomy, LLC, USA 12
Department of Astrophysical Sciences, Princeton University, 4 Ivy Lane, Princeton, NJ 08544-1001, USA
13
Département de Physique, Université de Montréal, C.P. 6128, Succ. Centre-Ville, Montréal, Québec H3C 3J7, Canada
14
Department of Astronomy, University of Maryland, College Park, MD 20742, USA
15
School of Physics, University of Melbourne, Parkville, VIC 3010, Australia
16
Institute of Astronomy, Madingley Road, Cambridge CB3 0HA, UK
17
Astronomy Unit, Department of Physics, University of Trieste, via Tiepolo 11, I-34131 Trieste, Italy
18
Institute for Fundamental Physics of the Universe, Via Beirut 2, I-34014 Trieste, Italy
19
INAF-Osservatorio Astronomico di Trieste, via G. B. Tiepolo 11, I-34143 Trieste, Italy
20Department of Astronomy, University of Michigan, 1085 S. University, Ann Arbor, MI 48109, USA 21
Harvard-Smithsonian Center for Astrophysics, 60 Garden Street, Cambridge, MA 02138, USA
22
Leiden Observatory, Leiden University, P.O. Box 9513, 2300 RA Leiden, The Netherlands Received 2019 April 17; revised 2019 September 16; accepted 2019 September 18; published 2019 October 31
Abstract
We present new, deep observations of the Phoenix cluster from Chandra, the Hubble Space Telescope, and the Karl Jansky Very Large Array. These data provide an order-of-magnitude improvement in depth and/or angular resolution over previous observations at X-ray, optical, and radio wavelengths. Wefind that the one-dimensional temperature and entropy profiles are consistent with expectations for pure-cooling models. In particular, the entropy profile is well fit by a single power law at all radii, with no evidence for excess entropy in the core. In the inner∼10 kpc, the cooling time is shorter than any other known cluster by an order of magnitude, while the ratio of the cooling time to freefall time(tcool/tff) approaches unity, signaling that the intracluster medium is unable to resist multiphase condensation on kpc scales. The bulk of the cooling in the inner∼20 kpc is confined to a low-entropy filament extending northward from the central galaxy, with tcool/tff∼1 over the length of the filament. In this filament, we find evidence for ∼1010M
ein cool(∼104K) gas (as traced by the [OII]λλ3726,3729 doublet), which
is coincident with the low-entropyfilament and absorbing soft X-rays. The bulk of this cool gas is draped around and behind a pair of X-ray cavities, presumably bubbles that have been inflated by radio jets. These data support a picture in which active galactic nucleus feedback is promoting the formation of a multiphase medium via uplift of low-entropy gas, either via ordered or chaotic (turbulent) motions.
Key words: galaxies: clusters: individual(SPT-CLJ2344-4243) – galaxies: clusters: intracluster medium – X-rays: galaxies: clusters
1. Introduction
In the cores of some galaxy clusters, the intracluster medium (ICM) can be dense enough and cool enough that the cooling time reaches 1 Gyr. The total mass of hot (107K) gas in these so-called“cool cores,” divided by the short cooling time, implies cooling rates of ∼100–1000 Me yr−1, which is considerably more than the typically observed star formation rates (SFRs) of ∼1–10 Me yr−1 in central brightest cluster galaxies(BCGs; McNamara & O’Connell1989; Crawford et al.
1999; Edwards et al.2007; Hatch et al.2007; O’Dea et al.2008;
McDonald et al. 2010, 2018; Hoffer et al. 2012; Rawle et al.
2012; Donahue et al. 2015; Molendi et al.2016). It is thought
that mechanical feedback from the radio-loud central active galactic nucleus(AGN) is suppressing the bulk of the cooling (e.g., McNamara & Nulsen 2007, 2012; Gaspari et al.
2011, 2013; Fabian 2012; Li & Bryan 2014; Prasad et al.
2015; Li et al. 2017; Yang et al. 2019), leading to SFRs
that represent only ∼1% of the predicted cooling rate (e.g., O’Dea et al. 2008; McDonald et al. 2018). Without this
feedback, the ICM would cool rapidly (i.e., “cooling flows;” Fabian et al. 1984), leading to central galaxies that are much
more massive, and considerably bluer, than those observed © 2019. The American Astronomical Society. All rights reserved.
23
today(e.g., Silk & Mamon2012; Main et al.2017). While the
masses of present-day giant elliptical galaxies rule out cooling flows at sustained rates of hundreds of solar masses per year for periods of several Gyr, the details of the cooling/feedback cycle remain unclear, including whether short-duration runaway cooling can occur in clusters (see recent work by Voit et al.
2015; McNamara et al.2016; Gaspari et al.2018).
While it has been known for some time that star formation is suppressed in central cluster galaxies, this suppression factor, its cluster-to-cluster scatter, and its dependence on cluster mass has only recently been constrained to high accuracy. Our recent work(McDonald et al.2018) examined the correlation between
SFR and classical cooling rate in a sample of 107 galaxies, galaxy groups, and galaxy clusters. With this large sample spanning a wide range in group/cluster masses we found that star formation was less suppressed in the most massive clusters and that the four clusters harboring the most rapidly accreting central supermassive black holes (M˙acc M˙Edd>5%) all have elevated central SFRs. We proposed that AGN feedback in these systems may be saturating—the effectiveness of AGN feedback will naturally be limited by the Eddington luminosity. Further, at high accretion rates much(but not all) of the AGN power output is radiative, which may lead to cooling of the ICM via the inverse Compton effect close to the AGN (e.g., Russell et al.2013). As the cluster mass increases, the amount
of gas available for cooling also increases. For the most massive clusters, even a cooling flow that is suppressed by a factor ∼100 can be close to the Eddington rate of the central black hole.
The Phoenix cluster, first identified using the South Pole Telescope (SPT-CLJ2344-4243; Carlstrom et al. 2011; Williamson et al. 2011), represents a unique opportunity to
study the potential limitations of AGN feedback. This system is the most X-ray luminous cluster known and harbors the most star-forming central galaxy known, with measurements of the SFR ranging from 500–800 Me yr−1 (McDonald et al.2012,
2013a; Mittal et al.2017). The high X-ray luminosity and BCG
SFR are most likely related, as the starburst appears to be fueled by the rapid cooling (high luminosity) of the ICM (McDonald et al. 2012), implying that >10% of the predicted
cooling is ultimately realized in star formation. Attempts to measure the cooling rate at intermediate temperatures, based on XMM-Newton Reflection Grating Spectrometer (RGS) spectrosc-opy, have suggested that a significant amount (∼500 Meyr−1) of the hot gas cools below the ambient central temperature of ∼2 keV, and that this cooling is concentrated in the very inner region (Tozzi et al. 2015; Pinto et al. 2018). At significantly
lower temperatures, McDonald et al. (2014) and Russell et al.
(2017) have found extended, filamentary gas in the warm
ionized and cold molecular phases, respectively. The Phoenix cluster is also unique in that it is one of only four known clusters harboring a central quasar(Russell et al.2013; Ueda et al.2013),
while also having tremendously powerful radio jets (Hlavacek-Larrondo et al.2015; McDonald et al.2015). This AGN appears
to be supplying a power of∼1046erg s−1. Roughly half of the power is radiative(quasar-mode) feedback, while the other half is mechanical (radio-mode) feedback. This makes the central AGN in Phoenix one of the most powerful in the known universe(see review by Fabian2012).
In this work, we present new, deep data on the core of the Phoenix cluster from Chandra, the Hubble Space Telescope (HST), and the Karl G. Jansky Very Large Array (VLA). These
data provide an order of magnitude improvement in depth and/ or angular resolution at X-ray, optical, and radio wavelengths, yielding a detailed view of the complex physics at the center of this cluster. In particular, the deep X-ray data allow us to carefully model the contribution to the X-ray emission from the bright point source, allowing us to map out the thermo-dynamics of the ICM on scales of10 kpc, where the bulk of the cool gas is observed. We present these new data, as well as the data reduction and analysis in Section 2. In Section 3 we summarize thefirst results from these new data, focusing on the reservoir of cool gas in the inner 30 kpc(Section3.1), the
one-dimensional thermodynamic profiles (Section 3.2), and the
two-dimensional thermodynamic maps (Section 3.3). In
Section 4 we present a discussion of thesefindings, trying to place the Phoenix cluster in the context of the cooling/ feedback loop observed in other nearby clusters. Finally, we conclude in Section5with a summary of the key results and a brief preview of future work.
Throughout this work, we assume H0=70 km s−1Mpc−1, ΩM=0.27, and ΩΛ=0.73. We assume z=0.597 for the Phoenix cluster , which is based on optical spectroscopy of the member galaxies and the central BCG(McDonald et al.2014; Ruel et al.2014; Bleem et al.2015).
2. Data 2.1. Optical: HST
New optical data for this system were acquired from the HST during program GO15315 (PI: McDonald). These data included broadband F475W(2 orbits), F775W (2 orbits), and F850LP (1 orbit), using the Advanced Camera for Surveys (ACS)/Wide Field Camera (WFC). In addition, we obtained 16 exposures over 8 orbits in the FR601N rampfilter, centered on 5952Å, which corresponds to the position of the [OII]
λλ3726,2729 doublet at z=0.597. All broadband and narrowband exposures were taken in a 4-point box dither pattern, with spacing of 0 262 between points.
For each band, we used ASTRODRIZZLE v2.2.4 with the default parameters to make a first, rough image free from cosmic rays. We then used SEXTRACTOR (Bertin &
Arnouts 1996) to generate a list of point sources, which are
then used with TWEAKREG to adjust the astrometry for each individual HST frame before recombining a second time with
ASTRODRIZZLE. For the ramp filter data, which has a very narrow field and low throughput, stars were outnumbered by cosmic rays by a factor>1000:1, meaning that any attempt to automate this process would fail. For these frames, we identified by eye a set of 27 compact and point sources to be used for the registration of frames, yielding alignment errors of <1 pixel.
To continuum-subtract the narrowband image, we performed a pixel-by-pixel spectral energy distribution (SED) fit. We model theflux from the F475W, F775W, and F850LP filters using the combination of a 10 Myr old and 6 Gyr old stellar population, redshifted to z=0.597, which were derived from
STARBURST99(Leitherer et al.1999). We allowed for two free
parameters: the mass of the young and old stellar populations, and we allowed the normalizations of these components to go negative to preserve noise. This model performed well in subtracting the continuum from a wide variety of populations (as seen in Figure1), yielding the continuum-free narrowband
amount of structure in [OII] emission that was not seen in
previous ground-based narrowband work(e.g., McDonald et al.
2014), which we will discuss in Section3.
To calculate the freefall time (tff) as a function of radius (Section3.2), we estimate the mass profile of the cluster core
from its strong lensing signature. A full description of the strong lensing analysis is presented in Bayliss et al.(2019). In
short, we compute a mass model for the cluster core using the public software Lenstool (Jullo et al. 2007), which is a
parametric lensing algorithm that uses a Markov chain Monte Carlo method to explore the parameter space and identify the best-fit model. We identified nine strongly lensed sources with multiple images—all but one are spectroscopically confirmed (a full list of constraints is given in Bayliss et al. (2019). The
identification of several radial images that extend all the way to the center of the cluster is particularly useful for constraining the mass slope at the cluster core.
The derivation of a robust lens model via 31 lensed images of 9 background sources, all with spectroscopic confirmation, provides confidence in the identification of the filamentary features near the core, and disentangle emission from back-ground lensed sources from that of thefilaments. In particular, this new analysis has allowed us to determine that the 100 kpc star-forming filament identified in McDonald et al. (2015),
which contributed1% to the total star formation estimate, is actually a lensed source at z=1.513. Overall, this model provides a reliable two-dimensional mass constraint over radii of ∼1–300 kpc, which is where we are most interested in constraining the ratio of the cooling to freefall time. This two-dimensional model is fit with a projected, three-dimensional model, consisting of a pseudo-isothermal sphere and a Navarro–Frenk–White profile, to obtain the three-dimensional radial mass profile.
2.2. X-Ray: Chandra
X-ray data for the Phoenix cluster was obtained with Chandra ACIS-I over a series of programs in Cycle 12 (PI: Garmire, OBSID: 13401), Cycle 15 (PI: McDonald, OBSID: 16135, 16545), and Cycle 18 (PI: McDonald, OBSID: 19581, 19582, 19583, 20630, 20631, 20634, 20635, 20636, 20797). In total, this source was observed for a total of 551 ks, yielding roughly 300,000 counts in the 0.7–7.0 keV band (Figure 3).
This depth was chosen to allow temperature maps on ∼1″ scales, allowing us to probe structure in the cooling profile on similar scales to the multiphase gas.
All Chandra data werefirst reprocessed using CIAO v4.10 and CALDB v4.8.0. Point sources were identified on merged images in the 0.7–2.0 and 2.0–7.0 keV bands, using the wavelet decomposition method (Vikhlinin et al. 1998). The
resulting list of point sources was used to generate a mask, which was visually inspected. The central QSO in the cluster was removed from the mask. Flares were identified following the procedure outlined by the calibration team,24 using the 2.3–7.3 keV bandpass, time steps of 519.6 and 259.8 s, a threshold of 2.5σ, and a minimum length of 3 time bins. We used a combination of the ACIS-I stowed background and a local background from the remaining three ACIS-I chips, which were relatively source-free (see Figure 3), following
Hickox & Markevitch (2006). The stowed background was
Figure 1. HST ACS-WFC2 color image of the core of the Phoenix cluster, made by combining images in the F475W, F775W, and F850LP bands. This image shows a giant elliptical central galaxy with a morphologically complex, dusty starburst component that extends for ∼50 kpc to the north and south. Previously identified (McDonald et al.2015) linear filaments to the north and
northwest, which extend for∼100 kpc, have been spectroscopically identified as radial arcs(see Section2.1).
Figure 2. Continuum-subtracted [OII]λλ3726,3729 image of the central
galaxy in the Phoenix cluster. This image was generated by subtracting a continuum model, based on the three color images in Figure1, from an image in the narrowband FR601N filter, as described in Section 2.1. This image reveals a significantly more complex network of emission-line filaments than seen in previous ground-based emission-line maps(McDonald et al.2014). The
bulk of the emission is contained in the inner∼20 kpc, with morphologically complexfilaments extending as far as ∼40 kpc to the south and ∼60 kpc to the north. In general, the emission is confined to a relatively narrow range of position angles, slightly west of north, corresponding to the direction of
normalized to match the observations using the measured flux in the 9.0–12.0 keV band.
2.2.1. Modeling the Central Point Source
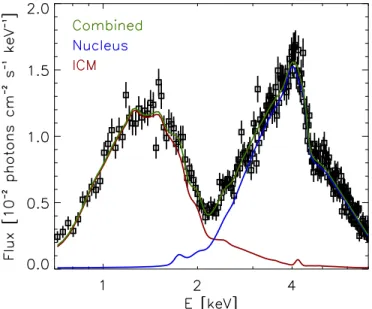
The most challenging aspect of the Chandra analysis is the modeling of the central point source, a bright type-II QSO (Ueda et al.2013), which dominates over the thermal emission
in the inner ∼10 kpc, and contributes at similar levels (due to broad point-spread function (PSF) wings) to the background over the full area of interest (i.e., r<1500 kpc). The X-ray spectrum of the central AGN(inner 1 5) is shown in Figure4. This double-peaked spectrum explains the relative lack of point-source emission at the center of the 0.7–2.0 keV image (Figure 3). The spectrum below 2 keV is dominated by the
thermal emission from the cluster (modeled with APEC), but
above 2 keV the AGN emission dominates. The upturn from 2–4 keV and strong ironK absorption edge is a clear indication of a moderately obscured AGN, consistent with the UV to IR SED presented in McDonald et al.(2014). The AGN emission
in the X-ray spectrum is well described by an absorbed power law with NH∼3×1023cm−2 (χ2/dof=466/421=1.11), however the fit is significantly improved with the addition of an emission line at the rest-frame energy of 6.4 keV. Comparing the absorbed power-law null hypothesis to one including an additional Gaussian fixed at 6.4 keV results in a Δχ2/dof=21/3, equivalent to a ∼4σ detection of a 6.4 keV line.
Wefit the spectrum with theMYTORUSmodel, which self-consistently calculates the line-of-sight direct continuum, the scattered emission, and fluorescence emission lines from a torus with a 60 deg half-opening angle, surrounding the AGN (Murphy & Yaqoob 2009). MYTORUS does not include dynamical effects, and thus we allow for Gaussian smoothing of the emission line to model velocity broadening. This model provides a good fit to the data (χ2/dof=448/420=1.07), and is an improvement over the simple absorbed power-law model byΔ χ2/dof=18/2 or ∼4σ. We further include in this model a marginal (∼10%) amount of pileup, given that the count rate exceeds 0.007 cts s−1 (Davis 2001), and intrinsic
absorption at the redshift of the Phoenix cluster due to cool gas in the central galaxy. The result of this fit, which has χ2/dof=1.02, is shown in Figure 4. A more complete interpretation of this spectrum, and of the central QSO in the Phoenix cluster, will be the subject of a future paper.
The best-fit model of the central point source (ignoring the
APEC component which, presumably, comes from a spatially extended component) was used to produce a simulated ray trace for each observation using ChaRT.25 This ray trace was
Figure 3.Left: 0.7–2.0 keV counts image for the inner ∼1 Mpc of the Phoenix cluster, combining data from 12 observations totaling 551 ks. This soft X-ray image shows a relaxed(circular) cluster with a strong cool core. There is no evidence for a central point source at these energies. Middle: 2.0–4.0 keV counts image for the same region as shown in the left panel. This hard-band image shows evidence for a central point source, embedded at the center of a strong cool core. The absence of this source in the soft band indicates a highly obscured AGN. Right: combined exposure map for all 12 observations, with the size of the region from the left panels shown as a small square. This image highlights that all of the relevant data for our analysis(i.e., inner ∼1500 kpc) comes from a small region near the ACIS-I aim point, where we have uniform coverage over all 12 exposure. The bulk of the remaining three ACIS-I chips were used as background regions for spectroscopic analyses.
Figure 4.Observed-frame X-ray spectrum of the inner 1 5 of the Phoenix cluster. This spectrum is dominated at <2 keV by thermal plasma with kT∼2 keV, with a small amount of both intrinsic and Galactic absorption (red curve). At >2 keV, the spectrum is dominated by a heavily obscured, marginally piled up central point source, which is well modeled by the
MYTORUSmodel(blue curve; Murphy & Yaqoob2009). This model has been
used, in conjunction with Chandra ray tracing software, to produce a model of the point-source emission for each OBSID, which is used to determine the underlying thermal emission at all radii.
25
combined with MARX26to produce a simulated detector-plane image of the central point source for each OBSID. When performing spectral fits, we utilize these simulated images to constrain the spectral contribution of the central point source to the total X-ray emission at each position in the detector plane.
2.2.2. Thermodynamic Profiles and Maps
We extract profiles in both annuli and two-dimensional regions, with the goal of producing 1D profiles and 2D maps of quantities such as temperature (kT), electron density, entropy, and pressure. Circular annuli were sampled coarsely at small and large radii, where contributions from the central point source and the diffuse background make measurement of the ICM temperature more challenging, and finely at intermediate radii where the ICM dominates considerably over both the central point source and the background. The spacing of these annuli were chosen iteratively to obtain a uniform uncertainty in the measured temperature over >2 orders of magnitude in radius, with this requirement relaxed at the largest radii in the interest of maintaining sampling. Two-dimensional regions were generated using the weighted Voronoi tessellation (WVT) binning algorithm of Diehl & Statler (2006), and were designed to
enclose 2000 net counts in the 0.7–2.0 keV bandpass.
Within each region, whether it is a circular annulus or a polygon WVT region, we extract spectra from each OBSID and from each simulated PSF corresponding to the OBSID. In addition, we extract a spectrum for each OBSID of a large off-source area, which is scaled to match the area of the on-off-source extraction region. We combine these spectra using the CIAO
COMBINE_SPECTRA tool, yielding a high signal-to-noise ratio spectrum of the source region, the contribution from the simulated point source, and the nearby background. We jointly fit these three spectra with a model that includes: (i) pileup (PILEUP), if the region contains any pixels from within 1 5 of
the central point source, (ii) galactic absorption (PHABS), (iii)
absorption at the redshift of the cluster(ZPHABS), (iv) anAPEC
model to account for thermal emission from the ICM, (v) a dusty torus model, as described in the previous section, to model the contribution to the central point source, and (vi) a broken power law with three narrow Gaussian lines to model the residual background. The latter model, which is purely phenomenological, provides an excellent fit to the off-source region, with typical residuals at the few percent level, and represents the average residual background above the stowed background, accounting for variations in the overall shape of the background and the line complex at 1–3 keV.27 When jointlyfitting on/off-source data in different annuli, we let only the normalization of the background vary, with all of the shape parameters being heldfixed to their value from an independent (background-only) fit.
Spectra arefit in the 0.7–7.0 keV region, with the upper end chosen to avoid the strong background line at ∼7.5 keV, and the lower end driven by the decreasing effective area and growing uncertainty in the calibration at soft energies due to buildup of contamination on ACIS.28Models are tied between on- and off-source(background) regions using the relative area of the extraction regions, and are tied between the data and simulated point-source spectra, assuming a fudge factor that
can vary by±10% from unity. Ultimately, this complex AGN +ICM+background model has only 10 free parameters to fit ∼1600 spectral elements (for each spatial element), with the bulk of the spectral shape parameters beingfixed to their values from independentfits.
For radial profiles, we convert the measured normalization of the APEC model to emission measure (
ò
n n dVe p ), assumingò
= p -+ N n n dV D z e p 10 4 A1 14 2[ ( )] , where DA is the angular diameter distance to the source, N is the normalization of the APEC
model, neis the electron density in units of cm−3, and npis the proton density in units of cm−3. Emission measure profiles werefit by numerically integrating a three-dimensional density profile along the line of sight and over the width of each annulus, producing a projected profile. We assume that the three-dimensional profile is of the form described by Vikhlinin et al.(2006): = + + + + a b a g g g b -- n n n r r r r r r n r r 1 1 1 1 , 1 p e c c s c 0 2 2 2 3 2 0,2 2 2 2 3 2 ( ) ( ) ( ) ( ) ( )
where we leave all parameters free except forγ, which is fixed to γ=3, following Vikhlinin et al. (2006). The projected
profile is fit to the data using the MPFITFUN procedure in IDL. We fit 100 realizations of the data, where data points are allowed to vary betweenfits based on their uncertainties, which provides an uncertainty in thefit. To convert from nenpto ne, we assume ne/np=1+2x, where ºx nHe np is the helium abundance, and elements heavier than helium have been neglected, following Markevitch (2007). For x=0.098
(Anders & Grevesse 1989), this implies that ne=1.196np, orne= 1.196n ne p.
Temperature profiles are similarly projected along the line of sight, assuming a three-dimensional form described by Vikhlinin et al.(2006): = + + + a a -T r T r r T T r r r r r r 1 1 , 2 t a t b c b 3D 0 core min 0 core ( ) ( ) ( ) ( ) [ ( ) ] ( )
where the small and large radius behavior is dictated by rcore and rt, respectively, and the minimum temperature is Tmin. We project this three-dimensional temperature model along the line of sight, and over the width of each bin, using our model density profile from above and assuming that
ò
ò
á ñ =T wTdV wdV , 3 V V ( ) where = -w n Te2 0.75, ( )4 following Mazzotta et al. (2004) and Vikhlinin (2006). Thisprojected model was fit to the data, again using MPFITFUN and bootstrapping over 500 realizations of the temperature profile to provide uncertainties on the model. From the three-dimensional temperature and electron density profiles, it is trivial to compute the entropy ( ºK kTne-2 3), cooling time
º +L t n n kT n n kT Z cool 3 2 , e p e p
(
( ))
( ) , and pressure(P=(ne+np)kT) profiles. 26
http://cxc.harvard.edu/ciao/threads/marx/
27http://cxc.cfa.harvard.edu/contrib/maxim/stowed/ 28
2.2.3. X-Ray Residual Images
To look for substructure in the X-ray image, wefirst extract an image in the 0.7–2.0 keV bandpass and mask any point sources. We choose this bandpass because it is free of emission from the central AGN, which is almost entirely absorbed at <2 keV, presumably due to cool gas near the central AGN (Figure 4). This image is modeled in SHERPA, using a
combination of two two-dimensional beta models (BETA2D).
We found that two beta models provided an adequatefit to the emission within 1″, and that a third component did not significantly improve the fit. We forced the two components to share a center, and to have zero ellipticity, leaving only eight free parameters: the center (x, y), the core radii (rc,1, rc,2), the beta values(β1,β2), and the amplitudes. The best-fit model was visually inspected in one dimension to confirm that it was a goodfit, and then subtracted from the two-dimensional image to produce a residual image.
2.3. Radio: Karl Jansky VLA
The Phoenix cluster was observed with the Karl G. Jansky VLA in the 8–12GHz X-band (project code 17A-258). The observations were taken in the A-, B-, and C-array con figura-tions on 2018 March 6, 2017 June 5, and September 7, respectively. The total on-source time was about 2hr in each configuration and all four polarization products were recorded. The primary calibrators used were 3C138 and 3C147. The source J0012-3954 was observed as a secondary calibrator.
The data was calibrated with CASA(McMullin et al.2007)
version 5.1. The data for the different array configurations were first reduced separately. The data reduction mostly follows the procedure described in van Weeren et al. (2016). Below we
briefly summarize the various steps. As a first step the data were corrected for the antenna offset positions, requantizer gains, and elevation dependent gains. Next, data affected by radio frequency interference (RFI) were flagged with the flagdata task, employing the “tfcrop” mode. Data affected by antenna shadowing were also removed. We then corrected the data for the global delay, cross-hand delay, bandpass, polarization leakage and angles, and temporal gain variations using the calibrator sources. After averaging the target data, we flagged addition low-level RFI with the AOFlagger (Offringa et al. 2010). The calibration solutions were subsequently
refined via the process of self-calibration. For the imaging we used WSClean(Offringa et al.2014; Offringa & Smirnov2017)
with the Briggs weighting scheme (robust=0). Due to the low decl. of the target, between 10 and 15 cycles of self-calibration were required for the different data sets. The data from the three different array configurations were then combined and jointly imaged. Another 10 rounds of self-calibration were carried out on the combined data sets. The final images were corrected for the primary beam attenuation.
3. Results
3.1. Cool Gas in the Inner 30 kpc
In Figure 1, we see the central starburst in the Phoenix cluster at unprecedented angular resolution. For the first time, the smooth, underlying giant elliptical galaxy can be seen extending on ∼50 kpc scales, with no evidence for tidal disruption as one would expect if the∼600 Meyr−1starburst was triggered by a massive gas-rich merger. This central galaxy
is known to have large amounts of gas at 105K (McDonald et al. 2015), 104K (McDonald et al. 2014), and in the
molecular phase(Russell et al.2017). In Figure2, we see the warm ionized(104K) phase, as traced by emission of the [OII]
λλ3726,3729 doublet, at significantly higher angular resolution than any of these previous works. This image reveals a highly clumpy,filamentary complex on scales similar to the emission-line nebula in NGC1275 (Conselice et al. 2001), spanning
>100 kpc (>16″) from end to end.
When we compare this map with both the residual X-ray map and the high-resolution radio map (Figure 5), we see
several morphological similarities between the cool gas and the radio jets. To the north and south, the cool gas appears draped around the outside of the bubbles, similar to what is observed in CO (Russell et al. 2017). There are several filaments that
extend beyond the bubbles, including a linear filament extending∼10–20 kpc below the southern bubble and a curved northernfilament extending ∼30 kpc beyond the leading edge of the northern bubble. These filaments challenge the notion that the cool gas is condensing exclusively behind bubbles. The bulk of the [OII] emission lies between the location of the
central AGN and the southern edge of the northern bubble. This cool gas appears similar to the “horseshoe” filament in Perseus, which may be gas condensing behind the bubble as it uplifts low-entropy gas in its wake.
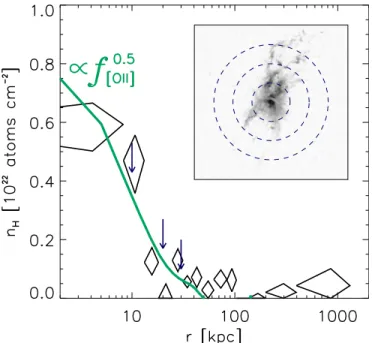
Given the huge amount of cool gas in this system, and the high covering fraction over the inner ∼30 kpc, one would expect a significant amount of absorption in the soft X-rays. Indeed, if we look at the best-fit intrinsic absorption column as a function of radius(Figure 6), we see that it is significantly
elevated in the inner ∼30 kpc. We note that the inclusion of intrinsic absorption in the inner 10 kpc improves the quality of fit from χ2/dof=1035.8/856 for a single temperature model or χ2/dof=1035.5/854 for a multi-temperature model to
Figure 5.On the left, we show the continuum-subtracted[OII] emission map,
with radio (yellow) and X-ray (white) contours overlaid. For the X-ray contours, we only show the significant negative residuals, after a two-dimensional model has been subtracted from the large-scale emission(see Section2.2.3). In the right panels, we show the [OII] (top), radio (middle), and
X-ray(bottom) images individually. X-ray images have been shifted by a half pixel to align the optical and X-ray nuclei. Thisfigure demonstrates the near-perfect correspondence between the radio jets, X-ray cavities, and cool filaments. The jets appear to be responsible for inflating bubbles in the hot gas, while the cool gas appears draped around and behind the resulting cavities. We will discuss this further in Section4.3.
χ2/dof=987.9/855 for an absorbed single temperature model. The absorption profile is proportional to the square root of the[OII] flux profile, as one would expect if the cool
gas is the primary source of absorption. Further, if we consider the two-dimensional X-ray absorption map(Figure7), we find
that the morphology is strikingly similar to the [OII] map,
extending primarily to the north and peaking at the galaxy center. Assuming that this absorbing material is distributed evenly throughout a cylinder 40 kpc long and 20 kpc in diameter, and assuming an average column of 0.5×1022cm−2 (Figure 7), we infer a total mass of 1.2×10¹⁰ Me in cool material, which is comparable to what we see in the molecular phase Russell et al. (2017). Assuming a cooling rate of
∼1000 Me yr−1, this amount of cool material could only accumulate in∼107yr. Given that the timescale to accumulate this amount of cool material is consistent with the central cooling and freefall times(see Section3.2), it is likely that this
material is either short-lived, or that rapid cooling has only been proceeding for a short time.
Such substantial absorption has not been detected in other more nearby clusters. This can be understood by considering a direct comparison to the Perseus cluster, which is the archetypal cool core cluster. First, the Phoenix cluster is in a part of the sky nearly free of Galactic absorption, with a Galactic absorbing column of 0.015×1022cm−2, compared to 0.14×1022cm−2 for the Perseus cluster. Second, the Phoenix cluster is at a redshift of z=0.597, compared to Perseus which is at z=0.018. This means that any intrinsic absorption in Phoenix will affect the spectral shape differently
than Galactic absorption, unlike in Perseus where both intrinsic and Galactic absorption have essentially the same spectral signature, with only an amplitude offset. Finally, the cool gas in the Phoenix cluster appears to be less filamentary than in the Perseus cluster, which may lead to a higher covering fraction of the absorbing gas. Combining these three factors, we expect for Phoenix the ratio of intrinsic to Galactic absorption to be a factor of∼100 times higher than for the Perseus cluster, while also having a different spectral signature than Galactic absorption, making it easier to detect.
Overall, we see evidence for an abundance of cool gas based on both high angular resolution[OII] imaging and low angular
resolution X-ray absorption mapping. The[OII] morphology is
well matched by the X-ray absorption morphology, both of which appear to be highly concentrated to the north of the central galaxy, in the direction of the radio jet and behind the northern X-ray cavity. We will discuss the implications of this large cool gas reservoir in Section4.
3.2. Thermodynamic Profiles: Evidence for a Cooling Flow In Figure8, we show the one-dimensional emission measure and temperature profiles for the Phoenix cluster. The emission measure profile is well fit by our projected density model at all radii, and looks similar to the majority of cool cores, with the density steadily rising toward the cluster center. In the central 10 kpc, the three-dimensional electron density surpasses 0.5 cm−3, which is more typical of the warm neutral/ionized medium of a disk galaxy, and roughly an order of magnitude higher than the typical cool core cluster at z∼0 (Sanderson et al. 2009; Hudson et al. 2010). The projected temperature
profile decreases from a peak of ∼14 keV at r∼300 kpc to a
Figure 6.Thisfigure shows the inferred photoelectric absorption in the X-ray due to cool gas within the Phoenix cluster as a function of radius. Wefind relatively strong absorption in the inner∼10 kpc, which falls off quickly to become negligible at r50 kpc. For comparison, we show the radial profile of the absorbing column (green) as inferred from the [OII] map (shown in
grayscale). Assuming that the [OII] emission roughly traces the gas doing the
absorbing, then the absorbing column should be proportional to the square root of the emission-line luminosity, which qualitatively appears to provide a good fit to the data. Further, integrating the total amount of X-ray absorption over the volume of absorbing material yields a total gas mass similar to that of the cold molecular gas(Russell et al.2017). In the inset, we show the [OII] image of the
inner ∼40 kpc, with annuli overlaid at 10, 20, and 30 kpc. These radii are marked in the radial profile with arrows.
Figure 7.Two-dimensional X-ray absorption map for the inner∼25 kpc of the Phoenix cluster. Overlaid in white are the contours of constant[OII] surface
brightness, where we have highlighted the highest surface brightness emission with a thicker contour. This figure demonstrates that the X-ray-absorbing material is cospatial with the cool, line-emitting gas.
minimum of∼2 keV in the center, while the three-dimensional profile indicates that the ambient central temperature may be as low as ∼1 keV. This central temperature corresponds to only ∼1 keV in three-dimensions. Over ∼300 kpc in radius, this represents the strongest temperature gradient in any known cool core cluster, and is consistent with the T∝r1/2 expectation for pure cooling in hydrodynamic simulations (Gaspari et al. 2012). In the inner ∼20 kpc, the temperature
appears to fall off even more rapidly, dropping from 6–1 keV
over ∼10 kpc. The lack of an accompanying density jump suggests that this is not a cold front.
In Figure9 we show the three-dimensional entropy profile for the Phoenix cluster, compared to cool cores from the ACCEPT sample (Cavagnolo et al. 2009). At large radii
(r>100 kpc), the entropy profile appears to be slightly steeper than the baseline r1.2profile produced by gravitational structure formation(Voit et al.2005), but is consistent in magnitude with
the bulk of nearby cool core clusters. This steep slope continues over 30<r<100 kpc, at which point the entropy profile for most other clusters has become shallower (e.g., Panagoulia et al.2014; Babyk et al.2018). At a radius of 30 kpc, Phoenix
has the lowest entropy of any nearby cluster, and appears to be following a single power with slope r1.4. At r<30 kpc, specific entropy continues to decline toward smaller radii, steepening at 10<r<20 kpc due to the sharp drop in the temperature profile (Figure 8). In the innermost bin,
0<r<7 kpc, we measure a three-dimensional entropy of ∼2 keV cm2, roughly 5× lower than any other cluster at similar radii in the ACCEPT sample. Over the range of 0<r<30 kpc, the entropy profile lies below the baseline entropy profile, as one would expect for a rapidly cooling system.
We also show in Figure9the expectation for pure cooling in hydrodynamic simulations (Gaspari et al. 2012), as well as
an analytic steady-state cooling flow model, as described by
Figure 8.Top: projected X-ray emissivity per unit area for the Phoenix cluster. In red, we show the best-fit three-dimensional model (Equation (1)), projected
onto two dimensions. This model provides an excellentfit to the data at all radii and reveals a strongly peaked cool core cluster. Bottom: projected X-ray temperature profile for the Phoenix cluster. In red, we show the best-fit three-dimensional model(Equation (2)), projected onto two dimensions. In blue, we
show the true three-dimensional model, which is slightly cooler in the center and slightly hotter at large radii than the projected profile. In green, we show the prediction for the inner 150 kpc from hydrodynamic simulations for a pure-coolingflow (T∝r1/2; Gaspari et al.2012). Given the shape of the mass
profile over the radial range considered here, this curve is consistent with kT(r)∝GM(<r)/r. Phoenix exhibits the strongest falloff in temperature of any cluster known, going from a peak temperature of∼14 keV to a minimum of ∼1 keV in the two innermost bins (r10 kpc), consistent with the expectations for pure cooling. The temperature profile appears to have two regions: the larger scale cool core with a temperature of∼6 keV and a size of ∼50 kpc, and a smaller, cooler region with a temperature of ∼1 keV and a size of∼10 kpc.
Figure 9.Three-dimensional entropy profile for the Phoenix cluster (black diamonds). This profile was derived based on the best-fit three-dimensional density and temperature models, shown in Figure8. In gray, we show entropy profiles for 91 cool core clusters (K0<30 keV cm2) in the ACCEPT sample
(Cavagnolo et al.2009). In blue, we show the canonical K∝r1.2“baseline
entropy profile” from Voit et al. (2005), while in red and black we show
the simple and more complicated(respectively) predictions for a steady-state coolingflow with M˙∼3000 Meyr−1, following(Voit2011). In green, we
show the prediction for a pure-coolingflow from hydrodynamic simulations (Gaspari et al.2012). We note that, at all radii, the data for the Phoenix cluster
lies between the simulation and analytic theory predictions for a pure-cooling flow. This plot demonstrates the uniqueness of the Phoenix cluster, which exhibits no evidence for a break at small radii(e.g., Panagoulia et al.2014; Babyk et al. 2018) and with a central entropy lying roughly an order of
Voit (2011). In this model, a steady-state entropy profile is
achieved when inward advection of heat balances radiative losses:
g- = -r P v r d K d r T 1 ln ln , 5 2L ( ) ( ) ( )
where v is the outflow speed and γ is the polytropic index. Assumingγ=5/3, T =1.7´10- m- T erg cm s- K
-p
27 2 1 2 3 1 1 2
L( ) ,
and recognizing that Voit (2011) define entropy with respect to
mass density(KV11=Pr-g =K (mme2 3mP5 3), yields
ò
= - ´ K r M M kT r dr 3.9 keV cm yr keV , 6 r 2 1 1 3 0 5 2 kpc 2 kpc 1 3 kpc ⎜ ⎟ ⎡ ⎣ ⎢ ⎛⎝ ⎞⎠ ⎤ ⎦ ⎥ ( ) ( ˙ ) ( ) where we use the more standard X-ray definition of
º
-K kTne2 3, have assumed μ=0.6 and μe=1.165, and have explicitly declared the units for each variable for clarity. Voit (2011) shows that, for most clusters, this expression
results in a power-law profile with K∝r1.2. However, this slope is weakly dependent on the slope of the temperature profile. Given the very steep temperature profile observed in Phoenix (kT∝r0.5), the implied steady-state entropy profile has K∝r1.4, which we have overplotted on Figure 9. The precise expectation for the entropy profile in a steady-state cooling flow, derived from Equation (6) and the
three-dimensional temperature profile, is shown as a solid black line in Figure9. Renormalizing this model to match the data implies a cooling rate of 3276 Me yr−1 and an inflow velocity (vflowºM˙ 4p rr2 ) of <200 km s−1at r>10 kpc and <50 km
s−1 at r>50 kpc. Interpolating inwards and assuming no heating, this inflow speed would become supersonic at r∼5 kpc, leading to rapid cooling interior to the sonic point (Quataert & Narayan2000)—these scales, which correspond to
one ACIS pixel, are beyond our ability to resolve given the bright central point source.
In Figure10we show the cooling time(tcool) profile for the Phoenix cluster. In the inner ∼15 kpc of the Phoenix cluster, the cooling time falls below 100 Myr, reaching as low as ∼10 Myr in the innermost bin. At 10 kpc, the cooling time is ∼50 Myr, shorter by a factor of ∼5 than any of the 91 cool core clusters in the ACCEPT sample(Cavagnolo et al.2009), any of
the 27 high-z cool core clusters from the SPT-Chandra sample (McDonald et al.2013b), or any of the 56 nearby, well-studied
cool core clusters from Hogan et al.(2017). It is clear from this
plot, which includes nearly every known cool core cluster spanning 0<z<1.5, that the Phoenix cluster is an outlier, and likely subject to a different evolution than the typical cluster.
We show in Figure 11 the ratio of the cooling time to the freefall time(tcool/tff), where the freefall time has been inferred from the strong lensing mass profile (Section 2.1). A value of
tcool/tff=10 has been proposed as a threshold below which ambient gas becomes highly susceptible to multiphase condensation (Gaspari et al. 2012; McCourt et al. 2012; Sharma et al.2012; Voit et al.2015), and Voit et al. (2018) has
shown that, over 3 orders of magnitude in mass, spanning galaxies like our Milky Way up to the richest galaxy clusters, no known system has tcool/tff<5 in its hot, diffuse halo. We find no evidence for a minimum in the tcool/tff profile, which reaches∼1 in the innermost bin. This is an order of magnitude
Figure 10.Cooling time as a function of radius for the Phoenix cluster(red points). We show, for comparison, 91 cool core clusters in the ACCEPT sample(Cavagnolo et al.2009), 57 cool core clusters from the sample of
Hogan et al.(2017), and 27 high-z cool core clusters from McDonald et al.
(2013b). In the inset, we show the [OII] image of the central galaxy, with
radii of 10, 20, and 30 kpc depicted as dashed circles. These radii are also highlighted in the profile, showing that the bulk of the cool gas is present at radii where the cooling time is 100 Myr. At these radii, the Phoenix cluster has the shortest cooling time of any known cluster by a substantial margin.
Figure 11.Cooling time normalized to the freefall time(tcool/tff; black) and to
the eddy time(tcool/teddy; red) as a function of radius for the Phoenix cluster.
These ratios have been used as predictors for the growth of thermal instabilities (e.g., Gaspari et al.2012,2018; McCourt et al.2012; Sharma et al.2012; Voit et al. 2015), where the denominator is meant to roughly approximate the
mixing time of the gas. Here, the freefall time has been calculated using the strong lensing model model, described in Section2.1, while the eddy timescale has been computed assuming a line of sight turbulence of 250 km s−1and a bubble diameter of 20 kpc(see Equation (5) in Gaspari et al.2018) . We show,
for comparison, 57 clusters from Hogan et al.(2017), for which the tcool/tff
ratio has been computed with careful consideration of the gravitational potential due to both the cluster and the central galaxy. The Phoenix cluster is an obvious outlier in the tcool/tffspace, as the only known cluster reaching a
value of unity in the core. The dotted black line and shaded gray region highlights the condensation threshold for these two ratios. This figure demonstrates that thermal instabilities are likely to develop within the central 30 kpc, where we see a significant amount of cool gas.
lower than in any other known group or cluster (Hogan et al.
2017), and the lowest value measured in any diffuse X-ray halo
(Voit et al.2018) with the exception of the inner 100 pc of M87
(Russell et al. 2018). The fact that Phoenix is the one system
that we know of where the hot, diffuse gas reaches tcool/tff∼1 on kpc scales, while simultaneously hosting the most star-forming central cluster galaxy, is likely not a coincidence.
For comparison, we also show in Figure 11the ratio of the cooling time to the eddy time (tcool/teddy), which has been proposed by Gaspari et al.(2018) as an alternative timescale to
govern the condensation of hot gas. Here, the eddy time has been computed following Gaspari et al. (2018) and assuming
σlos=250 km s−1 for the warm gas (McDonald et al. 2014) and a bubble diameter of 20 kpc (Hlavacek-Larrondo et al.
2015). Gaspari et al. (2018) proposed that thermal instabilities
will develop when tcool/teddy<1, which is typically satisfied at radii of∼10–20 for galaxy clusters. The Phoenix cluster is not unique in terms of its tcool/teddy profile, which is surprising given how big of an outlier it is in most other plots. Interestingly, the radial dependence of the eddy timescale is very similar to the freefall timescale in the Phoenix cluster, which is not the case for most other clusters (Gaspari et al.
2018). As such, we find that tcool/tff<10 and tcool/teddy<1 at r30 kpc, with the two profiles being statistically indis-tinguishable in Figure 11. This denominator-independent behavior is primarily driven by the steepness of the cooling
time profile, which has tcool∝r1.4, compared to the much shallower eddy timescale(∝r0.67) or freefall timescale (∝r0.8). Both the entropy and cooling time profiles exhibit behaviors that are unmatched in any other known cluster. The single power-law nature of these profiles, coupled with the fact that the tcool/tffratio reaches a minimum of∼1, is consistent with a steady, homogeneous coolingflow that is becoming thermally unstable in the inner∼10–20 kpc. We will return to this idea in more detail in the discussion below.
3.3. Thermodynamic Maps—Evidence for Asymmetric Cooling Thus far, the thermodynamic analysis has been purely one-dimensional, assuming spherical symmetry—here, we investi-gate the possibility that cooling may be asymmetric. In Figure12, we show the two-dimensional temperature, pressure, and entropy maps for the inner ∼100 kpc of the Phoenix cluster. These maps are made using the WVT binning algorithm, as described in Section 2.2.2. The temperature, pressure, and entropy maps show a relatively symmetric, circular cool core on large scales. On small scales, the coolest gas appears to be concentrated along a filament extending ∼20 kpc to the north, reminiscent of the cool core in A1795, which has a similar X-rayfilament extending to the south of the central galaxy (e.g., Crawford et al. 2005; McDonald & Veilleux2009; Ehlert et al.2015). This northern, low-entropy
filament is cospatial with both the northern radio jet, and the
Figure 12.Thermodynamic maps, showing temperature(left), pressure (middle), and entropy (right). Images are 330×330 kpc (top) and 66×66 kpc (bottom) on a side. In the lower panels, we show contours of constant[OII] surface brightness, highlighting the location of the cool, line-emitting gas. We highlight the highest
surface brightness emission with a thick white contour. Both the temperature and entropy profiles show a filament of cool, low-entropy gas to the north, extending ∼20 kpc. This asymmetric low-entropy region, which is also the location of the strongest X-ray absorption (see Figure7) is cospatial with the cool, line-emitting gas.
This region appears to be in, or close to, pressure equilibrium with the surrounding regions. There is some weak evidence for enhanced pressure to the east and west, which is primarily driven by an increase in density(i.e., the accompanying temperature increase is mild).
bulk of the cool gas, as shown in Figures5,7, and12. The spatial resolution of the X-ray data, combined with the difficulty of modeling the central point source, precludes us from making thermodynamic maps on similar scales to the HST or VLA data. To the degree that we can constrain its spatial distribution, the lowest entropy gas, with K2D∼5 keV cm
2
, appears to be confined to the same region as the highest column density [OII], suggesting that these two phases are linked. In the pressure
map, there is weak evidence(∼2σ) that the gas is either under-pressured in the north–south direction, or over-pressured in the east–west direction, or both. If gas is condensing along the cooling filament faster than a sound wave can cross it (e.g., Gaspari 2015), it ought to lead to an under-pressured region
such as this. Given that the cooling time of the gas in this filament is ∼10 Myr, and the sound-crossing time of a 10 kpc wide cooling filament is tcross∼l/cs∼10 kpc/[1480 km s−1 (Tg/108K)1/2]∼20 Myr, one may expect the gas to be slightly under-pressured in the region where gas is condensing most rapidly.
Given that the low-entropy gas is highly concentrated in a filament to the north of the central galaxy, our prior assumption of spherical symmetry when making thermodynamic profiles is unjustified. To investigate the azimuthal dependence of the thermodynamic profiles, we make two new sets of profiles, one a 90° wedge extending north and aligned with the radio jet and enclosing the low-entropyfilament, and the other a 270° wedge extending in all other directions and avoiding the low-entropy filament. We measure three-dimensional profiles following Section2.2.2, where we assume spherical symmetry in each of the wedges to simplify the model projection. The resulting entropy profiles are shown in Figure13. It is clear from these profiles, along with the spectral maps in Figure12, that the cool
core can be divided into three regions. Over the bulk of the cool core (r50 kpc), the entropy profile looks similar to most clusters, with a break in the entropy profile as seen in Babyk et al.(2018). The Phoenix cluster traces the lower envelope of
clusters from the ACCEPT sample(Cavagnolo et al.2009), but
does not appear to be a strong outlier in shape. In the inner ∼20 kpc, along a northern filament, the gas appears to be condensing, resulting in a steep entropy gradient at r∼10 kpc. The azimuthal entropy structure at that radius is highly asymmetric, exhibiting large differences in entropy along different directions from the center. At smaller radii the distribution of multiphase gas is more uniform in azimuth, and ambient gas in all directions has lower temperature, lower entropy, and tcool/tffapproaching unity. At these small radii our sampling becomes extremely coarse (10 kpc=3 ACIS-I pixels), so it is possible that the asymmetric cooling extends all the way to the center of the galaxy.
The thermodynamic maps and directional profiles suggest a cool core that has become prone to multiphase condensation that is occurring primarily along an∼20 kpc filament oriented in the same direction as the radio jets and the cool gas. While there is a chicken-and-egg question with the cool[OII] and the
low-entropyfilament—the fact that they are cospatial can can be explained via cooling of the ICM or mixing of already-cool gas (heating) with the ambient ICM—the situation with the radio emission is more straightforward. It is hard to imagine a scenario where cooling along a given direction would necessarily produce jets along the same direction, given the vastly different scales between this cooling filament and the orientation of the accretion disk. It is much more plausible that the coincidence of the coolfilament and the radio jets/bubbles are indicating that cooling is stimulated preferentially along this direction by a jet. We will investigate this possibility further in the discussion section.
4. Discussion
4.1. Cooling Flows, Star Formation, and Mixing The early cooling flow models predicted that gas ought to flow steadily inward as it cools, maintaining a power-law entropy profile and a constant cooling rate within each shell (e.g., Nulsen et al. 1982; Fabian et al. 1984). We know now
that the simple, steady, pure-cooling model does not apply to the vast majority of cluster cores, presumably due to heat input from black hole accretion that compensates for radiative cooling(i.e., AGN feedback). Here, we reconsider these early coolingflow models in the context of modern data, specifically comparing to these new observations for the Phoenix cluster. Following Voit (2011), we combine M r˙ ( ) =4p rr2 drdt with
= - t1 d K dt ln cool / to obtain p r a = M r r t 4 , 7 3 cool ˙ ( ) ( ) where a = d K d r ln
ln . This is essentially identical to Equation (12) of Voit(2011), but in a more convenient form for application to
observations. In a homogeneous steady-state coolingflow, the factorα implicitly accounts for gravitational work done on the cooling gas. This equation provides the mass inflow rate as a cooling shell passes through radius r with speed
º - ´ -v d K t dr ln cool 1
(
)
. Using Equation (7), we calculate theFigure 13.Three-dimensional entropy profile extracted along a northern wedge (90° opening angle, tilted west by 10° to match the position angle of the jet) and along the remaining 270°. These profiles show that the area surrounding the low-entropyfilament in Figure12is similar to a“typical” cool core cluster, with a shallower entropy profile between 10<r<50 kpc than at larger radii. At r<10 kpc, and along the northern filament, the entropy profile drops dramatically, indicating the onset of thermal instabilities.
inferred steady cooling rate as a function of radius for 91 cool core clusters in the ACCEPT sample(Cavagnolo et al. 2009),
where we have refit the entropy profile with a broken power law following Babyk et al.(2018). These profiles are shown in
Figure14, and exhibit a fairly general behavior. At large radii, the points occupy a locus atM˙ ~600Meyr−1, with no strong radial dependence. On the basis of Figure14, at radii30 kpc there is no strong evidence against gas cooling and flowing inwards. At small radii, however, the classical cooling rate is highly suppressed, by 2–3 orders of magnitude, as has been seen for decades in the centers of cool core clusters(see, e.g., Voigt & Fabian 2004; Fabian 2012). This is consistent with
X-ray spectroscopic observations, in which significant cooling is observed at high temperature (i.e., 4 2 keV) with only upper limits at low temperature(i.e., 1 0.5 keV; Peterson & Fabian 2006). The implication of Figure 14is that cooling in the inner∼50 kpc is being regulated by AGN feedback, leading to highly suppressed cooling rates in the inner∼10 kpc, and in turn, highly suppressed SFRs in the central galaxy (see McDonald et al. 2018for a recent summary)
We also show in Figure 14 the inferred cooling profile for the Phoenix cluster. This profile is relatively flat over 3 decades in radius, with a median value of ∼3000 Me yr−1 (see also Figure9). At small radii (r<10 kpc), the profile dips down to
∼800 Meyr−1, which is a relatively small change compared to the 2–3 orders of magnitude that most clusters decline at similar radii. We compare this profile to estimates of the cooling rate from XMM-RGS spectroscopy(Pinto et al.2018).
Based on Figure 8, we estimate that the cooling from
2 0 keV is localized to r<12 kpc, and that the gas cooling from4 2 keV is in a shell at 12<r<20 kpc. These data are within a factor of a few of the maximum cooling rate, providing additional evidence in support of a weakly suppressed coolingflow.
In the Phoenix cluster, at low temperatures(<2 keV), Pinto et al.(2018) measured an X-ray spectroscopic cooling rate of
-+
350 120150Meyr−1. This can be compared to SFRs measured in a variety of ways. Tozzi et al.(2015) modeled the far-IR SED of
the central galaxy and find an SFR of 530±50 Me yr−1, while McDonald et al. (2015) used a combination of far-UV
and optical spectroscopy to arrive at a total SFR of 610± 50 Me yr−1. Mittal et al. (2017) combined all available data
spanning a rest frame of 1000–10000 Å to arrive at an SFR of 454–494 Meyr−1, which is based only on the inner 20 kpc—a relatively conservative aperture correction would increase this to∼550 Meyr−1 (McDonald et al. 2015). All three of these
estimates of the SFR, which represent our best estimates to date, are consistent with one another and with the cooling rate derived from X-ray spectroscopy (Pinto et al. 2018), at the
∼1.5σ level. Both McDonald et al. (2015) and Mittal et al.
(2017) relied heavily on well-motivated extinction corrections,
which are factors of several, while Tozzi et al.(2015) relied on
a careful removal of the contribution to the far-IR luminosity from the central dust-obscured QSO.
The combination of the SFRs, XMM-RGS data(Pinto et al.
2018), and the classical cooling flow model (Figure 14), all
suggest that cooling is suppressed by a factor of∼5 in the inner ∼10 kpc of the Phoenix cluster, from rates of 2000–3000 Me yr−1 at larger radii and higher temperature. While significant, this is much less than the typical factor of∼100 found in nearly every other cluster, which led to the formation of the cooling flow problem (see, e.g., McDonald et al. 2018 for a recent summary of the literature). This factor of ∼5 reduction of the cooling rate could be provided by the central AGN, which is outputting (1.7–7.2)×1045 erg s−1 in energy (Hlavacek-Larrondo et al. 2015; McDonald et al. 2015) in the inner
∼20 kpc—exceeding the total cooling luminosity over the same volume.
The biggest inconsistency in this picture is the luminosity of the OVIλλ1032,1038 doublet (which probes gas at ∼105.5K) as measured using the HST Cosmic Origins Spectrograph and reported in McDonald et al.(2015). The reported luminosity of
7.55×1043erg s−1implies a cooling rate of 55,000 Meyr−1, which is considerably more than any of the other cooling or SFRs. This luminosity is corrected for extinction based on the young stellar populations, which is likely an overcorrection if the 105.5 K gas lies outside of the star-forming regions. Assuming no extinction—which represents an under-correction —implies a luminosity of LOVI=1.1×10
43 erg s−1. In a simple picture where the dust is contained within a shell of cooling gas, roughly half of the OVIflux will be extincted, so a
reasonable correction would be roughly a factor of 2, or LOVI=2×10
43 erg s−1. The implied cooling rate, using CLOUDY models (Chatzikos et al. 2015), is ∼15,000 Me
yr−1—still a factor of ∼50 higher than the measured cooling rate at low temperatures (for a more detailed discussion, see McDonald et al. 2015). Pinto et al. (2018) showed that the
observed OVI flux is consistent with an additional source of
photoionization with∼1 erg s−1cm and a power-law spectrum similar to those observed in AGN. If this is indeed the case, one
Figure 14. Classical cooling rate as a function of radius, defined following Equation (7). Gray squares show profiles for 91 cool core clusters in the
ACCEPT sample(Cavagnolo et al.2009), resampled to a common binning.
Black contours show the distribution of these profiles, which is relatively flat at r30 kpc, and steeply declining at interior radii. This rapid decline in the cooling rate at the center of the cluster is prime evidence that AGN feedback is effectively preventing cooling at these radii. Red points and the shaded red curve show the cooling rate profile for the Phoenix cluster, which is significantly flatter than the median cool core profile, with a central cooling rate elevated by a factor of∼103above the typical low-z cluster. Blue-shaded
regions show the XMM-RGS spectroscopic cooling rates from Pinto et al. (2018), where we have converted temperature bins into radial bins using the
three-dimensional temperature profile from Figure8. These data further support the picture in which cooling is proceeding with relatively little impedance at the center of the Phoenix cluster.
would expect an r−2 dependence to the OVI flux. However,
given the limited angular resolution of the HST-COS data, such measurements are not possible.
An alternative origin for the OVIemission is mixing layers. Shelton & Kwak(2018) showed that, for a small (<1 kpc), cool
(<104K) sphere falling through a hot (106K), low-density (10−4cm−3) medium, one would expect an OVIluminosity of ∼5×1034 erg s−1. Scaling this by a factor of 106to account for the significantly higher density in the ICM compared to these simulations, coupled with the fact that the OVIemission goes like the density squared yields an expected OVI
luminosity of 5×1040erg s−1 for a 5×10⁴ Mecool cloud mixing with a hotter medium. For a total luminosity of LOVI=2×10
43
erg s−1, this would imply 400 mixing clouds, or 2×10⁷Meof cool material mixing with the hotter medium. The fact that we detect ∼1000 times more cool gas than this implies that mixing of the hot and cool media could more than account for the observed OVIflux. Given the huge
extrapola-tions in going from the simulated geometry, temperatures, and densities to those in the Phoenix cluster, this comparison is meant to be illustrative and not definitive. It is worth noting, however, that evidence for mixing between the hot and cold phases has been observed in more nearby clusters, including Perseus (Fabian et al.2003b) and Virgo (Werner et al.2010).
In summary, the deep Chandra and XMM-Newton data, combined with a variety of star formation estimates, all support a picture in which∼500 Meyr−1is condensing out of the hot phase and forming stars in the inner ∼10 kpc of the Phoenix cluster. This implies that cooling is only weakly suppressed in the core of the Phoenix cluster, and that it is the closest system to a steady, homogeneous cooling flow that we have yet discovered. The high OVIλλ1032,1038 luminosity, coupled
with other high-ionization lines (McDonald et al. 2014),
implies that either the central AGN is providing significant ionization on ∼10 kpc scales, or perhaps more likely, that the cool gas is mixing with the hot ambient medium as it falls into the center of the cluster.
4.2. Compton Heating and Cooling
An uncommon feature of the Phoenix cluster is that it has a bright central X-ray point source, implying a rapidly accreting ( M0.1˙Edd) central supermassive black hole. There are only three other systems hosting central AGN that are accreting near the Eddington rate, at which point radiative feedback may be relevant to the heating/cooling balance (Russell et al. 2010).
Given that the characteristic Compton temperature is 0.7 keV (1.7 keV) for an unobscured (obscured) quasar, from Sazonov et al. (2004), we expect the radiation to effectively cool the
surrounding plasma, which ought to be hotter than the Compton temperature (e.g., Crawford et al. 1991). This may
not be the case in Phoenix, where the central AGN is heavily obscured(see Figure4).
We estimate the relative contributions to the energy density gain/loss from Compton cooling/heating and bremsstrahlung cooling as
e˙Brem= LBrem(T Z n, ) e2, ˙eComp= LComp(L T n, ) e2 ( )8
s p L = L -r n n k T T m c 4 4 , 9 e B e Comp X,bol T 2 T 2 C 2 ( ) ( ) where the analytic form of the Compton cooling function (Sutherland & Dopita 1993) includes the characteristic
temperature of the QSO emission(TC), the local temperature of the plasma (T), the bolometric X-ray luminosity of the central point source(LX,bol), the Thompson cross section (σT), and the ratio of the local electron to total particle density (ne, nT). The thermal cooling function ΛBrem(T, Z) is interpolated from a lookup table, taken from Sutherland & Dopita(1993).
We compare the relative contribution of these two processes as a function of radius in Figure15 for the Phoenix cluster, and for H1821+643, which has a central QSO that is roughly 30 times more luminous than in Phoenix(Russell et al.2010). For
H1821+643, the central QSO is unobscured, which implies that Compton cooling may be contributing at a similar level to bremsstrahlung cooling in the inner few kpc. For the Phoenix cluster, Compton cooling is contributing at a level∼3–4 orders of magnitude less than bremsstrahlung, and in the innermost region, an obscured quasar would lead to heating, rather than cooling. The vast difference between these two systems is due to the fact that the quasar in H1821+643 is a factor of ∼30× more luminous than in Phoenix, while the ICM in Phoenix is roughly an order of magnitude more dense, leading to a much stronger contribution from bremsstrahlung cooling.
In order for Compton cooling to be contributing at the same level as bremsstrahlung in the inner region of the Phoenix cluster, the central point source would need to be a factor of ∼1000× more luminous, which would imply an accretion rate 150× the Eddington rate. Thus, we can conclude that, while important for H1821+643 and potentially other low-mass systems with highly luminous central AGN, Compton cooling/ heating is unlikely to have played an important role in the thermodynamics in the cool core of the Phoenix cluster.
4.3. Reconciling Observations of Both Positive and Negative AGN Feedback in Phoenix
Figures7,12, and13suggest that the lowest entropy gas in the core of the Phoenix cluster is aligned along the north–south direction, and is the likely origin of the cool(104K) gas that is fueling star formation. In Figure5, we show that this is also the direction of the radio jets. Given how well matched the
Figure 15.Luminosity(cooling rate) per particle as a function of radius for the H1821+643 (left) and Phoenix (right) clusters. In black, we show the cooling rate due to thermal bremsstrahlung emission, based on the measured density and temperature profiles. The dotted blue (red) curves show the Compton cooling(heating) rate as a function of radius, where the upper curve is for a typical unobscured QSO spectrum, while the lower curve is for a typical obscured QSO spectrum(Sazonov et al.2004). This figure demonstrates that,
while Compton cooling is important for the lower-mass H1821+643 cluster, it is likely not contributing in a meaningful way to the thermodynamics at the center of the Phoenix cluster.

![Figure 5. On the left, we show the continuum-subtracted [O II ] emission map, with radio (yellow) and X-ray (white) contours overlaid](https://thumb-eu.123doks.com/thumbv2/123dokorg/8104003.124999/7.918.482.850.79.371/figure-continuum-subtracted-emission-radio-yellow-contours-overlaid.webp)