A
A
l
l
m
m
a
a
M
M
a
a
t
t
e
e
r
r
S
S
t
t
u
u
d
d
i
i
o
o
r
r
u
u
m
m
-
-
U
U
n
n
i
i
v
v
e
e
r
r
s
s
i
i
t
t
à
à
d
d
i
i
B
B
o
o
l
l
o
o
g
g
n
n
a
a
DOTTORATO di RICERCA in
Economia e Politica Agraria ed Alimentare
Ciclo XXIV
Settore Concorsuale di afferenza: 07/A1 Economia agraria ed estimo Settore Scientifico disciplinare: AGR/01 Economia ed estimo rurale
A regional environmental accounting matrix and
integrated environmental economic analyses to
support regional planning
Presentata da: Dott.ssa ELISA BONAZZI
Coordinatore Dottorato
Relatore
Prof. DAVIDE VIAGGI
Prof. MARCO SETTI
L’elaborazione e l’analisi di indicatori economico-ambientali
può contribuire a indirizzare lo sviluppo e l’evoluzione del
sistema produttivo regionale in un’ottica integrata e sostenibile
a livello territoriale.
Una corretta valutazione delle prestazioni ambientali non può
non prescindere dalla considerazione dell’eco-efficienza e
quindi dalla lettura delle performance integrate.
INDICE
Introduction 7
FIRST SECTION
1. Beyond economic indicators and conventional reporting system in a
sustainable perspective 16
2. Environmental Accounting and Satellite Accounts like NAMEA 27
3. RAMEA: a regional NAMEA for Emilia-Romagna 42
4. RAMEA air emissions 49
5. Regional eco-efficiency indicators to support sustainable planning 66
6. RAMEA air emissions updated on 2005 89
7. Further integrations of RAMEA following European and Eurostat
suggestions 98
8. Results 128
SECOND SECTION
CASO STUDIO 1 - Supporto per il Quadro Conoscitivo del Piano Regionale di gestione dei rifiuti: "Analisi della produzione in relazione agli indicatori strutturali di riferimento e al contesto
socio-economico"
1. Rifiuti Urbani. Contesto e metodologia 153
1.1 Crescita economica e degrado ambientale in un’ottica di sviluppo
economico sostenibile 153
1.2 Disaccoppiamento, delinking relativo, calcolo del fattore di decoupling
ed eco-efficienza 155
1.3 Review della letteratura 159
1.4 Curva di Kuznets ambientale e contesto socio-economico 161 1.4.1 Curva di Kuznets ambientale per i Rifiuti Urbani (Waste Kuznets
Curve) e Waste management 165
1.5 Waste Kuznets Curve su scala locale 168
1.6 Modello di Kuznets 171
1.7 Esempio di analisi per l’Italia 172
2. Rifiuti Urbani. Analisi socio-economica 174
2.1 Relazione tra la produzione di Rifiuti Urbani e alcuni indicatori
strutturali di riferimento su scala regionale in Emilia-Romagna 174 2.1.1 Individuazione di driver economici nell’analisi del trend di
2.2 Andamento degli abitanti residenti e degli occupati rispetto alla
produzione di Rifiuti Urbani 181
2.3 Relazione tra Reddito e produzione di Rifiuti Urbani secondo
l’interpretazione di Kuznets su scala regionale 183 2.3.1 Indicatore di eco-efficienza (efficienza economico-ambientale)
regionale per la produzione di RU 185
2.4 Relazione tra Reddito e produzione di Rifiuti Urbani su scala
provinciale e relativi indicatori di eco-efficienza 188 2.4.1 Scatter plot per provincia: Valore Aggiunto e RU pro capite 193 2.4.2 Scatter plot per provincia: Reddito pro capite e RU pro capite 198 2.4.3 Classifica delle province in base alle performance
economico-ambientali misurate dall’indicatore di eco-efficienza 208 2.5 Relazione tra la produzione di Rifiuti Urbani e indicatori strutturali di
riferimento su scala provinciale 213
2.5.1 Analisi per provincia 214
2.6 Sintesi dei risultati e implicazioni per le azioni di pianificazione 222
3. Rifiuti Speciali - Premessa 226
3.1 Matrici di conti economici integrati con conti ambientali: NAMEA 227
3.2 Un po’ di storia 230
3.3 Il progetto Interreg IIIC GROW “RAMEA - Regionalized nAMEA-type
matrix” 234
3.4 Le matrici NAMEA regionali: il lavoro di ISTAT 236
3.6 RAMEA air emissions in Emilia-Romagna 237
3.6.1 Il modulo economico (RAM) 239
3.6.2 Attribuzione delle responsabilità dirette per tematica ambientale 248 3.6.3 Intensità di emissione ed eco-efficienza delle attività produttive 251 3.7 RAMEA 2005 air emissions estesa a 3 temi ambientali 254
3.7.1 Il ruolo del sistema produttivo e delle famiglie: i profili
economico-ambientali 258
3.8 I conti ambientali: la produzione di rifiuti speciali 275 3.9 Valutazione delle prestazioni economico-ambientali di un territorio: il
tema dei rifiuti speciali 299
3.9.1 Intensità di pressione ambientale come indicatore di sintesi per
una lettura integrata delle performance economico-ambientali 302
3.10 I profili economico-ambientali 305
3.10.1 RAMEA 2005 estesa ai Rifiuti Speciali e Imposte ambientali 306 3.10.2 RAMEA 2007 estesa ai Rifiuti Speciali e alle Imposte ambientali 313
3.10.3 RAMEA 2008 estesa ai Rifiuti Speciali 320
3.10.4 RAMEA 2009 estesa ai Rifiuti Speciali 325
3.11 Intensità della produzione negli anni 329
3.12 Come si posizionano negli anni i settori produttivi dal punto di vista
3.12.1 Tassi di crescita delle variabili economiche e delle pressioni
ambientali (2005, 2007) 336
3.12.2 Tassi di crescita delle variabili economiche e delle pressioni
ambientali (2008-2009) 339
3.13 Sintesi dei risultati e implicazioni per le azioni di pianificazione 341
CASO STUDIO 2 - Analisi integrata delle filiere regionali nella valutazione di coerenza ambientale del Rapporto Ambientale del Programma Regionale Attività Produttive 2012-2015
4. Analisi integrata delle filiere regionali nella sezione Valutazione del contesto
di riferimento ambientale del Rapporto Ambientale Programma Regionale
Attività Produttive 2012-2015 345
4.1 Filiera della moda 347
4.2 Filiera delle costruzioni e dell’abitare 350
4.3 Filiera della meccanica 354
4.4 Filiera della salute 358
4.5 Filiera dell’agroalimentare 362
4.6 Filere: dati socio economici e ambientali integrati 366 4.7 Segmentazione delle filiere integrate per emissioni serra e addetti 369
Conclusioni 371
Bibliografia 392
7 Introduction
This research deals with a regional environmental accounting matrix named RAMEA, a regional NAMEA (National Accounting Matrix including Environmental Accounts) built for Emilia-Romagna region (Italy). After a brief introduction to depict the international context in which this research takes place, this thesis explains the structure and the development of the matrix and possible policy uses related to some applications of the study.
The overall aim of this research is finalized to develop and outline this tool to make it available for the environmental assessments of regional plans and programmes, generally to support regional policy makers‟ decisions. The study, aiming at drawing up sustainable reports and monitoring effects of regional policies, can be put in the global context of the widespread needing to integrate economic indicators and go beyond conventional reporting system (following the international initiative “Beyond GDP”, Stiglitz commission1
, and further events and outcomes).
The research has been focussed since 2008 mainly on the development of RAMEA, related extensions to new environmental themes provided by Eurostat framework and some applications of the tool.
RAMEA matrix (Regional Accounting Matrix including Environmental Accounts) for Emilia-Romagna, is the regional version of an Italian NAMEA matrix. RAMEA air emissions is the result of one of the 16 Projects financed by the INTERREG IIIC Program 2005-2007 under GROW, the Regional Framework Operation (RFO) whose main topic is to help Regions in adopting strategies coherent with the Lisbon & Gothenburg Agendas goals (Sansoni, Bonazzi, Goralczyk, Stauvermann, 2010).
NAMEA statistical structure derives from official and standardized systems (SNA 1993, SEEA 2003, ESA 1995).
This project involved 7 partners of 4 different European regions, which have worked together for two years to build 4 regional NAMEA: Emilia-Romagna in Italy, South East England, Noord Brabant in Holland and Malopolska in Poland. The regions involved in the Project were chosen for their common goal of achieving sustainable economic growth through international cooperation and
1
8 efficient resource management. The Lead partner of the project was ARPA Emilia-Romagna2 together with Emilia-Romagna Region. The further development of RAMEA in Emilia-Romagna was also encouraged by European Commission, the regional Government and has been carried out in this thesis.
The attempt was to develop an environmental accounting matrix (De Haan and Kee, 2004) at a regional scale, following international guidelines, in order to define strategic tools in support to policy makers‟ work.
In particular this work has been focused on the possibility to integrate RAMEA matrix with new environmental themes beyond the air emissions one, like energy consumptions, industrial waste, environmental taxes, aiming at steering a sustainable economy in order to improve the knowledge base in support to policy makers, as pointed out by Eurostat in 2009 (Eurostat 2007c; Eurostat 2008b), using available data provided also by Eurostat, ISTAT and according to NAMEA3 scheme. The NAMEA consists of the framework of National Accounts with the supply and use of goods and services expressed in monetary units linked with integrated environmental accounts where the input of resources and output of emissions and pollutants are expressed in physical units (Eurostat, 2007a).
Since the application to policies is a fundamental requisite for environmental accounting tools that aspire to be more than just mere compilation of data, RAMEA has been thought as a decision support system for regional sustainable development.
Working on environmental accounting has been proceeding in many countries in response to national and international recommendations. The United Nations Conference on the Environment and Development in 1992 and the resulting document, Agenda 21, strengthen „a program to develop national systems of integrated environmental and economic accounting in all countries […]‟ together with the needing to integrate environment and development in the decision making in order to improve the policy tools from an environmental-economic point of view (21, ch.8). Starting from the World Commission on Environment and Development (Brundtland Commission, 1987),
2
Regional Environmental Agency (set up by the regional Law 44/95) 3
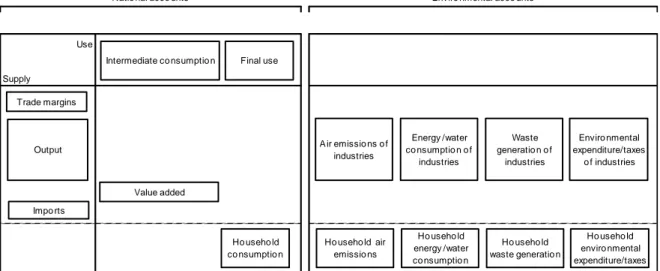
The relationship between the environment and the national economy is provided by the National Accounting Matrix including Environmental Accounts (NAMEA), introduced by the Dutch Statistics in 1993. It has been developing since 1995 by Eurostat (Statistical Office of the European Communities). The NAMEA consists of the framework of National Accounts with the supply and use of goods and services expressed in monetary units linked with integrated environmental accounts where the input of resources and output of emissions and pollutants are expressed in physical units (Eurostat, 2007a).
9 following with the Earth Summit in Rio de Janeiro (UN 1992), the Millennium Declaration (UN, 20004) and the Conference “Beyond GDP”5 (EC, OECD, WWF, Club of Rome 2007; Almunia J 2007) there was a great deal of interest in developing a broader set of statistics to supplement the System of National Accounts and to give values to things left outside the traditional economic system.
Around the world a consensus is growing that countries and governments need to develop a more comprehensive view of progress, rather than focusing mainly on economic indicators such as Gross Domestic Product (GDP) (Halstead, 1998 cited in Hall, 2005 pp. 727–746).Commissioner Dimas stated that “...we will also need to speed up and improve the development of integrated accounting in the social and environmental spheres”. According to Commissioner Almunia, in the long term, integrated environmental and economic accounting is likely to be the "strongest tool" for supporting the promotion of well-being and progress6.
Non-market variables like environmental externalities (e.g. air pollution) are not counted in the GDP. From international to local scales there is a growing emphasis on “evidence based policy-making” which needs better measures of the current programs and policies, thus requiring statistical and analytical approaches that go beyond national borders and conventional reporting systems. This process has shown some weaknesses: in several countries, data used to calculate indicators do not come from national statistics, but are estimated by international organisations; this need derives also from the widespread lack of data that should be provided by official institutes (Hall, 2005). Several international and supranational organizations have established collections of statistical indicators to measure economic, social and environmental phenomena. Some of these measures are used to design sector policies and to monitor their effects. A key indicator system would pull together these various measures to tell how a region or nation is doing.
The different kind of approaches generally fall into three broad types: 1) the extension of the basic national accounts schemes to cover social, economic and environmental dimensions (satellite accounts7); 2) the use of a wide range of indicators and composite indicators referring to economic, social and environmental dimensions; 3) the use of “subjective” measures of well-being. (Matthews, 4 http://www.un.org/millenniumgoals/ 5 http://www.beyond-gdp.eu/ 6
Please consult http://www.beyond-gdp.eu/ for further information. 7
10 2006). The selection of key indicators is a political process and needs to be carried out in supporting policy-makers decisions.
In June 2006, the European Council adopted an ambitious and comprehensive renewed EU Strategy for Sustainable Development8. It stated that: „For better understanding of interlinkages between the three dimensions of Sustainable Development, the core system of national income accounting could be extended by inter alia integrating stock and flow concepts and non-market work can be further elaborated by satellite accounts e.g. environmental expenditures and hybrid accounts, taking into consideration international best practices‟ (Eurostat 2008a pag. 2). The strategy invites all EU institutions and Member States to use specific tools, such as impact assessments, in order to ensure that major policy decisions are based on robust proposals, assessing in a balanced way their social, environmental and economic impacts. Furthermore, the renewed strategy emphasises the cost-effectiveness of market-based instruments to deliver its objectives.
The existing European Strategy on Environmental Accounting (2003) has been reviewed and renewed in 2008. Accelerating the production of data, documenting existing statistical collection approaches, extending environmental accounting methodologies and encouraging the use of accounting data in policy-relevant analyses are some of the driving forces for focusing the European efforts regarding environmental accounts.
The Revised European Strategy for Environmental Accounting, ESEA 2008, (Eurostat, 2008a) helps to ensure the availability of important environmental accounts data from all European countries and has enabled these data to be harmonised, timely and of adequate quality, in order to facilitate their use in developing and informing policy. In addition, the strategy has also encouraged the further development of environmental economic accounts as a statistical area.
The Strategy focuses on environmental-economic accounting that helps to bring together statistics in coherent frameworks or accounts that allow disparate datasets to be coordinated in such a way that cross-cutting analyses can be made with confidence.
The Revised ESEA Task Force recommends that the priority for environmental accounts focuses primarily on physical and monetary flows including hybrid accounts, like NAMEA, economic
8
Council of the European Union 10917/06, Review of the EU Sustainable Development Strategy (EU SDS) - - Renewed Strategy, adopted by the European Council on 15/16 June 2006, ANNEX
11 information on the environment and economic activities and products related to the environment and other environmentally related transactions such as taxes and subsidies (Eurostat 2008a pag. 11). Linking environmental and economic indicators encourages and facilitates the involvement of the decision makers who are going to pay an increasing amount of attention to the effects of economic activities on the environment.
In the long run Eurostat aims at developing all accounts for environmentally related transactions. In the short run Eurostat‟s activities will focus on the environmental taxes (Eurostat, 2008a):
a) by compiling tax revenues by categories (transport, energy, pollution/resources) from the voluntary “detailed tables” received from the national accounts data collection
b) by more detailed information on environmental taxes through breaking down taxes by category according to industries
In 2001 Eurostat published a guideline and standard reporting tables for environmental taxes by final user which were endorsed by the plenary meeting of environment statistics and accounts in 2003. Those tables have a clear link to the NAMEA-air standard tables. Environmentally related taxes can often usefully be implemented in the context of instrument mixes, in combination with other policy instruments, such as command and control regulations, voluntary approaches, and environmental accounting tools. Among environmental policy tools, environmental taxes are considered to be environmentally effective, and economically efficient. The OECD has supported the use of these instruments, and has carried out an analysis of their implementation (OECD, 2000). The Sixth Community Action Programme on the Environment, approved in 2002, recommends the use of economic instruments (energy taxes, taxes on resources, ...) in order to mitigate climate change and promote sustainable use of resources.
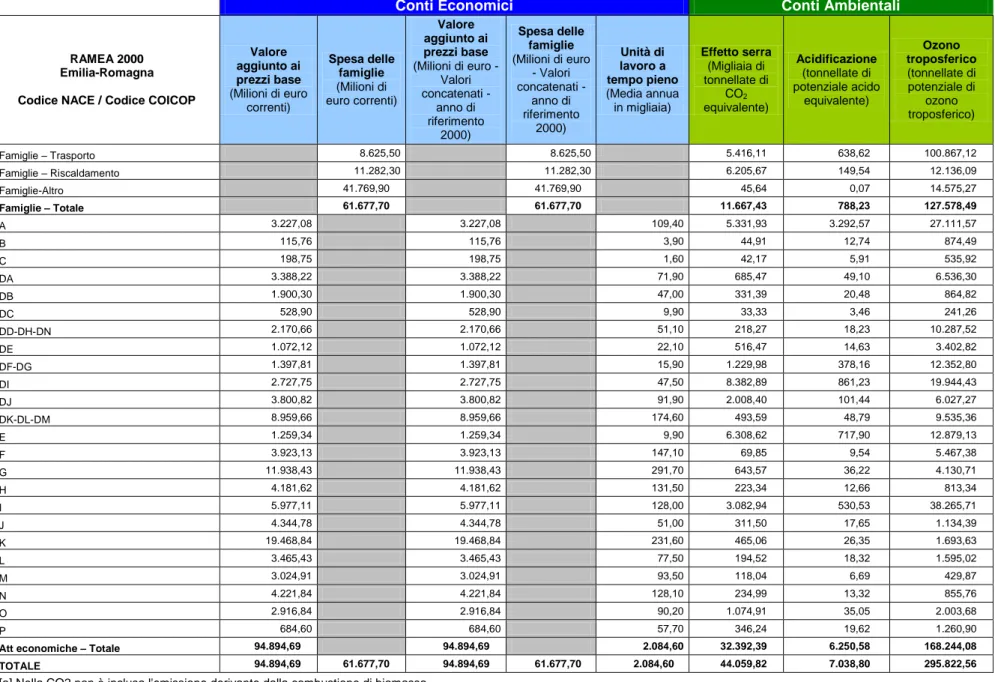
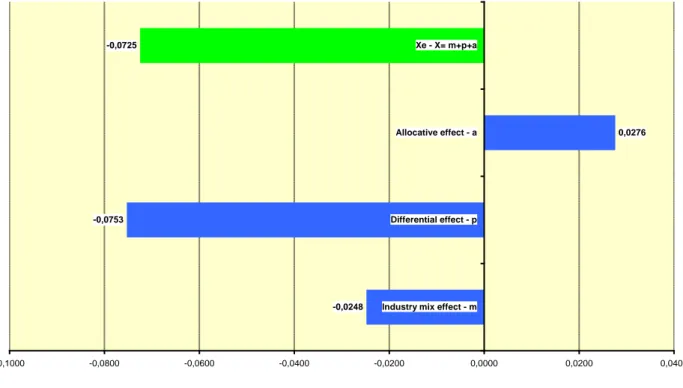
Starting from RAMEA air emissions, an eco-efficiency analysis of the regional economic system was developed. Then by means of a Shift-Share analysis the causes of the positive advantage of the region, in comparison with the national average, have been quantified.
In particular, as said, this study has been focussed on the extension of RAMEA air emissions matrix to other environmental schemes like eco-taxes. The key concept is the possibility of steering a sustainable economy, e.g. investigating the use of environmental taxes coordinated with RAMEA and by means of integrated analyses.
12 A more complete environmental accounting system so built, indeed, could explain and cover the complex structure of the regional economy and related environmental performances.
By means of policy tools like extended regional NAMEA and the elaboration of eco-efficiency (economic-environmental efficiency) indexes, transforming data into knowledge, we aimed at building a decision support system able to help policy makers in environmental assessments in order to steer a regional sustainable development and planning.
The common thread of this thesis, deriving from the building of a regional NAMEA like RAMEA, is the analysis and elaboration of the eco-efficiency indexes and related meaning, thanks to integrated indicators provided by RAMEA. Eco-efficiency indexes (expressed as the inverse ratio of intensity of pressures) allow integrated environmental-economics analyses useful to support a sustainable planning.
An environmental accounting system, like RAMEA, could be useful to evaluate the integrated economic and environmental performances of regions and to inform regional policies/strategies about sustainable development (households‟ consumptions, employment, air emissions and other environmental pressures, production and value added of economic activities). RAMEA is based on an internationally accepted methodology (UN, Eurostat), reliable data (official statistical accounts) and standardized systems. These conditions ensure its coherency with similar tools at national level (NAMEA).
RAMEA could be moreover scheduled for different kinds of analyses, to support the regional planning/reporting, e.g.: monitoring regional air emissions and eco-efficiency, comparing regional eco-efficiency with the national one, understanding the indirect effects/responsibilities of production and consumption chains on the environment (Input-Output analysis). (Bonazzi and Sansoni, 2008).
Since the overall aim of this research aims is the development and the outline of the tool to make it available for the environmental assessment of regional plans and programmes, after the setting of this environmental accounting matrix, two case studies have been carried out. While the first part of the thesis concerns the deepening of the methodology used, the second part focuses on the application on two regional case studies, carried out in 2011-2012.
13 Each application has been highlighted in order to support regional planning in Emilia-Romagna. Both the case studies concern two different kind of application of integrated environmental-economic analyses regarding two Strategic Environmental Assessments (2001/42/EC).
The Directive 2001/42/EC of the European Parliament and of the Council on the assessment of the effects of certain plans and programmes on the environment deals with: the “environmental assessment” that “ …shall mean the preparation of an environmental report, the carrying out of consultations, the taking into account of the environmental report and the results of the consultations in decision-making and the provision of information on the decision in accordance with Articles 4 to 9” ( art. 2 b); “environmental report” that “..shall be prepared in which the likely significant effects on the environment of implementing the plan or programme, and reasonable alternatives taking into account the objectives and the geographical scope of the plan or programme, are identified, described and evaluated.” (art. 5); “the monitoring” as “Member States shall monitor the significant environmental effects of the implementation of plans and programmes in order, inter alia, to identify at an early stage unforeseen adverse effects, and to be able to undertake appropriate remedial action.” (art. 10).
Then “The objective of this Directive is to provide for a high level of protection of the environment and to contribute to the integration of environmental considerations into the preparation and adoption of plans and programmes with a view to promoting sustainable development, by ensuring that, in accordance with this Directive, an environmental assessment is carried out of certain plans and programmes which are likely to have significant effects on the environment.” (art. 1). In compliance with this Directive the research could be useful to integrate a SEA in some of these required parts.
The first case study has concerned a contribution to the preliminary document fit up to depict the context in which a specific plan should take place: the description and the analysis of the socio-economic context, strengths and weaknesses, in relation with the environmental performances. This study has so been applied on the regional management Waste Plan in Emilia-Romagna (Piano Regionale di gestione dei Rifiuti), for what it is called in Italy Quadro conoscitivo, following the Italian law D.lgs 152/06, that adopted the 2001/42/CE, and the regional Framework Law 20/2000 on the protection and use of the regional area. In detail the first case study concerning integrated environmental-economic analyses have so been drawn up regarding the trend of waste production (industrial and urban ones) in relation with the structural performance indicators (socio-economic ones) during the period 2000-2010. In the case of the industrial waste production, an updated and
14 extended RAMEA has been developed and deepened, as a useful policy tool, to help the depiction and monitoring of the state of the integrated economic-environmental performances in the regional context.
The second case study deals with a second application to an Environmental Strategic Assessment, regarding the elaboration of the Environmental report (Italian D.lgs 152/06 art.13) for the regional Triennal Productive activities Programme (Programma Triennale delle Attività Produttive 2012-2015). RAMEA, in its updated version, has been applied aiming to an integrated environmental economic analysis of the regional context, to understand and explain the environmental-economics data of the regional production chains considered by the Programme, in order to describe and monitor the environmental effects of the Programme from an integrated environmental economics point of view.
Both the case studies have been elaborated and written in Italian to be applied and used in an Italian context and to be in support of regional decision makers.
The attempt has been to develop an environmental accounting matrix at a regional scale integrating it with other environmental schemes in order to define strategic tools in support to policy makers work, also following the Eurostat policy questions scheme (Eurostat, 2009) and trying to set up useful policy tools able to answer.
It is to remark the research is based on official data and standardized systems: if estimated data have been used it has been clearly pointed out in the text.
15
16 1. Beyond economic indicators and conventional reporting system in a sustainable
perspective
For a quick recap, in 1987 the World Commission on Environment and Development (Brundtland Commission) called for the development of new ways to measure and assess progress towards sustainable development. The 1992 Earth Summit in Rio de Janeiro was a further catalyst for discussion (United Nations 1992), as were calls from organisations such as the United Nations for better measures of social concerns to supplement the System of National Accounts. Following with the Earth Summit in Rio de Janeiro (UN 1992), the Millennium Declaration (UN, 2000
http://www.un.org/millenniumgoals/) and the International Conference “Beyond GDP” 9(EC, OECD, WWF, Club of Rome 2007; Almunia J 2007) there has been a great deal of interest as well in developing a broader set of statistics that give values to things left outside the traditional economic system.
As it is known, Gross Domestic Product (GDP) was introduced following the Great Depression, in order to help politicians steer the economy towards key economic objectives and provide a solid basis to address economic policy decisions. The GDP was a powerful tool to calculate production capacity in wartime, and it remains arguably the most important tool for economic policy today. An entire range of economic information is summarised in this one number and it can be decomposed to guide specific policies (Haggart, 2000). Today GDP has become rightly the foremost measure of economic activity (Almunia 2007). As a universally recognised and accepted system, it allows us to compare the economic performance of different countries worldwide and to track economic developments over an extended period of time.
Around the world a consensus is growing that countries and governments need to develop a more comprehensive view of progress, rather than focusing mainly on conventional economic indicators such as Gross Domestic Product (GDP) (Halstead, 1998 cited in Hall, 2005 pp. 727–746)10 .
In 1995, the USA‟s Atlantic Monthly magazine published an article entitled “If the GDP is Up, Why is America Down?” The authors described a time during the Clinton Administration when the economy was booming according to the standard economic measures - productivity and
9 Commissioner Dimas stated that “..we will also need to speed up and improve the development
of integrated accounting in the social and environmental spheres”. According to Commissioner Almunia, in the long term, integrated environmental and economic accounting is likely to be the "strongest tool" for supporting the promotion of well-being and progress. Please consult http://www.beyond-gdp.eu/ for further information.
10J Hall, „Measuring Progress – An Australian Travelogue‟ [2005] Journal of Official Statistics, Vol.
17 employment were high and inflation was under control. However, the American people were not experiencing the euphoria they should have been according to the figures (Matthews 2006).
On 18th March in 1968, Robert Kennedy already had said:
“We cannot measure neither national spirit by the Dow Jones Average, nor national achievement by the Gross National Product. The GNP includes air pollution, and ambulances to clear our highways from carnage. ..includes the destruction of the redwoods and the death of Lake Superior. It grows with the production of napalm and missiles and nuclear warheads.... It includes... the broadcasting of television programs which glorify violence to sell goods to our children. And if the Gross National Product includes all this….it does not allow for the health of our families, the quality of their education, or the joy of their play.. the intelligence of our public debate or the integrity of our public officials... It measures everything, in short, except that which makes life worthwhile, and it can tell us everything about America -- except whether we are proud to be Americans." (Robert F. Kennedy, 18th March 1968, University of Kansas)
Nowadays policy makers, economists and official Statistics often use GDP as an indicator of the welfare of the societies. However, welfare and the broader term wellbeing depend on more aspects than economic performance alone and therefore benefits from a multidimensional approach.
An important aspect of wellbeing is its sustainability. Indicators should measure the success of a society in achieving progress in the short term without damaging prospects for continued progress in the long term.
Dutch Statistics advocated the use of an integrated accounting system for the measurement of wellbeing instead of using a set of footloose indicators or one single indicator
The main reasons why the GDP is not considered to be an appropriate proxy for well-being are many:
the GDP is simply a gross total of the market value of all final goods and services produced within a country in a given period of time.
it takes into account only transactions in which money changes hands, resulting in an indicator that ignores improvements in, or harms to, our social structure or our environment.
it is often referred to as “a calculator that can add but not subtract” since it does not make distinctions between productive and destructive activities. Higher crime rates, increased pollution, and destruction of natural resources can show up in the GDP as gains. Hurricane Katrina was, therefore, advantageous for the GDP. The Enron financial scandal in the U.S - contributed $1 billion to the U.S. economy.
18 GDP excludes a range of non-market activities that influence well-being, due frequently to practical concerns with measuring them, because their value is not easily defined in market terms. These include not only illegal activities and home activities like housework and do-it-yourself work, but also leisure, which is clearly of value to society and important to well-being. Conventional measurements of GDP exclude changes in asset values, although these clearly influence what an individual can consume in the current period without becoming worse off.
Therefore, GDP more accurately reflects what a society produces than what it can consume. GDP does not take account of externalities, such as pollution or environmental deterioration, nor of depletion of non-renewable resources. This distorts how much market prices actually reflect the marginal contribution of certain items to well-being, including those of future generations. GDP does not distinguish inter-country differences in the distribution of income. To most people, a huge increase in national income that goes exclusively to a tiny handful of very wealthy families will not increase general well-being as much as if it were more equitably distributed.
GDP measures not even the sustainability of growth. A country may achieve a temporarily high GDP by over-exploiting natural resources or by misallocating investment. In fact, a country may have an abundance of natural resources that do not have any value according to the GDP until they are destroyed and used for consumption.
Otherwise the GDP remains arguably the most important tool for economic policy today. However without calling into questions its merits, the GDP was never intended to be used as a measure of well-being, standard of living, or progress. Indeed, its creator Simon Kuznets in 1962 (cited in Matthews 2006:3), warned against its misuse: “Distinctions must be kept in mind between quantity and quality of growth, between its costs and returns, and between the short and the long run. […] Goals for „more‟ growth should specify more growth of what and for what”.
In the past 40 years experts have been searching to reduce the focus on GDP as the key measure of national progress, by replacing GDP with an accepted measure or sets of measures, or also by modifying or supplementing the national accounts with some other more thorough reflecting the wellbeing of societies.
Non-market factors such as environmental externalities, air pollution, household production, unpaid child-care, care for the sick or elderly are not counted in the GDP. This might be especially significant for developing countries where much of the production takes place in the home or outside of the market.
For many years, using a monetary measure like GDP per capita as a proxy for the population‟s wellbeing made much sense, at least for developed countries. GDP per capita provides an accurate measure of a country‟s capacity to deal with the material needs of its residents. And so long as the
19 basic necessities of life remain scarce, additions to GDP per capita can be expected to equate closely with improvements in meeting the population‟s basic needs, and hence in greater well-being.
The consensus on the use of GDP per capita as a good proxy measure of well-being is, however, becoming less obvious also for economists, as the more developed societies move from a situation of scarcity to a situation of plenty. The intuitive notion that, once a certain level of material needs has been met, further increments in economic growth will not yield the same improvements in the well-being of the citizens is backed up by numerous studies that indicate that this divergence between added income and added well-being holds true both within and across societies. At the same time, concerns have emerged on how economic growth led in many countries to environmental depletion, an element that is not included at all in GDP.
Several studies have been published over the last two decades on alternative measures of well-being/quality of life/ sustainable development/ societal progress, all terms closely related to each other.
Academic researchers, official statisticians and international organisations have proposed alternative measures, which can be classified according to different criteria.
A consensus has not been emerged yet on the best way to go, but with the “Istanbul Declaration” – signed in June 2007, at the end of the II OECD World Forum on “Statistics, Knowledge and Policy” by the European Commission, the OECD, the Organisation of the Islamic Conference, the United Nations, the United Nations development Programme and the World Bank – it can said that the need to go “beyond GDP” is now fully recognised at political level.
From international to local scales there is a growing emphasis on “evidence based policy-making” which needs better measures of the current programs and policies, thus requiring statistical and analytical approaches that go beyond national borders and conventional reporting systems. This process has shown some weaknesses: in several countries, data used to calculate indicators do not come from national statistics, but are estimated by international organisations; this need derives also from the widespread lack of data that should be provided by official institutes (Hall, 2005).
Several international and supranational organizations have established collections of statistical indicators11 to measure economic, social and environmental phenomena. Some of these measures
11
An indicator is a quantitative or a qualitative measure derived from a series of observed facts that can reveal relative positions (e.g. of a country) in a given area. When evaluated at regular intervals, an indicator can point out the direction of change across different units and through time. In the context of policy analysis, indicators are useful in identifying trends and drawing attention to particular issues. They can also be helpful in setting policy priorities and in benchmarking or monitoring performance. A composite indicator should ideally measure multi-dimensional concepts which cannot be captured by a single indicator alone, e.g., sustainability (Nardo, Saisana, Saltelli, Tarantola, Hoffman, Giovannini,, 2005, pag. 8).
20 are used to design sector policies and to monitor their effects. A key indicator system would pull together these various measures to tell how a region or nation is doing. The different kind of approaches generally fall into three broad types: the extension of the basic national accounts schemes to cover social and environmental dimensions (satellite accounts12); the use of a wide range of indicators and composite indicators referring to economic, social and environmental dimensions; the use of “subjective” measures of well-being (Matthews, 2006). The selection of key indicators is a political process and needs to be carried out in supporting policy-makers decisions. In June 2006, the European Council adopted an ambitious and comprehensive renewed EU Strategy for Sustainable Development13.
The overall aim of the renewed EU SDS is to identify and develop actions to enable the EU to achieve continuous improvement of quality of life both for current and for future generations, through the creation of sustainable communities able to manage and use resources efficiently and to tap the ecological and social innovation potential of the economy, ensuring prosperity, environmental protection and social cohesion.
The renewed EU SDS concludes in its document 10917/06, paragraph 20: „For better understanding of interlinkages between the three dimensions of Sustainable Development, the core system of national income accounting could be extended by inter alia integrating stock and flow concepts and non-market work and be further elaborated by satellite accounts e.g. environmental expenditures and hybrid accounts like NAMEA14, taking into consideration international best practices.‟.
The strategy invites all EU institutions and Member States to use specific tools, such as impact assessments, in order to ensure that major policy decisions are based on robust proposals, assessing in a balanced way their social, environmental and economic impacts. Furthermore, the renewed strategy emphasises the cost-effectiveness of market-based instruments to deliver its objectives. Among the objectives and principles related to good governance, the policy guiding principles provide to “make polluters pay” which ensures that prices reflect the real costs to society of consumption and production activities and that polluters pay for the damage they cause to human health and the environment.
12
Please consult the OECD Glossary of Statistical terms: http://stats.oecd.org/glossary/detail.asp?ID=2385 13
Council of the European Union 10917/06, Review of the EU Sustainable Development Strategy (EU SDS) − Renewed Strategy, adopted by the European Council on 15/16 June 2006, ANNEX
http://ec.europa.eu/environment/eussd/
14
The relationship between the environment and the national economy is provided by the National Accounting Matrix including Environmental Accounts (NAMEA), introduced by the Dutch Statistics in 1993. It has been developing since 1995 by Eurostat (Statistical Office of the European Communities). The NAMEA consists of the framework of National Accounts with the supply and use of goods and services expressed in monetary units linked with integrated environmental accounts where the input of resources and output of emissions and pollutants are expressed in physical units (Eurostat, 2007a).
21 The Sixth Community Action Programme on the Environment, approved in 2002, recommends the use of economic instruments (energy taxes, taxes on resources, ...) in order to mitigate climate change and promote sustainable use of resources.
The existing European Strategy on Environmental Accounting (2003) has then been reviewed and renewed. Accelerating the production of data, documenting existing statistical collection approaches, extending environmental accounting methodologies and encouraging the use of accounting data in policy-relevant analyses are some of the driving forces for focusing the European efforts regarding environmental accounts.
Linking environmental and economic indicators encourages and facilitates the involvement of the decision makers who are going to pay an increasing amount of attention to the effects of economic activities on the environment.
In Communication of 20 August 2009 entitled „GDP and beyond: Measuring progress in a changing world‟, the European Commission recognised the need to supplement existing indicators with data that incorporate environmental and social aspects in order to allow more coherent and comprehensive policy making. To that end, environmental economic accounts provide the possibility of monitoring the pressures exerted by the economy on the environment. Environmental economic accounts show the interaction between economic, household and environmental factors and consequently are more informative than national accounts alone.
They provide a significant source of data for environmental decisions and the Commission of the European members should consult them when drawing up impact assessments. In line with the tenets of sustainable development and the drive to achieve a resource-efficient and low-pollution economy, embedded in the Europe 2020 Strategy and various major initiatives, developing a data framework that consistently includes environmental issues along with economic ones becomes extremely relevant.
The above Communication represents one of the main steps‟ achieved in the path engaged by the previous international organizations to go beyond GDP.
In November 2004 the OECD launched the first of a series of global Forum The first World Forum on “Statistics, Knowledge and Policy” in Palermo to discuss the use of key indicator systems for policy making. In attendance were 540 people from 43 countries representing various constituencies (policy makers, academia, civil society, media, statisticians, etc.).
The success of the Palermo Forum prompted the OECD to embark on a long-term Global Project on Measuring the Progress of Societies. The Project‟s goal is to create a global community who come together both at events and virtually to share best practices and build capacity to answer the key question: How can we measure how our societies are really doing? There are various steps
22 along the way to this goal. In addition to technical workshops, there should be regional Forums all over the globe (Latin America, Korea, Middle East and Africa). These Forums will both raise awareness of the Project as well as identify key leaders and success stories to be shared at the main event. The success of this initial world forum stimulated the organization of the second World Forum, held in Istanbul in June 2007: the 2nd OECD World Forum on Statistics, Knowledge and Policy in Istanbul 27-30 June 2007(http://www.oecd.org/site/worldforum06/). World Forums should take place every 2-3 years from 2007 onwards like the Third World Forum took place in Korea in 2009 and the OECD World Forum on “Statistics, Knowledge and Policy” was held in Busan, Korea on 27-30 October 2009.
This OECD World Forum focused on Charting Progress, Building Visions, Improving Life and attracted high level participants with a mixture of politicians and policy makers, opinion leaders, Nobel laureates, statisticians, academics, journalists and representatives of civil society from many countries. The 3rd OECD World Forum, was organised by the OECD and the Government of Korea (Korean National Statistical Office).
On 16-19 October 2012, the OECD organised, jointly with the Government of India, the 4th OECD World Forum on Statistics, Knowledge and Policy under the theme “Measuring Well-Being for Development and Policy Making”. Building on the Better Life Initiative, the main objectives of the Forum were to further the discussions on the different aspects that make for a good life today and in the future in different countries of the world and to promote the development and use of new measures of well-being for effective and accountable policy-making. Increasing concerns have been raised since a long time about the adequacy of current measures of economic performance, in particular those based on GDP figures. Moreover, there are broader concerns about the relevance of these figures as measures of societal well-being, as well as measures of economic, environmental, and social sustainability.
Reflecting these concerns, President Sarkozy decided in 2008 to established the Stiglitz-Sen-Fitoussì Commission (http://www.stiglitz-sen-fitoussi.fr/en/index.htm), to look at the entire range of issues. Its aim was to identify the limits of GDP as an indicator of economic performance and social progress, to consider additional information required for the production of a more relevant picture, to discuss how to present this information in the most appropriate way, and to check the feasibility of measurement tools proposed by the Commission. Commission's work was not focused on France, nor on developed countries. The output of the Commission has been made public, providing a template for every interested country or group of countries.
23 The Commission15 was chaired by Professor Joseph E. Stiglitz, Columbia University. Professor Amartya Sen, Harvard University, was Chair Adviser. Professor Jean-Paul Fitoussi, Institut d'Etudes Politiques de Paris, President of the Observatoire Français des Conjonctures Economiques (OFCE), was Coordinator of the Commission. Members of the Commission are renowned experts from universities, governmental and intergovernmental organisations, in several countries (USA, France, United Kingdom, India). The Commission was so named Stiglitz-Sen-Fitoussì16.
Three working groups have been established: the first on Classical GDP issues chaired by Professor Enrico Giovannini, the second one on Sustainable Development and Environment chaired by Professor Geoffrey Heal by Columbia University and the last one on Quality of Life chaired by Professor Alan B. Krueger by Princeton University.
The Commission hold its first plenary meeting on 22 - 23 April 2008 in Paris. Its final report has been made public on 14 September 2009, so named the First Report of the Commission on the Measurement of Economic Performance and Social Progress
Together with all the working papers produced, an international publication from OECD have been issued in 2011 in order to recap the main results of these studies started in 2004 with the First World Forum and that have been carrying on at a global level until today. The reference of the publication is: OECD (2011), How's Life?: Measuring well-being.
At the end of the Second World Forum the European Commission, the Organisation for Economic Cooperation and Development, the Organisation of the Islamic Conference, the United Nations, the United Nations Development Programme and the World Bank agreed in signing the Instanbul Declaration encompassing the “commitment to measuring and fostering the progress of societies in all their dimensions”, the support of “initiatives at the country level” and the formation of “a shared view of societal well-being and its evolution over time” through the following points:
1. encourage communities to consider for themselves what “progress” means in the 21st century
15
[ http://www.stiglitz-sen-fitoussi.fr/en/index.htm] More information are available at this official website. 16
Components: Bina Agarwal University of Delhi, India; Kenneth Arrow University of Stanford, USA; Anthony B. Atkinson Nuffield College, United Kingdom; François Bourguignon Paris School of Economics, France; Jean-Philippe Cotis Insee, French national statistical institute, Paris, France; Angus Deaton University of Princeton, USA; Kemal Dervis United Nations Development Programme (UNDP), New York; Marc Fleurbaey Université Paris 5, France; Nancy Folbre University of Massachussets, USA; Jean Gadrey Université Lille, France; Enrico Giovannini OECD, Paris (now actually President of ISTAT); Roger Guesnerie Collège de France, Paris, France; Geoffrey Heal Columbia University, New York, USA; James Heckman University of Chicago, USA; Claude Henry Institut d‟Etudes Politiques de Paris, France/Columbia University, New York, USA; Daniel Kahneman Princeton University, USA; Alan B. Krueger Princeton University, USA; Justin Lin World Bank, Washington D.C.; Andrew J. Oswald University of Warwick, United Kingdom; Robert D. Putnam Harvard University, USA; Nick Stern London School of Economics, United Kingdom; Philippe Weil Institut d‟Etudes Politiques de Paris, France.
24 2. share best practices on the measurement of societal progress and increase the awareness of
the need to do so using sound and reliable methodologies
3. stimulate international debate, based on solid statistical data and indicators, on both global issues of societal progress and comparisons of such progress
4. produce a broader, shared, public understanding of changing conditions, while highlighting areas of significant change or inadequate knowledge
5. advocate appropriate investment in building statistical capacity, especially in developing countries, to improve the availability of data and indicators needed to guide development programs and report on progress toward international goals, such as the Millennium Development Goals
To respond to the mandate received from the Istanbul Forum the OECD proposed to launch a “Global Project on Measuring the Progress of Societies” (www.oecd.org/oecdworldforum). To achieve its goals, the Global Project carried out activities in the following areas:
A) Statistical research on the measurement of societal progress in all its dimensions
B) Design, develop and promote the use of innovative ICT tools to facilitate the transformation of statistics into knowledge
C) Establishment of a global network to foster the measurement and assessment of progress in every Country
The purpose of these workshops is to discuss new and better ways to measure progress and well-being. There is a long history of attempts to measure economic, social and environmental progress and the first part of this paper describes some of that history.
Spurred on by the success of the 2007 conference, the Beyond GDP partners continue to work on improving measures of progress, wealth and well-being.
The Beyond GDP conference, organised by the European Commission, European Parliament, Club of Rome, OECD, and WWF, brought together over 650 delegates from more than 50 countries to explore how to improve the measurement of progress, true wealth and the well-being of nations. It fully supported the momentum to go beyond GDP. European Commission President José Manuel Barroso, in his speech opening the conference, highlighted how GDP, since its birth in the 1930s, was rapidly adopted as the best recognised measure of economic performance in the world. He added that “GDP is an indicator of economic market activity. It was not intended to be an accurate measure of well-being. Even Simon Kuznets, . . . one of the main originators of GDP, said: 'the
25 welfare of a nation can scarcely be inferred from a measure of national income'”. President Barroso also noted that despite being an invaluable tool for economic policy, GDP is unfit to reflect many of today‟s challenges, such as climate change, public health and the environment.
"We cannot face the challenges of the future with the tools of the past", he said. According to President Barroso, we should aim for “the sort of breakthrough that we saw in the 1930s, a breakthrough that adapts GDP, or complements it with indicators that are better suited to our needs today, and the challenges we face today”. President Barroso concluded, "It's time to go beyond GDP”.
GDP - Gross Domestic Product - measures the monetary value of all goods and services that are produced within a nation during a given period and sold to consumers, government, investors or are exported.
In addition, part of the production used for own consumption is included - e.g. agricultural products used by the farmers themselves. However, products sold to other domestic producers for further processing are not included - i.e. GDP measures end-products only.
Being a monetary value measure, GDP therefore represents the part of the population's well-being that comes from consumption of goods and services sold on established markets - i.e. selling apples to a neighbour is in most cases not a part of GDP.
Otherwise being a monetary value measure, GDP does not cover goods and services that cannot or have not been put a value on by the statistical authorities - i.e. so-called non-market goods and services. Examples of these are household production, entrance-free beach visits, and wildlife viewing. In other words, it does not measure well-being that goes beyond GDP, including environmental and social aspects of economic activities.
Furthermore, GDP, as an overall measure of economic welfare, does not reveal inequality concerns - e.g. the consumption possibilities of the poor compared with those of the rich.
Finally, although investments contribute to GDP, they only concern the year the spending is made. For this reason, investments only to a limited extent account for the gains and losses in natural, economic and social assets - which are important aspects from a long-term sustainable development perspective.
Measures that go beyond GDP cover environmental and social aspects of well-being that have not been accounted for by the GDP measure. Examples of these alternative measures are: Enlarged GDP indicators start from GDP (or other figures from the System of National Accounts) but adjust for some of its shortcomings to deliver a more comprehensive overview of a country‟s wealth or well-being.
26 Environmental indicators cast light over the state and development of issues such as natural resources, environmental pollution and waste, as well as related issues such as human health. Well-being indicators are used to broadly illustrate people‟s general satisfaction with life, or give a more nuanced picture of quality of life in relation to their jobs, family life, health conditions, and standards of living.
The strength of measures such as enlarged GDP is that they often build on officially available data that is regularly updated. The weakness, on the other hand, is that there are limits to what is officially available and thus what can be included in the measure. As a contrast, subjective well-being measures have the strength that they directly address the well-well-being issue that is in focus. A weakness is that subjective opinions often depend on cultural factors and are thus difficult to compare. Another example is that composite indices have the strength of showing a complete picture, while a weakness is that the weighing of individual indicators often is criticized for not being "objective".
The role of measures that go beyond GDP in policy-making is at least twofold. On the one hand, they can be used by politicians to better monitor and evaluate progress in our society, taking into account environmental sustainability or social inclusion, which are not covered by GDP. On the other hand, these measures can be used to better communicate in a clear way that a given policy may target or affect many other elements of the society than economic activity.
Therefore, there is a demand by politicians to have both specific indicators that are relevant for a given policy and more aggregated composite indices that can be communicated to the general public in a few words .Looking into the results of the second Stiglitz commission working group, a great attention have been paid to the green accounting and the satellite accounts, like NAMEA that is the focal point from which this research started and one of the solution proposed and carried out by ARPA Emilia-Romagna and Emilia-Romagna Region to go beyond conventional economic indicators and to lead sustainability reports and assessments.
27 2. Environmental Accounting and Satellite Accounts like NAMEA
In 1994, the European Commission identified the main lines of action for the development of a Green National Accounting framework based on satellites to National Accounts17. Following the first EU Communication, in 1995 Eurostat started working on NAMEA accounts, regarding them as one of the satellite accounts with top priority at European and international level.
Since then, Eurostat, in collaboration with Member States‟ statistical offices and European Commission DG Environment‟s financial support, has developed and implemented different accounting modules that cover almost all types of accounts, introduced in SEEA 200318, and that are drawn in the European Strategy on Environmental Accounting, 2003.
The SEEA 2003 describes four main types of environmental accounts: 1. Physical flow accounts including hybrid (NAMEA) accounts
2. Economic information on the environment (economic activities and products related to the environment and other environmentally related transactions) SERIEE19
3. Material Flow Accounts20
4. Valuation of non-market flows and environmentally adjusted aggregates (e.g. adjusted for defensive expenditures)
NAMEA statistical structure derives from official and standardized systems (SNA 199321, SEEA 200322, ESA 199523).
17
UE-COM (94) 670 18
The Handbook of National Accounting: Integrated Environmental and Economic Accounting 2003, referred to as SEEA 2003, is a satellite system of the System of National Accounts. It brings together economic and environmental information in a common framework to measure the contribution of the environment to the economy and the impact of the economy on the environment. It provides policy-makers with indicators and descriptive statistics to monitor these interactions as well as a database for strategic planning and policy analysis to identify more sustainable paths of development (United Nations, European Commission, International Monetary Fund, OECD, World Bank, 2003).
19 Système Européen de Rassemblement de l‟Information Économique sur l‟Environnement. It is a European environmental accounting system, developed by Eurostat in „90s, consisting mainly of data on environmental protection expenditure and economic data on the management of natural resources. It follows the Monetary approach to environmental accounting.
20 A European environmental accounting system elaborated by Eurostat in „90s that provides an aggregate overview of annual material inputs and outputs of an economy in tonnes. It follows the Physical approach to Environmental Accounting.
21
The System of National Accounts (SNA) consists of a coherent, consistent and integrated set of economic accounts, balance sheets and tables based on a set of internationally agreed concepts, definitions, classifications and accounting rules. Together, these principles provide a comprehensive accounting framework within which economic data can be compiled and presented in a format that is designed for purposes of economic analysis, decision-taking and policy-making. The 1993 SNA was prepared under the joint responsibility of the United Nations, the International Monetary Fund, the Commission of the European Communities, the OECD and the World Bank (UN, 1993).
28 In the context of revising the European Strategy on Environmental Accounting in 2008, Eurostat commissioned a study in 2006 to assess the progress made by European countries in the compilation of Environmental Accounts in order to facilitate the strategic planning for the further development of Environmental Accounts in Europe towards 2010 and beyond. It should be noted that Germany, Italy, Austria, Finland, Sweden and United Kingdom are involved in further areas of environmental accounting such as Accounts for Environmental Taxes. In the Renewed European Strategy on Environmental Accounting (2008) it is recommended that the development in the medium term (2-3 years) should include: data collection for the areas of NAMEA energy and NAMEA waste accounts, and environmentally related transactions according to standard industry NACE24 groups (e.g. environmental taxes and subsidies).
In 2007 Eurostat released a revised version of its „Air – emissions compilation guide‟ and, in 2008, promoted a survey to understand to what extent the NAMEA matrices are developed in Member States.
NAMEA methodology goes back to the analysis of physical economy by Leontief (1970), who combined input-output modelling with environmental accounts. NAMEA is classifiable as a hybrid accounts system. According to SEEA, the term „hybrid flow accounts‟ is used to denote a single accounting framework combining national accounts in monetary terms and physical flow accounts. By means of a system of satellite accounts the environmental accounting systems like NAMEA, Material Flow Accounts and SERIEE have been implemented at international levels to measure Sustainable Development25. In November 2008 (CPS 2008/68/7/EN), following August 2009 (COM(2009) 433) and in 2010 (COM(2010)132 final) together with UE691/11 the European Commission strengthened again the importance of developing NAMEA matrixes for all UE Member States, providing specific deadlines. Physical and monetary aggregates stemming from environmental accounting can therefore be used in helping economic analysis in a sustainable 22
The Handbook of National Accounting: Integrated Environmental and Economic Accounting 2003, referred to as SEEA 2003, is a satellite system of the System of National Accounts. It brings together economic and environmental information in a common framework to measure the contribution of the environment to the economy and the impact of the economy on the environment. It provides policy-makers with indicators and descriptive statistics to monitor these interactions as well as a database for strategic planning and policy analysis to identify more sustainable paths of development (United Nations, European Commission, International Monetary Fund, OECD, World Bank, 2003).
23
The European System of National and Regional Accounts (1995 ESA) is an internationally compatible accounting framework for a systematic and detailed description of a total economy (that is a region, country or group of countries), its components and its relations with other total economies.
24
French acronym for statistical classification of economic activities in the European Community:
Nomenclature statistique des activités économiques dans la Communauté européenn.
25
De Haan, M., Keuning, S., J. (2004). Accounting for sustainable development: the Namea-based approach in Measuring Sustainable Development integrated economic, environmental and social frameworks: OECD.
29 perspective, as well as facilitating the building of measures of sustainable development based on an integrated view of the economy and the environment. In November 2008 the Revised “European Strategy for Environmental Accounting” stated: „..The Task Force recommends that the priority for environmental accounts will focus primarily on physical and monetary flows including hybrid (NAMEA) accounts, economic information on the environment (economic activities and products related to the environment and other environmentally related transactions such as taxes and subsidies). ..‟ (Eurostat, 2008a, pag. 11).
The first European Strategy on Environmental Accounting edition incorporates estimates of Environmental Taxes by branches of activity as a priority for implementation, and which will continue to be regarded thus in their 2008 review. Eurostat requested, for the first time during 2006, information from member countries, on the basis of a questionnaire designed to be integrated with a NAMEA-type framework.
In this framework, carried out jointly in 1997 by Eurostat, the European Commission, the OECD and the International Energy Agency (IEA), environmental taxes are defined, such as „those whose taxable base consists of a physical unit (or similar) of material with a negative, checked and specific impact on the environment‟.
The Revised European Strategy for Environmental Accounting (Eurostat, 2008a) will help to ensure the availability of important environmental accounts data from all European countries and will enable these data to be harmonised, timely and of adequate quality, in order to facilitate their use in developing and informing policy. In addition, the strategy will also encourage the further development of environmental economic accounts as a statistical area.
The Strategy focuses on environmental-economic accounting that helps to bring together statistics in coherent frameworks or accounts that allow disparate datasets to be coordinated in such a way that cross-cutting analyses can be made with confidence.
As it is known in June 2006, the European Council called on the Union and its Member States to extend the national accounts to key aspects of sustainable development. National accounts should therefore be supplemented with integrated environmental economic accounts providing data that are fully consistent. It states that it is of great importance that, as soon as the system is fully operational, European environmental economic accounts be actively and accurately used in all Member States and in all relevant Union policy making . Satellite accounts allow the analytical capacity of national accounting to be expanded for selected areas of social concern, such as pressures on the environment stemming from human activities. The SEEA brings together economic and environmental information in a common framework to measure the contribution of the environment