Atrial Natriuretic Peptide Is Not Degraded by the
Lungs in Humans
GIORGIO IERVASI, ALDO CLERICO, ALESSANDRO PILO, LAURA SABATINO, CRISTINA MANFREDI, FRANCESCA FORINI, MARIA GRAZIA DEL CHICCA,
CATALDO PALMIERI, MARCELLO RAVANI, AND LUIGI DONATO
Laboratory of Cardiovascular Endocrinology, Consiglio Nazionale delle Ricerche Institute of Clinical Physiology, Pisa, Italy
ABSTRACT
In an attempt to identify and quantify the sites of atrial natriuretic peptide (ANP) degradation, particularly the lungs, a new tracer method to study ANP metabolism in vivo in humans was developed and applied to patients with left ventricular dysfunction. Thirteen male, normotensive, cardiac patients with different degrees of left ventricular myocardial involvement were enrolled in the study. The study protocol required constant infusion (3 patients) or bolus injec-tion (10 patients) of 125I-labeled ANP just upstream of the right
atrium and blood sampling from different sites (pulmonary artery, aorta, inferior vena cava, and femoral vein) during the hemodynamic study. Data analysis was based on a kinetic model consisting of three blocks in series (right heart, lungs and left heart, and periphery) supplied by the same plasma flow (plasma cardiac output). Plasma levels of native ANP were measured with a sensitive and specific immunoradiometric assay method. ANP values measured in the aorta (163.96 144.8 pg/mL, n 5 80) were superimposable on those
mea-sured in the pulmonary artery (161.86 136.5 pg/mL, n 5 80). Neg-ligible extraction of125I-labeled ANP was found in the lungs and left
heart block (on average 0.086 3.92%), whereas the peripheral block extraction (46.26 7.8%) accounted for almost total hormone removal from the blood (whole body extraction was 46.46 6.6%). ANP met-abolic clearance rate (3.116 1.48, range 1.4–6.8 L/min) declined with the progression of left ventricular dysfunction (plasma cardiac output 3.466 1.08, range 1.2–5.7 L/min), and a close correlation between metabolic clearance rate and cardiac output was evident. Our data suggest that lungs do not extract, or extract only very small amounts, of labeled ANP administered iv to patients with different degrees of left ventricular myocardial involvement, and whole body extraction of labeled ANP remains relatively stable with the progression of disease, and the large reductions in clearance values observed in our patients can be ascribed mainly to the reductions in cardiac output. (J Clin
Endocrinol Metab 83: 2898 –2906, 1998)
H
UMAN atrial natriuretic peptide (ANP) is a 28-amino acid polypeptide with potent natriuretic and vasodi-latatory effects, which is produced mainly by cardiomyo-cytes (1). ANP levels have been found to be elevated in diseases characterized by an expanded fluid volume, includ-ing cardiac and renal insufficiency. In particular, circulatinclud-ing ANP increases with the progression of clinical severity of cardiac insufficiency and with the deterioration of hemody-namics, so that a positive relation between mortality and ANP levels was found in severe heart failure (2, 3).Extensive studies in both animals and humans have doc-umented that the main pathway of ANP secretion into the circulatory blood flow is through the coronary sinus into the right atrium (1). However, the contribution of individual organs to ANP clearance in vivo in humans has not yet been defined. In particular, although the lungs have been impli-cated as a site of ANP degradation, it has not been well demonstrated whether circulating ANP is extracted and de-graded (or not) by the lungs. The studies aimed at identifying and quantitating sites of ANP degradation (4 –12) were based on the measurement of the arteriovenous (AV) difference of the hormone concentration, in most cases derived from the collection of a small number of plasma samples with ANP
concentration assessed by RIA. All of the studies reported values of circulating ANP in the aorta superimposable to those measured in the pulmonary artery (4, 6 –12). Although Schutten et al. (6) concluded that ANP extraction does not occur across the lungs, others (4, 7–12) suggested that there may be partial extraction of ANP, the circulating levels in aorta being restored by the hormone newly secreted into the blood from the left heart. Clearly, the approach based on sampling upstream and downstream of district(s) (i.e. the pulmonary artery and aorta), in which production of the hormone may occur, as it has been hypothesized for left heart, is not suitable for evaluating the ANP extraction. To avoid the possible contribution to ANP production of left heart and to overcome the technical difficulties related to pulmonary veins sampling, some authors sampled pulmo-nary wedge blood; additional concerns, however, can be raised when computation of ANP removal by the lungs was based on AV difference in which the pulmonary wedge blood was used as an indirect estimate of ANP levels in pulmonary venous blood (7, 8).
Even if ANP secretion between the sampling sites can be excluded, estimation of the hormone extraction from AV difference measured in a few pairs of simultaneously col-lected blood samples can be considered reliable only when production rate remains fairly constant. In the case of ANP, the pulsatile secretion and the very rapid clearance (13–15) may generate oscillations in its plasma levels, mainly in the proximity of the secretion site (i.e. pulmonary artery), thus Received October 8, 1997. Revision received February 26, 1998.
Ac-cepted May 12, 1998.
Address all correspondence and requests for reprints to: Giorgio Iervasi, Consiglio Nazionale delle Ricerche Institute of Clinical Physi-ology, Via Savi 8, 56100 Pisa, Italy. E-mail:[email protected].
Copyright © 1998 by The Endocrine Society
making an estimate of the extraction unreliable unless quite a long sampling schedule is adopted. Finally, the relatively poor accuracy and precision of native ANP measurement by RIA methods generally employed to measure the hormone (16, 17) may partially contribute to generate inaccurate val-ues of hormone extractions.
All these drawbacks can be overcome by a tracer study in which labeled ANP is administered. Two different experi-mental protocols have been used by us. The first based on constant infusion of radiolabeled ANP into the right atrium followed by simultaneous blood collection from pulmonary artery, aorta, inferior vena cava, and femoral vein. The sec-ond using a bolus injection of tracer into the right atrium with blood sampling from two sites only (pulmonary artery and aorta). Data collected according to both protocols were an-alyzed using a circulatory model, which allows us to take account of the cardiac output simultaneously measured by thermodilution (18, 19). We report here the extraction of labeled ANP from lungs, heart, peripheral tissues, and whole body in 13 patients with different degrees of left ventricular myocardial involvement. The relationship between whole body extraction of the hormone, metabolic clearance rate (MCR), and the hemodynamic state is also discussed.
Subjects and Methods Experimental subjects
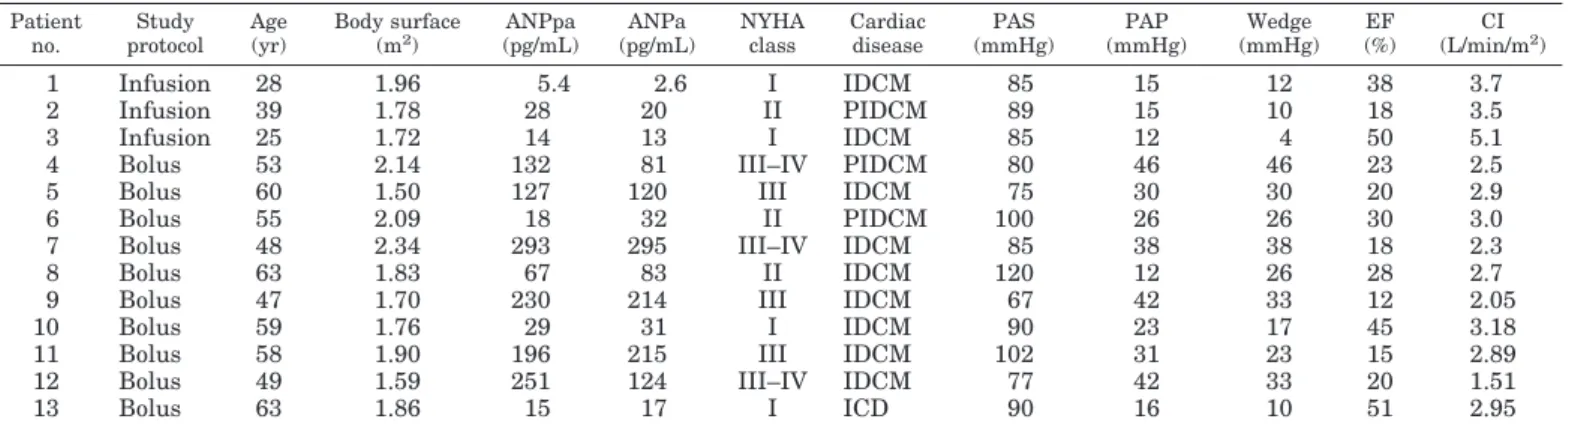
Thirteen male, normotensive, hospitalized patients with different degrees of left ventricular dysfunction were enrolled in the study after a complete baseline cardiological evaluation, including physical and X-ray examination, two-dimensional echocardiography, and radionu-clide-angiography. All the patients had to submit to a complete hemo-dynamic study because of their cardiac disease. Their main clinical parameters are reported in Table 1. Because it is very difficult to apply this experimental protocol to normal subjects for evident ethical reasons, we studied patients with a wide range of myocardial involvement (from very mild to severe, i.e. from 51–12% left ventricular ejection fraction), clinical symptoms (New York Heart Association functional class from I to III-IV), and plasma ANP levels (i.e. from values in the normal range of 5–28 pg/mL to greatly increased values of.200 pg/mL; Table 1).
Because it is well known that several drugs can affect ANP metab-olism (1), we decided to stop all the drugs at least 3 days before the kinetic study. Therefore, patients with overt congestive heart failure, who could not stop the drugs for ethical reasons, and patients treated with drugs with a relatively long half-life (such as digitalis drugs) were
not included in the study. We also excluded patients with atrial fibril-lation or other arrhythmias, which could affect the secretion and me-tabolism of ANP (1).
All the patients received a daily dose of 20 drops of saturated Lugol solution from the day before until the day after the kinetic study.
The study protocol was approved by the local ethics committee and written consent was obtained from the patients before the study. Hemodynamics
The study was carried out in the hemodynamic ward of our institute after selective left and right coronary angiograms were performed using the Judkins technique. A no. 7 French triple lumen flow-directed balloon-tipped catheter was inserted transcutaneously through the right femoral vein and advanced to obtain right atrial, pulmonary artery, and pulmonary capillary wedge pressures. Cardiac index was calculated as the ratio of the mean of at least five thermodilution cardiac output measurements to body surface area (m2). After hemodynamic
assess-ment, the flow-directed catheter was removed, and a no. 7 French mul-tipurpose multiple side hole catheter was positioned in the pulmonary artery. A no. 5 French pigtail multiple side hole catheter was advanced into the ascending aorta through an introducer positioned in the right femoral artery for diagnostic study. Pulmonary artery pressure, aortic pressure, and one electrocardiographic lead were continuously moni-tored. Blood samples were simultaneously drawn from the pulmonary artery and ascending aorta. In the studies with labeled ANP infusion (patients 1, 2, and 3; Table 1) a third catheter was positioned in the inferior vena cava, 2–3 cm upstream from its entrance into the right atrium and downstream from the entrance of the superior hepatic veins into the vena cava. At the end of the experimental study, the diagnostic procedure was completed with biplane left ventriculograms.
Experimental protocol
Syntheticah1–28ANP was iodinated with Na125I or Na131I as
previ-ously described in detail elsewhere (14, 20). A drop of the injected tracer that remained in the syringe after the injection was collected and tested for purity by high performance liquid chromatography; in all kinetic studies, less than 1% impurity was found.
Studies using constant infusion of tracer. In three patients (patients 1, 2, and
3; Table 1) a known amount of the tracer (;80mCi) was drawn into a syringe containing 50 mL Emagel solution (Hoechst, Frankfurt am Main, Germany) and constantly infused at a rate of 0.4 mL/min, by means of a mechanical high-precision pump via a catheter inserted percutane-ously from the antecubital vein to near the junction of the superior vena cava with the right atrium; after equilibration (20 –30 min) four to five blood samples (4 –5 mL) were simultaneously drawn from the aorta, pulmonary artery, inferior vena cava, and femoral vein.
TABLE 1. Main clinical data of patients studied Patient no. Study protocol Age (yr) Body surface (m2 ) ANPpa (pg/mL) ANPa (pg/mL) NYHA class Cardiac disease PAS (mmHg) PAP (mmHg) Wedge (mmHg) EF (%) CI (L/min/m2 ) 1 Infusion 28 1.96 5.4 2.6 I IDCM 85 15 12 38 3.7 2 Infusion 39 1.78 28 20 II PIDCM 89 15 10 18 3.5 3 Infusion 25 1.72 14 13 I IDCM 85 12 4 50 5.1
4 Bolus 53 2.14 132 81 III–IV PIDCM 80 46 46 23 2.5
5 Bolus 60 1.50 127 120 III IDCM 75 30 30 20 2.9
6 Bolus 55 2.09 18 32 II PIDCM 100 26 26 30 3.0
7 Bolus 48 2.34 293 295 III–IV IDCM 85 38 38 18 2.3
8 Bolus 63 1.83 67 83 II IDCM 120 12 26 28 2.7
9 Bolus 47 1.70 230 214 III IDCM 67 42 33 12 2.05
10 Bolus 59 1.76 29 31 I IDCM 90 23 17 45 3.18
11 Bolus 58 1.90 196 215 III IDCM 102 31 23 15 2.89
12 Bolus 49 1.59 251 124 III–IV IDCM 77 42 33 20 1.51
13 Bolus 63 1.86 15 17 I ICD 90 16 10 51 2.95
Abbreviations: ANPa, ANP concentration in aorta before tracer administration (basal condition); ANPpa, ANP concentration in pulmonary artery before tracer administration (basal condition); ICD, ischemic coronary disease; PIDCM, postischemic dilated cardiomyopathy; IDCM, idiopathic dilated cardiomyopathy; PAS, mean systemic arterial pressure; PAP, mean arterial pulmonary pressure; EF, ejection fraction; CI, cardiac index.
Bolus injection studies. In 10 patients (patients 4 –13; Table 1) a known
amount (;80mCi) of freshly prepared tracer was iv bolus injected through a catheter (see above) into the right atrium; several blood samples were then simultaneously collected from the aorta as well as the pulmonary artery before and during the 30 min following injec-tion. To ensure a reliable definition of the area under the concentra-tion curve (AUC) of the tracer throughout the first 2 min after in-jection, integrated blood samples were continuously withdrawn using a computerized and programmable automatic collector, spe-cifically developed for this purpose by the Electronics Unit of our Institute. The device consists of: a) a peristaltic pump; b) a micro-controller that operates two drivers for piloting two stepping motors; c) an electronic apparatus for piloting an electromagnet to change the row of tubes; d) an operating panel with a display to program and visualize the work-cycle; and e) an electronic apparatus with emer-gency push-button to stop the work-cycle, if necessary. Thirteen 10-sec integrated blood samples (1.2 mL each) were simultaneously collected from the aorta and pulmonary artery throughout the first 130 sec; the remaining part of the curve (from 130 sec up to 30 min) was described by at least five discrete 5-mL blood samples, typically taken at 3.5, 8, 15, 20, and 30 min. The larger volume of the five discrete samples was necessary to also allow a reliable measure of ANP concentration during the final part of the curve where the ANP activity is extremely low.
A volume of 0.9% NaCl solution, equal to that of blood withdrawn, was infused. The blood samples collected were immediately put into ice-chilled disposable polypropylene tubes, containing aprotinin (500 kallikrein inhibiting units (KIU)/mL of plasma) and EDTA (1 mg/mL of plasma), and the plasma was rapidly separated in a refrigerated centrifuge at 4 C. All experimental blood samples were extracted with Bond Elut C18 cartridges (Analytical International, Harbor City, CA) and then purified by means of an high performance liquid chromatog-raphy procedure as previously described in detail (14, 20).
Computation of125I-labeled ANP blood/plasma
partition factor
Because labeled ANP concentration was measured in plasma, directly measured blood flow (cardiac output) was corrected for the ANP blood/ plasma ratio. The partition of known amounts of labeled ANP in 3 mL of blood (withdrawn immediately before the tracer injection/infusion) between plasma and cells (red cells, white cells, platelets, etc.) was measured for each patient after the common procedures of centrifuga-tion and separacentrifuga-tion utilized during the kinetic study for all plasma samples; on average this factor was 63.06 5.3%.
ANP assay
Plasma ANP was measured with a direct immunoradiometric assay (IRMA), as previously described in detail (21). The sensitivity of this IRMA was 0.216 0.09 pg/tube (corresponding to 2.1 6 0.9 pg/mL for an assay plasma volume of 0.1 mL). The interassay imprecision was 11.4% and 8.0% for two plasma pools with ANP concentrations of 22.66 2.6 pg/mL and 178.66 14.3 pg/mL, respectively, whereas the intraassay imprecision profile ranged from 8 – 4% for the same concentration in-terval. To improve the assay precision, plasma samples with ANP levels less than 15 pg/mL were repeatedly assayed using a higher volume of plasma (0.3 mL instead of 0.1 mL) (21).
For basal ANP assay (Table 1), just before injection of the tracer blood samples were collected from the aorta and pulmonary artery. We also collected 80 blood samples (on average 6 for each patient) from the aorta or pulmonary artery during the kinetic study, which contained no more than 2% dose/liter of injected125I-labeled ANP.
All blood samples were collected in ice-chilled disposable polypro-pylene tubes, containing aprotinin (500 KIU/mL of plasma) and EDTA (1 mg/mL of plasma); plasma samples were immediately separated by centrifugation, and then frozen and stored in various aliquots at220 C, and finally assayed with the IRMA (20).
The normal range for plasma ANP obtained in 70 healthy adults of both sexes (age 20 –70 yr) was 17.26 8.4 pg/mL (range 3–34 pg/mL).
Data analysis
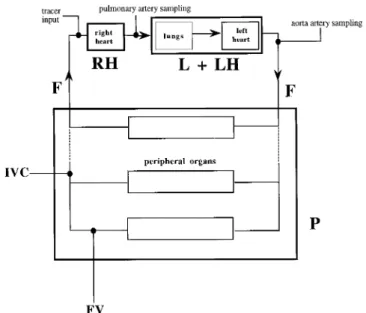
The body ANP system is represented by a circulatory model com-posed of three blocks [right heart (RH), lungs and left heart (L1 LH), and periphery (P)] connected in series (see Fig. 1). The associated flow F is cardiac output corrected for the ratio of blood to plasma ANP concentrations (F is referred to as plasma cardiac output in this article). From the point of view of hormone turnover, each block of the model is characterized by its extraction (Erh, El1lh, Ep).
Extractions of individual blocks: infusion approach. This analysis is an
ex-tension of the analysis previously used (18) for studies performed with a simplified experimental protocol (just one blood sampling site). The extractions of the three blocks are computed by the standard formula [E5 (cinput2 coutput)/cinput] applied to the steady state concentrations
(Fig. 2) of tracer experimentally measured in pulmonary artery (cpulm),
aorta (caorta), and inferior vena cava (cven):
Erh5@~cven1 IR/F! 2 cpulm#/~cven1 IR/F! (1)
El1lh5~cpulm2 caorta!/cpulm (2)
Ep5~caorta2 cven!/caorta (3)
The output concentration from the periphery cvenis estimated by the
concentration in the inferior vena cava; the input concentration to right heart is cven1IR/F where IR/F is the concentration increment produced
by infusion rate IR diluted in flow F.
Extractions of individual blocks: bolus approach. The experimental data are,
in this case, the two concentration curves sampled in the pulmonary artery and aorta (Fig. 3). The extractions are computed starting from the areas under the two curves AUCpulmand AUCaorta. Because of frequent
and integrated sampling during the first minutes, it was possible to split the pulmonary curve into the curve generated by first pass of bolus and the recirculating curve generated by the labeled ANP, which returns to the pulmonary artery after passing through peripheral organs. The onset of recirculation in the pulmonary artery could be detected as a change in the descending slope of the initial peak evident when data are plotted in log scale. The area relative to the first pass (AUCpulm,1p) is computed
by adding to the area of the initial peak the area of the tail computed by monoexponential extrapolation of the descending branch of the peak
FIG. 1. Body ANP system schematically represented as three blocks (RH, right heart; L1 LH, lungs and left heart; P, periphery) connected in series in a circular fashion. The same flow F circulates through blocks; F (plasma cardiac output) is cardiac output corrected by blood/ plasma concentration ratio. Site of tracer administration, sites of sampling used in infusion protocol [pulmonary artery, aorta, inferior vena cava (IVC), and femoral vein (FV)], and sites of sampling used in bolus injection protocol (pulmonary artery and aorta) are indicated.
(Fig. 3). The area under the recirculating curve is calculated as difference AUCpulm, rc5 (AUCpulm2 AUCpulm,1p).
The product of AUCpulm,1ptimes flow F is the total amount of labeled
ANP that reaches the pulmonary artery; by comparing this amount to the injected dose D, extraction of RH block is computed:
Erh5~D 2 F AUCpulm,1p!/D (4)
Extraction of the L1LH block is computed as:
El1lh5~AUCpulm2 AUCaorta!/AUCpulm (5)
Extraction of the P block is computed as:
Ep5~AUCaorta2 AUCpulm, rc!/AUCaorta (6)
Note the strict analogy of Eq 5 and Eq 6 with Eq 2 and Eq 3 where AUCs replace the steady state concentrations of tracer; to write Eq 6 in a simpler way, it was assumed Erh5 0, in agreement with results of
present studies in which no significant extraction of labeled ANP by the right heart has been observed (see Results).
MCR and whole body extraction: infusion approach. Overall degradation rate
of the metabolic system is, as is usual, quantitated in terms of clearance rate MCR, computed as the ratio of infusion rate IR to steady state concentration in mixed venous plasma:
MCR5 IR/cven (7)
The availability of simultaneously measured cardiac output makes it possible to write the MCR in terms of flow and whole body extraction by the use of the circulatory model. The whole body is considered as a perfused organ whose extraction is:
Ewb5~cpulm2 cven!/cpulm (8)
For sake of simplicity it is assumed Erh5 0 i.e. cpulm5 cven1 IR/F,
in agreement with the results of the present studies (see Results). The relationship between MCR and Ewbis obtained by stating that, under
steady state conditions, the amount of labeled ANP degraded must be equal to the amount infused:
IR5~cpulm2 cven!F (9)
Dividing both sites of Eq 9 by cvenwe obtain:
IR cven5 ~cpulm2 cven! cven F5~cpulm2 cven! cpulm cpulm cven F which can be written as:
MCR5 FEwb/~1 2 Ewb! (10) MCR and whole body extraction: bolus approach. MCR is computed, as is
usual, from the ratio of injected dose D to the AUC in mixed venous plasma. In our study this curve is the recirculating curve sampled in the pulmonary artery, therefore:
MCR5 D/AUCpulm, rc (11)
Using the experimental data produced by the bolus approach Ewbis
defined by an equation analogous to Eq 8:
Ewb5~AUCpulm2 AUCpulm, rc!/AUCpulm (12) FIG. 2. Steady state plasma levels of
125I-labeled ANP reached in pulmonary
artery, aorta, inferior vena cava, and femoral vein after constant infusion of tracer (patient no. 3 in Table 2). Steady state plasma concentrations are nor-malized by infusion rate IR, i.e. ex-pressed as: (% dose infused in 1 min)/ liter; therefore MCR (in liter/min) is calculated as 100/(normalized steady state concentration).
For the sake of simplicity, it is assumed Erh5 0, that is D 5 AUCpulm,1p
F; starting from the relation AUCpulm,1p5 AUCpulm2 AUCpulm, rcand
multiplying both sides by F, we have:
D5~AUCpulm2 AUCpulm, rc!F (13)
Eq 13 is analogous to Eq 9 and states the balance between the injected dose and the amount degraded. Dividing by AUCpulm, rcwe obtain:
D/AUCpulm, rc5~AUCpulm2 AUCpulm, rc!F/AUCpulm, rc (14)
Eq 14, bearing in mind Eq 11, Eq 12, and the relationship AUCpulm, rc/AUCpulm5 (1 2 Ewb), can be written in the form of Eq 10.
In conclusion, MCR, either obtained from the infusion approach (Eq 7) or from the bolus approach (Eq 11), is equal to the product of plasma cardiac output F times a coefficient [Ewb/(12 Ewb)], which depends on
the whole body extraction. Note also that, by solving for Ewb, Eq 10 can
be rewritten in the form:
Ewb5 MCR/~F 1 MCR! (15)
this last equation allows Ewbto be calculated from MCR if an estimate
of F is available. Statistical analysis
The unpaired t test was used for the comparisons between the two groups of patients; the nonparametric test, Mann-Whitney U test was
used when the variances of the two tested groups were statistically different by F test. The results are expressed as mean 6 sd if not otherwise stated.
Results
Native ANP levels in pulmonary artery and aorta
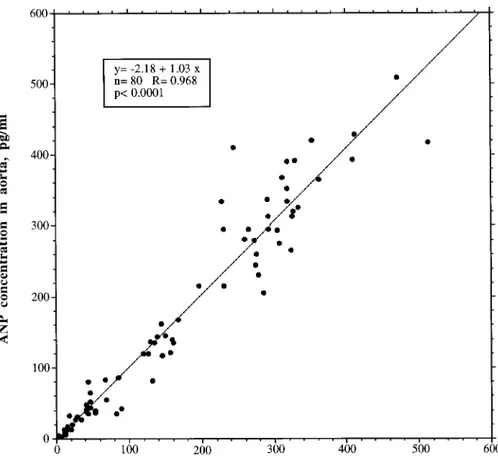
The ANP values measured by IRMA in the aorta (163.96 144.8 pg/mL, n5 80) were, on average, superimposable on those measured in the pulmonary artery (161.86 136.5 pg/ mL, n5 80). A very close linear regression (R 5 0.968, y 5 22.18 1 1.03 x), not different from the identity line, was found between all the values of native ANP plasma concen-trations simultaneously determined before and during the kinetic study in the pulmonary artery and in the aorta from all patients (Fig. 4). These data support the idea of no deg-radation in the lungs and left heart. However, if one takes into account the ratio of pairs of samples simultaneously drawn from the aorta and the pulmonary artery in each patient, an extraction value ranging between157 and 279% (negative values are generated when the concentration in the pulmonary artery is lower than that in the aorta) was found. These findings indicate that computation of extraction based
FIG. 3. Concentration curves of 125
I-labeled ANP sampled in pulmonary artery and aorta after bolus adminis-tration of tracer in right atrium; con-centrations are in percent dose per liter and time is seconds after injection. Sharp initial peak produced by first pass of tracer (dotted line) is evident, followed by a slower curve caused by tracer that recycles. A similar pattern can also be seen in the aortic curve, with some spreading and a 10- to 20-sec de-lay compared with pulmonary curve. Note that sampling throughout first 130 sec after injection was performed by continuous withdrawal of blood through a catheter connected to a pump and an automatic collector. Concentra-tion of each of these 13 integrated sam-ples is average concentration in plasma during respective 10-sec interval. In ad-dition to experimental points, tail of first-pass curve (computed by monoex-ponential extrapolation of steepest de-scent of peak of pulmonary curve) and recirculating curve (computed as differ-ence between whole pulmonary curve and first-pass curve) are also shown. Note that all curves are delayed for ap-proximately 30 sec because of the cath-eter used for sampling, as indicated by three samples free of radioactivity in pulmonary artery; delay, however, does not affect computations of kinetic pa-rameters based on AUCs.
on the individual pairs of values is unreliable, probably be-cause of pulsatory secretion that produces fluctuations in ANP levels particularly evident in the proximity of the se-cretion site.
Infusion studies
A typical set of experimental data obtained after equili-bration of infused tracer is reported in Fig. 2. 125I-Labeled
ANP plasma concentrations, measured in the pulmonary artery, aorta, inferior vena cava, and femoral vein in the three studies (i.e. patients 1, 2, and 3) are reported in Table 2. That steady state for tracer was reached was confirmed by near constant levels of 125I-labeled ANP found throughout the
sampling period (20 –25 min) (Fig. 2). In all three cases no differences between125I-labeled ANP concentrations in the
pulmonary artery and in the aorta were detected, whereas markedly lower levels were observed in the inferior vena
cava (on average 48% lower in respect to pulmonary and aortic arteries). Plasma 125I-labeled ANP was found to be
slightly higher in the femoral vein than the inferior vena cava (Table 2), thus suggesting different hormonal extraction in peripheral districts.
Extractions of the three blocks (and of whole body), cal-culated for all patients according to the equations of the model, are reported in Table 2. No (or negligible) extraction of the hormone was found to occur in the right heart and lungs and left heart blocks in all studies (mean extraction 0.37%), so that the peripheral block extraction (51.6%, on average) accounts for almost all the hormone removal from blood (whole body extraction, Ewb, on average 51.9%). Bolus injection studies
A typical time course of labeled ANP in pulmonary artery, in aorta, and in mixed venous plasma (recirculating curve in
FIG. 4. Linear regression found be-tween 80 values of native ANP plasma concentrations simultaneously sam-pled in pulmonary artery and in aorta, and measured with IRMA in all pa-tients.
TABLE 2. Infusion studies: mean steady state concentrations of labeled ANP normalized by the infusion rate (IR) and main kinetic parameters
Patient no. Pulmonary
artery (% IR/L) Aorta (% IR/L)
Inferior vena cava (% IR/L) Femoral vein (% IR/L) El1lh(%) Ep(%) Ewb(%) MCR (L/min) F (L/min) 1 50.2 49.6 26.8 29.3 1.2 46.0 45.2 3.73 4.52 2 45.6 45.9 20.4 31.5 20.5 55.5 56.1 4.90 3.84 3 31.5 31.4 14.7 18.8 0.4 53.2 54.4 6.80 5.70 Mean 42.4 42.3 20.6 26.5 0.37 51.6 51.9 5.14 4.69 SD 9.7 9.6 6.1 6.8 0.85 5.0 5.86 1.55 0.94
Abbreviations: El1lh, extraction of lungs and left heart block; Ep, periphery extraction; Ewb, whole body extraction; MCR, metabolic clearance
pulmonary artery) is shown in Fig. 3. Table 3 reports the AUCs in pulmonary artery (AUCpulm) and in aorta
(AUCaorta). In addition, Table 3 reports the area relative to the
first pass (AUCpulm,1p) and the area relative to recycling
(AUCpulm,rc) of the pulmonary curve. The product of
AUCpulm,1pfirst-pass radioactivity3 plasma cardiac output
F (see Table 3) allows computation of the amount of labeled material that passes through the pulmonary artery (see Data Analysis and Fig. 3); this figure corresponds to the fraction of the dose that is recovered in the pulmonary artery, and allows a direct measurement of extraction coefficient of the RH block. The recovery of the125I-labeled ANP radioactivity
in the pulmonary artery (i.e. the product of AUCpulm,1pand
F, see Table 3) was on average 99.56 4.3% of the dose injected into the right atrium, thus demonstrating both the validity of the continuous sampling protocol and the negligible 125
I-labeled ANP extraction from right heart. In addition, this experimental finding strongly supports the accuracy of the AUC relative to true mixed venous plasma, i.e. AUCpulm, rc
and therefore the accuracy of MCR values (see Data Analysis, Eq 11).
From the values of AUCpulmand AUCaortathe extraction
of the lungs and left heart block is computed; the virtually superimposable values for the two areas (on average 80.5 and 80.2% dose/liter min, respectively) indicate that extraction was undetectable (on average20.01%). On the other hand, the values of AUCpulm,rc(43.9% dose/liter min on average)
were found to be markedly lower than AUCaorta(on average
80.2% dose/liter min), indicating that a large extraction from the periphery does occur (on average 44.5%), and is nearly superimposable on whole body extraction (44.8%).
Relationships between ANP clearance, whole body extraction, and hemodynamic state
Individual values for MCR and whole body extractions of labeled ANP are reported in Table 2 (infusion studies) and Table 3 (bolus injection studies) together with plasma cardiac outputs. The relationship between MCR values (measured by both approaches) and the corresponding plasma cardiac outputs is represented in Fig. 5; a significant positive linear regression can be observed, suggesting that MCR is mark-edly affected by alterations in hemodynamics. MCR [3.116
1.48 L/min, coefficient of variation (CV) 5 47.7%] and plasma flow values F (3.466 1.08 L/min, CV 5 31.4%) varied among the 13 patients, both probably depending on the severity of cardiac disease. On the other hand, whole body extraction for all patients (46.4 6 6.6%) is a more stable parameter (CV5 14.2%) and does not correlate with plasma flow (R5 0.075), suggesting that whole body extraction is a kinetic parameter less (or not at all) affected by the hemo-dynamic conditions.
Discussion
The present data demonstrate that human lungs (and heart) do not extract labeled ANP; either it is continuously infused or bolus injected. Indeed, we found superimposable labeled ANP steady state concentration values in the pul-monary artery (input of lungs) and aorta (output of lungs) during constant infusion of tracer in the right atrium, and superimposable AUC values of labeled ANP in the aorta and in pulmonary artery after bolus injection of tracer, indicating that tracer that enters lungs through the pulmonary artery is completely recovered in the aorta. It is also evident from all the present studies that125I-labeled ANP is extracted in vivo
by peripheral organs, in agreement with previous data (1, 14, 20). This last observation gives further support to the hy-pothesis that labeled ANP shares similar biological activity with native hormone, as already reported by two studies demonstrating that labeled ANP is able to interact with spe-cific receptors and can be degraded by spespe-cific enzymes in a similar manner to the native hormone (1, 21). Therefore, our data strongly suggest that native ANP is also not extracted and degraded by lungs or by the heart in humans.
Previous studies, mainly based on the measurement of AV differences of native ANP, reported contrasting or inconclu-sive results of the role of the lungs and heart; lung extraction values ranging from 0 – 67% were found (4 –12). Also, our data on native ANP measurement generate extraction values ranging from -79 to157% if corresponding single pairs of samples simultaneously drawn from pulmonary artery and aorta are considered. On the other hand, our overall ANP values for pulmonary artery and aorta are, on average, su-perimposable, and are thus in agreement with similar data previously reported by others (4, 6 –12).
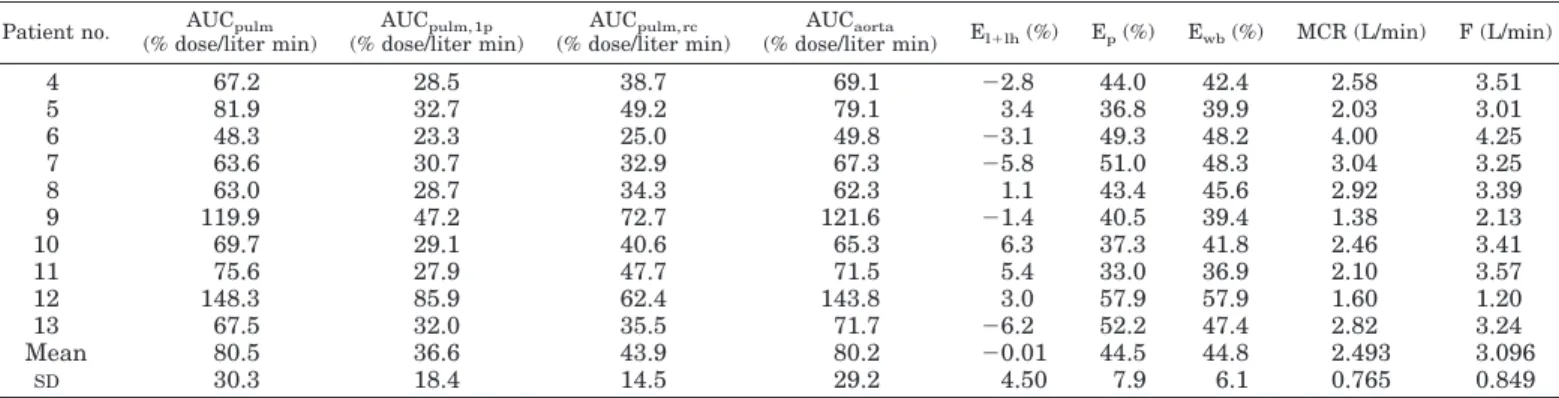
TABLE 3. Bolus injection studies: AUCs and main kinetic parameters Patient no. AUCpulm
(% dose/liter min) AUCpulm, 1p (% dose/liter min) AUCpulm, rc (% dose/liter min) AUCaorta
(% dose/liter min) El1lh(%) Ep(%) Ewb(%) MCR (L/min) F (L/min)
4 67.2 28.5 38.7 69.1 22.8 44.0 42.4 2.58 3.51 5 81.9 32.7 49.2 79.1 3.4 36.8 39.9 2.03 3.01 6 48.3 23.3 25.0 49.8 23.1 49.3 48.2 4.00 4.25 7 63.6 30.7 32.9 67.3 25.8 51.0 48.3 3.04 3.25 8 63.0 28.7 34.3 62.3 1.1 43.4 45.6 2.92 3.39 9 119.9 47.2 72.7 121.6 21.4 40.5 39.4 1.38 2.13 10 69.7 29.1 40.6 65.3 6.3 37.3 41.8 2.46 3.41 11 75.6 27.9 47.7 71.5 5.4 33.0 36.9 2.10 3.57 12 148.3 85.9 62.4 143.8 3.0 57.9 57.9 1.60 1.20 13 67.5 32.0 35.5 71.7 26.2 52.2 47.4 2.82 3.24 Mean 80.5 36.6 43.9 80.2 20.01 44.5 44.8 2.493 3.096 SD 30.3 18.4 14.5 29.2 4.50 7.9 6.1 0.765 0.849
Abbreviations: AUCpulm, area under whole pulmonary curve; AUCpulm, 1p, area under first pass pulmonary curve; AUCpulm, rc, area under
recirculating pulmonary curve; AUCaorta, area under aorta curve; El1lh, extraction of lungs and left heart block; Ep, peripheral extraction; Ewb,
These controversial findings could probably be explained by fluctuations of the hormone concentrations in plasma generated by the pulsatory secretion pattern, particularly in the proximity of the secretory site, which limits the value of measuring instantaneous AV differences. By assuming iden-tical behavior of labeled and native ANP, further support for this explanation is shown by the data in Fig. 3, reporting ANP plasma concentrations in the pulmonary artery, aorta, and periphery (recirculating curve) in response to a pulse ad-ministration of the hormone. It is evident that the ratio be-tween ANP concentrations in a single pair of samples taken simultaneously in the aorta and in pulmonary artery can oscillate widely (with pulmonary ANP values higher than aorta values up to 50 sec and vice versa thereafter) because of the delay (and spreading) of the hormone peak in aorta after passing through the circulation of lungs.
Another important piece of experimental evidence emerg-ing from data shown in Fig. 3 is that fluctuations observed at the peripheral level (recirculating curve) after a pulse of secretion into the right atrium are dampened out by periph-eral extraction and by diffusion through the lungs and pe-riphery. This last finding could help to explain why relatively stable concentrations of native ANP are observed in periph-eral venous plasma notwithstanding a wide direct experi-mental evidence of a pulsatile secretion pattern of the hor-mone (1).
Our results are in contrast with the hypothesis, put for-ward by other authors (7–12), that significant extraction of endogenous ANP does occur in the lungs, but that the levels in the aorta, superimposable on those found in the
pulmo-nary artery, are restored thanks to a direct secretion of the hormone through the endocardium of the left heart. The above hypothesis seems to be highly unlikely, because it implies the presence of a peculiar feedback mechanism be-tween the left heart and lungs by which the amount of hor-mone degraded in the lungs should be replaced by an iden-tical amount secreted immediately into circulation by the left heart.
Our studies provide estimates of ANP clearance in cardiac patients obtained either by tracer bolus injection or constant infusion. The large variability in MCR values (range 1.38 – 6.8 L/min) observed in our series of patients seems to be related to the degree of heart failure. Some limitations to both meth-odological approaches, however, have to be considered. As far as the bolus protocol is concerned, its validity is clearly dependent on the accuracy in estimating the first-pass area (AUCpulm,1p)and therefore the AUC in mixed venous plasma
(AUCpulm,rc). This depends on the estimation of the time of
onset of the recycle and on the extrapolation of the first-pass peak. Direct evidence that the experimental approach we adopted was suitable to accurately split AUCpulm into
AUCpulm,1pand AUCpulm,rcis given by the near 100%
recov-ery of total injected dose, computed as AUCpulm,1p times
plasma cardiac output, independently measured by ther-modilution. It should be emphasized that the contribution of the extrapolated portion of the area to the total AUCpulm,1p
is limited (i.e. no more than 10 –15% of the first-pass area), thus minimally affecting MCR values (in our studies no more than 8%).
In infusion studies, a possible underestimation of the true
FIG. 5. Significant positive linear re-gression found between MCR values and plasma cardiac output (F) observed in 13 patients studied.
mixed venous blood returning to the right heart could induce an overestimation of MCR values, when they are computed from125I-labeled ANP concentrations measured in the
infe-rior vena cava only. Indeed, a 27% higher ANP plasma con-centrations in superior vena cava has been reported (22). However, because the blood flow in superior vena cava is about one third to one fourth that in inferior vena cava, different weights of the ANP concentration make the extent of the underestimation not significant (22) (i.e.,7% in our cases). Actually, we found an MCR mean value in infusion studies approximately 2-fold higher than that estimated by the bolus protocol (5.14 L/min vs. 2.49 L/min). In our opin-ion, a more likely explanation could be related to the lesser degree of myocardial dysfunction in patients submitted to infusion protocol, as also demonstrated by corresponding higher values of plasma cardiac output in those patients (4.7 L/min vs. 3.0 L/min, respectively)
The present tracer experiments in which, in addition to MCR, cardiac output was also measured, for the first time allow evaluation of interesting pathophysiological informa-tion, i.e. the effects of hemodynamics on ANP metabolism in vivo in humans. Indeed metabolic clearance of ANP can be viewed as dependent on two factors (see Data Analysis, Eq 10): the whole body extraction, which represents an intrinsic characteristic of overall hormonal degrading systems oper-ating in the body, and the plasma cardiac output, which represents the contribution of hemodynamics. Our data demonstrate that ANP clearance values declined with the progression of left ventricular dysfunction because of de-creased plasma cardiac output (Fig. 5), whereas whole body extraction remained relatively constant and was not corre-lated to plasma flow. This suggests that the overall degra-dative systems for ANP are unaffected during the evolution of heart failure. Figure 5 also shows that clearance values are similar to plasma cardiac output values or, in other words, the slope of the regression line between clearance and flow values is close to 1. According to Eq 15 (see Data Analysis) it can then be predicted that, when clearance value is similar to plasma cardiac output, the whole body extraction is ap-proximately 50% as observed in our studies.
Because of the marked (on average 6-fold) increase in the circulating ANP in patients with different degrees of left ventricular dysfunction (ANP aortic levels in less severe disease, NYHA class I-II5 28.4 6 26.1 pg/mL; in more severe disease, NYHA class III-IV, ANP5 174.8 6 80.0 pg/mL, P 5 0.0043, Mann-Whitney U test), the amount of hormone de-graded significantly and progressively increased with the progression of disease despite the reduction of MCR prob-ably associated to the concomitant contraction in blood flow. These results are in good agreement with our previous data reporting a marked and progressive alteration of ANP deg-radation and distribution in patients with left ventricular involvement (15, 23).
In conclusion, our data show that lungs and heart blocks do not extract any or extract only negligible amounts of labeled ANP administered iv to patients with different
de-grees of left ventricular dysfunction, suggesting that human lungs are also unable to degrade significant amounts of en-dogenously produced ANP. Our findings also indicate that ANP is largely (;50%) extracted during a single pass across the peripheral tissues independent from the compromised hemodynamics throughout the evolution of cardiac failure.
References
1. Ruskoaho H. 1992 Atrial natriuretic peptide: synthesis, release, and metabo-lism. Pharmacol Rev. 44:479 – 602.
2. Packer M. 1992 The neurohormonal hypothesis: a theory to explain the mech-anisms of disease progression in heart failure. J Am Coll Cardiol. 20:248 –254. 3. Brandt RR, Scott Wright R, Redfield MM, Burnet JC. 1993 Atrial natriuretic
peptide in heart failure. J Am Coll Cardiol. 22[Suppl A]:86A–92A. 4. Sugawara A, Nakao K, Morii N, et al. 1985a-Human atrial natriuretic
polypeptide is released from the heart and circulates in the body. Biochem Biophys Res Commun. 129:439 – 446.
5. Rodeheffer RJ, Tanaka I, Hollister AS, Robertson D, Inagami T. 1986 Atrial pressure and secretion of atrial natriuretic factor into the human central cir-culation. J Am Coll Cardiol. 8:18 –26.
6. Schutten HJ, Henriken JH, Warberg J. 1987 Organ extraction of atrial natri-uretic peptide (ANP) in man. Significance of sampling site. Clin Physiol. 7:125–132.
7. Hollister AS, Rodeheffer RJ, White FJ, Potts JR, Imada T, Inagami T. 1989 Clearance of atrial natriuretic factor by lung, liver, and kidney in human subjects and the dog. J Clin Invest. 83:623– 628.
8. Obata K, Yasue H, Okumura K, et al. 1990 Atrial natriuretic polypeptide is removed by the lungs and released into the left atrium, as well as the right atrium, in humans. J Am Coll Cardiol. 15:1537–1543.
9. Akaike M, Ishikura F, Nagata S, Kimura K, Miyatake K. 1992 Direct secretion from left atrium and pulmonary extraction of human atrial natriuretic peptide. Am Heart J. 123:984 –989.
10. Northridge DB, Jamieson MP, MacArthur KJD, MacFarlane N, Dargie HJ. 1992 Pulmonary extraction and left atrial secretion of atrial natriuretic factor during cardiopulmonary bypass surgery. Am Heart J. 123:698 –703. 11. Sakamoto M, Nakao K, Mori N, et al. 1986 The lung as a possible target organ
for atrial natriuretic polypeptide secreted from the heart. Biochem Biophys Res Commun. 135:515–520.
12. Turrin M, Gillis CN. 1986 Removal of atrial peptide by perfused rabbit lungs in situ. Biochem Biophys Res Commun. 140:868 – 873.
13. Nugent AM, Onuoha GN, McEneaney DJ, et al. 1994 Variable patterns of atrial natriuretic peptide secretion in man. Eur J Clin Invest. 24:267–274. 14. Iervasi G, Clerico A, Berti S, et al. 1993 ANP kinetics in normal men: in vivo
measurement by a tracer method and correlation with sodium intake. Am J Physiol. 264:F480 –F489.
15. Iervasi G, Clerico A, Berti S, et al. 1995 Altered tissue degradation and distribution of atrial natriuretic peptide in patients with idiopathic dilated cardiomyopathy and its relationship with clinical severity of the disease and sodium handling. Circulation. 91:2018 –2027.
16. Clerico A, Del Chicca MG, Giganti M, Zucchelli GC, Piffanelli A. 1990 Evaluation and comparison of the analytical performances of two RIA kits for the assay of atrial natriuretic peptides (ANP). J Nucl Med Allied Sci.34:81– 87. 17. Clerico A, Opocher G, Pelizzola D, et al. 1991 Evaluation of the analytical performance of RIA methods for measurement of atrial natriuretic peptides (ANP): a multicentre study. J Clin Immunoassay. 14:251–256.
18. Iervasi G, Clerico A, Pilo A, et al. 1997 Evidence that ANP tissue extraction is not changed by large increases of its plasma levels induced by pacing in humans. J Clin Endocrinol Metab. 82:884 – 888.
19. Pilo A, Iervasi G, Clerico A, et al. 1998 Circulatory model in metabolic studies of rapidly renewed hormones: application to ANP kinetics. Am J Physiol. 274:E560 –E572.
20. Clerico A, Iervasi G, Manfredi C, et al. 1995 Preparation of mono-radio-iodinated tracers for studying the in vivo metabolism of atrial natriuretic peptide in humans. Eur J Nucl Med. 22:997–1004.
21. Clerico A, Iervasi G, Del Chicca MG, et al. 1996 Analytical performance and clinical usefulness of a commercially available IRMA kit for the measurement of atrial natriuretic peptide in patients with heart failure. Clin Chem. 42:1627–1633.
22. Hensen J, Abraham WT, Lesnefsky EJ, et al. 1992 Atrial natriuretic peptide kinetic studies in patients with cardiac dysfunction. Kidney Int. 42:1333–1339. 23. Clerico A, Iervasi G. 1995 Alterations in metabolic clearance of atrial natri-uretic peptides in heart failure: how do they relate to the resistance to atrial natriuretic peptides? J Cardiac Failure. 1:323–328.