UNIVERSITY OF NAPLES FEDERICO II
DOCTORATE
MOLECULAR MEDICINE AND MEDICAL BIOTECHNOLOGY XXXI CICLO
TBX1 TRANSCRIPTION FACTOR: MECHANISMS OF
GENE REGULATION
Tutor Candidate
Prof. Antonio Baldini Andrea Cirino
COORDINATOR
Prof. Vittorio Enrico Avvedimento
TABLE OF CONTENT
ABSTRACT ... 4
ABBREVIATIONS ... 5
LIST OF FIGURES AND TABLES ... 7
INTRODUCTION ... 9
DiGeorge Syndrome and the candidate gene. ... 9
Tbx1 encodes a Transcription factor of the T-box family. ... 11
Tbx1 can regulate target genes without binding the DNA. ... 15
Chromatin remodeling and Transcription factor activity. ... 16
Tbx1 and the Second Heart Field (SHF). ... 19
AIMS ...22
MATERIALS AND METHODS ...23
1. Experimental Models ... 23
Mouse lines ...23
Cell lines (P19Cl6, C2C12, mESC) ...25
In vitro differentiation ...27
2. Molecular Biology procedures ... 29
RNA-seq ...29
Assay for Transposase-Accessible Chromatin (ATAC-seq) and quantitative ATAC (Q-ATAC)...30
Chromatin Immunoprecipitation (ChIP) and quantitative ChIP ...33
Antibodies ...34
3. Bioinformatics analyses ... 35
RNA-seq ...35
ATAC-seq ...36
Real-time PCR, statistical analysis ...40
RESULTS ...41
TBX1 controls histone acetylation at the Mef2c-Anterior Heart Field (AHF)
locus. ... 41
Chapter 2 ...43
Generation of chromatin accessibility maps of P19Cl6 cells with and without Tbx1. ... 43
Intersection of ATAC-seq and ChIP-seq data: many TBX1 binding sites are located within closed chromatin. ... 50
Some loci show delayed response to loss of Tbx1 dosage in time-course experiments. ... 55
Chapter 3 ...59
mESC differentiation and Tbx1 expression. ... 59
Chromatin remodelling and gene expression in differentiated mESCs WT and Tbx1-/-. ... 65
Chromatin remodelling studies in vivo: Initial experiments and future perspectives. ... 71 DISCUSSION ...73 CONCLUSIONS ...77 ACKNOWLEDGMENTS ...78 REFERENCES ...79 LIST OF PUBLICATIONS ...90
4
ABSTRACT
The Tbx1 gene encodes a transcription factor, TBX1, critical for heart development in several species, including humans. The haploinsufficiency of this gene is associated with DiGeorge Syndrome (DGS) named also 22q11.2 Deletion Syndrome (22q11.2DS) which is characterized by multiple congenital anomalies, including heart disease (CHD). The molecular mechanisms by which TBX1 regulates its targets are unclear. In my thesis work I have focused on chromatin interactions mechanisms. In a first set of experiments using as a model a specific target gene, I have demonstrated that loss of TBX1 correlate with acetylation of a specific enhancer named anterior Heart Field (AHF) of the Mef2c gene, a gene critical for cardiogenesis. The mechanisms by which TBX1 affects histone acetylation need to be clarified, but we could not demonstrate a direct interaction with HDAC1 and HDAC2. Most of my thesis work has been dedicated to understanding the role of TBX1 in chromatin remodelling. By manipulation of two different model systems, I have generated maps of the accessible regions in different dosages of Tbx1. In P19Cl6 cells, I found that 86% of TBX1 binding sites are in closed chromatin. After Tbx1 knock down, I found that differentially accessible regions (DARs) are not localized in regions bound by TBX1. Consistent with this finding, I did not find T-box motifs in DARs. However, a limited study using time-course experiments identified a delayed chromatin remodelling in selected loci bound by TBX1. In contrast, a study of chromatin remodelling in differentiated murine embryonic stem cells (mESCs), WT and Tbx1-/- revealed that DARs do have T-box motifs suggesting that a good portion of chromatin changes may be located in TBX1-binding regions. Comparison between P19Cl6 and mESCs reveals differences about DARs binding motifs and communalities about the increase numbers of accessible regions after Tbx1 loss of function. In conclusion, my studies revealed new insight into the mechanisms by which TBX1 affects the chromatin landscape and indicate that mechanisms may be different depending on the cellular context.
5
ABBREVIATIONS
22q11.2 Deletion Syndrome 22q11.2DS 5-Azacytidine 5-Aza
acetylation of lysine 27 of histone 3 H3K27Ac Adrenocorticotropic Hormone ACTH
Anterior Heart Field AHF
Assay for Transposase-Accessible Chromatin ATAC Atrial Siphon Muscle ASM
Bone Morphogenetic Factor BMF Cardiac Progenitors CP
Chromatin Immunoprecipitation ChIP Clustered Regularly Interspaced
Coloboma, Heart defects, Atresia chonae, Retarded growth, Genital hypoplasia, Ear anomalies CHARGE
complementary Deoxyribonucleic acid cDNA Congenital Heart Defects CHD
Deoxyribonucleic acid DNA
Differentially Accessible Regions DARs Differentially Expressed DE
DiGeorge Syndrome DGS Dimethyl sulfoxide DMSO
epithelial-like layer of the SHF eSHF First Heart Field FHF
Fluorescent Activated Cell Sorter FACS Gene Ontology GO
Holt-Oram Syndrome HOS
Hypergeometric Optimization of Motif Enrichment HOMER Knock-down KD
Low Copy Repeat LCR Mitochondrial reads M
monomethylation of lysine 4 of histone 3 H3K4me1 murine Embryonic Stem cells mESC
Polymerase Chain Reaction PCR Prepulse Inhibition PPI
Principal Component Analysis PCA Ribonucleic acid RA
Second Heart Field SHF Serum Response Factor SRF small interfering RNA siRNA
6 Small Patella Syndrome SPS
Spatial Clustered Identification of ChIP-Enriched Regions SICER Systematic Evolution of Ligands by Exponential Enrichment
SELEX
Transcriptional Start Site TSS
Ulnar-Mammary Syndrome UMS
Vascular Endothelial Grown Factor VEGF Velocardiofacial syndrome VCFS
7
LIST OF FIGURES AND TABLES
Figure 1: Structure of the TBX3/DNA Complex.
Figure 2: Selection of specific oligonucleotides bound to TBX1. Figure 3: TBX1 de novo motif.
Figure 4: Structure of the TBX1/DNA Complex.
Figure 5: An evolutionary conserved cardiopharyngeal ontogenic motif. Figure 6: murine Embryonic Stem Cells (mESCs) differentiation. Figure 7: ATAC-seq schematic pipeline.
Figure 8: Custom Nextera PCR Primers. Figure 9: Sam output structure.
Figure 10: Adapter contamination in raw reads. Figure 11: Contamination free in raw reads. Figure 12: Tbx1-KD in C2C12 cells.
Figure 13: TBX1 and H3K27Ac enrichment at Mef2c-AHF enhancer in C2C12 cells.
Figure 14: P19Cl6 cells differentiation until D1. Figure 15: P19Cl6 RNA quality.
Figure 16: Tbx1-KD in P19Cl6 cells.
Figure 17: DNA concentration and size distribution in P19Cl6 cells.
Figure 18: Total accessible regions distribution in Control and Tbx1-KD P19Cl6 cells.
Figure 19: Intersection between Control and Tbx1-KD accessible regions and TBX1-binding regions in P19Cl6 cells.
Figure 20: Intersection between Control and Tbx1-KD accessible regions and TBX1-binding regions based on genome coverage in P19Cl6 cells.
Figure 21: Intersection between differential accessible regions (DARs)/ Total Regions and TBX1-binding sites in P19Cl6 cells.
Figure 22: Motifs discovery in differential accessible regions (DARs) which increase accessibility in P19Cl6 Tbx1-KD cells.
Figure 23: Putative responsive loci associated to differential accessible regions (DARs) which increase accessibility in P19Cl6 Tbx1-KD cells. Figure 24: P19Cl6 cells differentiation until D2.
Figure 25: Tbx1-KD in P19Cl6 cells during differentiation. Figure 26: Putative responsive loci to Tbx1-KD in P19Cl6 cells. Figure 27: Tbx1-overexpression in P19Cl6 cells during differentiation. Figure 28: Putative responsive loci associated to Tbx1 overexpression in P19Cl6 cells.
Figure 29: Tbx1 and cTnt2 expression during murine embryonic stem cells (mESCs) differentiation.
Figure 30: Chromatin accessibility variations in genes involved in cardiac differentiation.
8 Figure 31: FACS-sorted murine embryonic stem cells (mESCs) differentiated at d4.
Figure 32: Tbx1 expression in murine embryonic stem cells (mESCs).
Figure 33: Total accessible regions distribution in d4-PDGFRa+, Tbx1 WT and KO murine embryonic stem cells (mESC).
Figure 34: Motifs discovery in d4-PDGFRa+ differential accessible regions (DARs) which increase accessibility murine embryonic stem cells (mESCs)
Tbx1-KO cells.
Figure 35: Motifs discovery in regions which gain accessibility in d4-PDGFRa+ murine embryonic stem cells (mESCs) Tbx1-KO cells.
Figure 36: T-box motif in regions which gain accessibility in d4-PDGFRa+ murine embryonic stem cells (mESCs) Tbx1-KO cells.
Figure 37: RNA-seq data on d4-PDGFRa+, Tbx1 WT and KO murine embryonic stem cells (mESCs).
Figure 38: Tbx1 expression in Tbx1cre/+; R26mT/mG embryo.
Figure 39: DNA size distribution in Tbx1cre/flox; R26mT/mG embryos.
Figure 40: Cartoon showing a working model by which TBX1 may regulate target genes.
Table1: DNA binding Motifs for T-box Transcription Factors identified with different techniques.
Table2: Antibody list used in this work.
Table3: Alignment rate (%) before and after removing of Nextera transposase Sequence in P19Cl6 cells.
Table4: Comparison between the number of total reads with and without Mitochondrial reads in P19Cl6 cells.
Table 5: Total Peaks number in P19Cl6 cells.
Table 6: Genes involved in cardiopharyngeal mesoderm during murine embryonic stem cells (mESCs) differentiation.
Table 7: Total Peaks number in d4-PDGFRa+, Tbx1 WT and KO murine embryonic stem cells (mESCs).
Table 8: Total pooled Peaks number in d4-PDGFRa+, Tbx1 WT and KO murine embryonic stem cells (mESCs).
Table 9: Common genes associated to differentially accessible regions (DARs) and differentially expressed (DE) genes in d4-PDGFRa+, Tbx1 WT and KO murine embryonic stem cells (mESCs).
Table 10: Differentially expressed (DE) genes between d4-PDGFRa+, Tbx1 WT and KO murine embryonic stem cells (mESCs).
9
INTRODUCTION
DiGeorge Syndrome and the candidate gene.
The gene studied in the thesis work was identified in an effort to isolate the gene/s involved in DiGeorge syndrome (DGS) or 22q11.2 deletion syndrome (22q11.2DS) (Linsday EA et al., 2001; Merscher S et al., 2001). Congenital heart disease (CHD) affects 8/1000 live births. A common genetic cause of CHD is the 22q11.2 deletion, also known as DiGeorge syndrome (DGS) (McDonald-McGinn DM et al., 2015). It has been estimated that a substantial portion of patients with some specific heart defects have 22q11.2 deletions: 52% of those with interrupted aortic arch type B, 34% with truncus arteriosus, 16% with tetralogy of Fallot and 5-10% with Ventricular Septal Defects (VSD). Besides CHD, patients have a number of other phenotypic features, for example cleft palate, development disabilities and schizophrenia. At the genetic level, the deletion could result from aberrant homologous recombination between low copy repeat (LCR) sequences, which flank the deleted regions (Edelman L et al., 1999). The name of this genetic disorders derives from Angelo DiGeorge who, in the late ‘60s, described this syndrome characterized by aberrant development of the thymus and parathyroid. Some of the development anomalies of DGS were also reproduced on chick models of neural crest ablation (Farrel MJ et al., 1999) leading investigators to hypothesize that DGS may derive from abnormal development of neural crest cell-contributed organs. However, more recent studies have implicated other cell lineages, specifically the cardiopharyngeal mesoderm, that will be discussed later. DGS is caused by chromosomal microdeletion of chromosome 22, at q11.2 locus; therefore, the disease is now commonly referred to as 22q11.2 deletion syndrome. Most patients with this syndrome have a large (3Mb) genomic deletion. About 10% of patients have a smaller deletion of about 1.5 Mb. Most genes localized in the region are conserved in the mouse on chromosome 16 (Gong W. et al., 1996; Botta A et al., 1997; Sutherland HF et al., 1998; Puech A et al., 1997; Lund J et al., 1999). This system allowed for the engineering of the first model, named Df1, which carries a deletion that encompasses mouse homologues of 18 genes that are deleted in patients with 1.5 Mb deletion whose phenotype is characterized by heart defects, thymus and parathyroid defects (Linsday EA et al., 1999). In particular, the cardiac defects may be rescued in Df1 mice on chromosome 16 by reciprocal duplication (Dp1) on the homolog, restoring normal dosage of the Df1 region.
Further mouse studies discovered that mutation of Tbx1, included in the Df1 region, is sufficient to recapitulate the phenotypic spectrum of the disease
10 (Jerome LA et al., 2001; Linsday EA et al., 2001; Merscher S et al., 2001). The role of TBX1 in the human disease has been subsequently confirmed in human patients with clinical phenotypes consistent with DGS but lacking chromosomal deletions, but had mutations of TBX1 gene (Yagi H et al., 2003). These studies demonstrated that heterozygous mutation of TBX1 is sufficient to cause most of the clinical features of 22q11.2DS patients. Tbx1 mouse mutants show different phenotypes also seen in patients, for example:
Tbx1-null mice have a small otocyst that fails to grow and does not give rise
to the vestibular and cochlear apparata (Vitelli F et al., 2003). Auditory problems are common in 22q11.2DS patients (McDonald-McGinn DM et al., 2015). In addition, loss of Tbx1 causes abnormalities of lymphatic vessel development as it regulates Vegfr3, a gene essential for lymphangiogenesis (Chen L et al., 2010). Lymphatic vessel defects have been found in 22q11.2DS patients (Unolt M et al., 2018).
11
Tbx1 encodes a Transcription factor of the T-box family.
The T-box family of transcription factors includes TBX2, TBX3, TBX4, TBX5, TBX6, TBX10, TBX13, TBX14, TBX15, TBX18, TBX19, TBX20, TBX21, TBX22, BRACHYURY, T-BRAIN1, EOMESODERMIN, and of course TBX1. These T-box proteins have a common DNA-binding motif called “T-domain” that binds DNA in a sequence-specific manner (Papaioannou VE, 2014). Genes encoding them have a vital role in embryogenesis and more recently they have also been implicated in cancer biology. The T-box binding element is a palindromic DNA sequence with strong affinity for BRACHYURY, also called as “T”, which interacts with that sequence in a dimeric form, each monomer binds a half site called T-half site (5’-AGGTGTGAAATT-3’) (Kispert A et al., 1993). The T-gene was discovered in 1927 because of a spontaneous mutation, which caused truncated tails in mice (Dobrovolskaia-Zavadskaia N et al., 1927).
The T-box domain is about 180 amino acids long. The T-box domain, mostly situated in the middle portion of the protein, is a stretch of 180-190 aa residues and is defined as the minimal region that is necessary for the sequence-specific binding to DNA (Papaioannou VE et al., 1998). Different human genetic diseases are associated with mutations of T-box genes, for example mutation in Tbx3 causes an autosomal dominant disorder characterized by mammary gland hypoplasia, dental and genital abnormalities (Bamshad M et al., 1997; 1999) and upper limb malformations called Ulnar-Mammary Syndrome (UMS). Mutation in Tbx4 are associated with another genetic disorder named small patella syndrome (SPS) related to problem in skeletal development of patella (Bongers EM et al., 2004). Alteration in Tbx5 lead to an autosomal dominant disorder, Holt-Oram syndrome (HOS) in which most affected patients exhibit cardiac and limb malformations (Li QY et al., 1997). Finally, Yi et al., 1999 demonstrated that mutations of Tbx19 are associated with loss of adrenocorticotrophic hormone (ACTH) and melanocyte stimulating hormone in the corticotroph and melanotroph cell lineages in the pituitary resulting in adrenal insufficiency. T-box proteins have a variable weight: the range is from 50 to 78 kDa. Although, as described above, BRACHYURY binds DNA as a dimer (Papapetrou C et al., 1997) and exhibits a common human polymorphism Gly-177-Asp in the conserved DNA-binding domain, with each monomer binding half of the sequence, or T-half site (5’-AGGTGTGAAATT-3’). The T-box domains change between the different T-box proteins, although some specific residues are 100% conserved between the different T-box domains whose preference for different combinations of orientations, number and spacing of T-half sites may help to create binding specificity for target genes
12 (Conlon FL et al., 2001). The figure 1 shows a ribbon diagram of a human TBX3 monomer bound to its DNA target site.
Fig. 1
Figure 1. Structure of the TBX3/DNA Complex. Ribbon diagram of a human TBX3 monomer bound to its DNA target site. Secondary structure elements are labelled, and helices, strands, and loops are depicted in turquoise, red, and grey, respectively (Coll M et al., 2002).
After the discovery of the first Tbx1 mutations (Yagi H et al., 2003), additional patients have been described and two of them had a truncating mutation that resulted in loss of function due to the deletion of a C-terminal nuclear localization (Stoller JZ et al., 2005). Another missense mutation has been described in a familial case of Shprintzen syndrome. This missense mutation results in gain of function, possibly through stabilization of the protein dimer DNA complex (Zweier C et al., 2007). Prepulse inhibition (PPI) deficits in Df1/+ mice are caused by haploinsufficiency of Tbx1 and mutation in this gene is sufficient to cause reduced PPI (Paylor R et al., 2006). Screening of TBX1 coding sequence identified a frameshift deletion (1320-1342del23bp) in patient with characteristic facial appearance of velocardiofacial (VCFS) and hypernasal speech (Paylor R et al., 2006). Overall very few Tbx1 mutations have been reported suggesting that they are rare. TBX1 binds to a consensus sequence that has been identified recently. Two studies have identified the consensus using different technologies: Systematic Evolution of Ligands by Exponential Enrichment (SELEX) (Castellanos R et al., 2014) and ChIP-seq (Fulcoli FG et al., 2016). TBX1 preferentially binds to a tandem repeat of 5’-AGGTGTGAAGGTGTGA-3’
13 but it can also interact with Half Sites. The figure 2 shows the motifs identified with SELEX (Tandem and Half site).
Fig. 2
Figure 2. Selection of specific oligonucleotides bound to TBX1. Sequence alignment shows that the optimal DNA binding motif for TBX1 is AGGTGT(G/T) (A/T) followed by two repeated similar motifs termed the Tandem Repeat (TR) and Half Site Partial Site as shown (½SPS) (Castellano R et al., 2014)
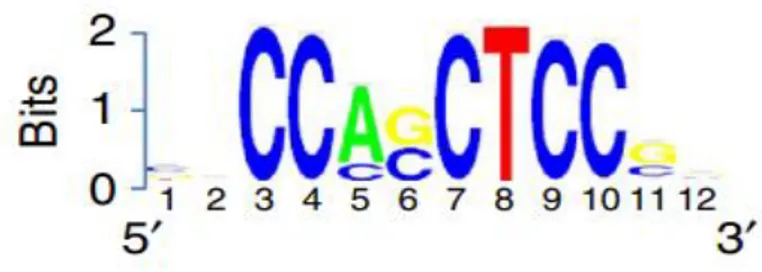
De novo motif discovery, using ChIP-seq with a Tbx1 antibody, has uncovered an 8-bp consensus sequence (Fig. 3).
Fig. 3
Figure 3. TBX1 de novo motif. Sequence logo representing the enriched Tbx1 motif identified by de novo motif discovery (Fulcoli FG et al., 2016).
14 Table 1 lists the consensus sequences for a group of T-box proteins.
Table 1
Gene Publication Sequence Method
Tbx1 Fulcoli FG et al., 2016 GG A G G/C T G G
ChIP-seq
Tbx1 Castellanos R et al., 2014
A G G T G T G/T A/T SELEX
Tbx5 Narlikar L et al., 2013 GG/AA G G/A T G G/A
ChIP-seq
Tbx5 Mori AD et al., 2006 A/G/T G/A G T G N
N A ChIP-seq Tbx5 Luna-Zurita L et al., 2016 G A G G T G ChIP-EXO
Table 1. DNA binding Motifs for T-box Transcription Factors identified with different
techniques. The table is divided in Gene, Publication, Sequence and Method used (Baldini A
et al., 2017).
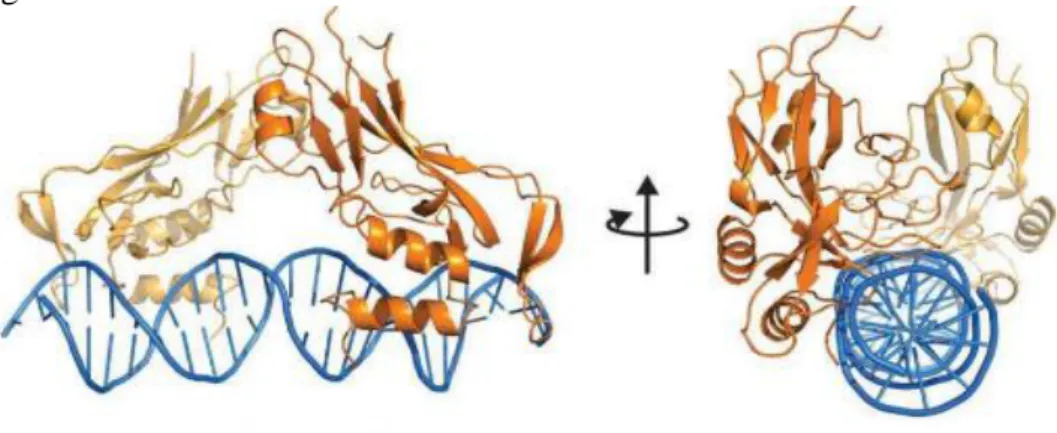
How does TBX1 bind DNA? The T-box domain of TBX1 is composed of a seven beta-barrel domain core related to an s-type immunoglobulin fold (Bork P et al., 1994), and closed by a smaller beta-pleated sheet as illustrated in the Fig. 4 (El Omari K et al., 2012). It has been proposed that TBX1 binds the DNA as monomer based on the observation that the molecular surface for potential dimerization is too small to be of biological significance.
Fig. 4
Figure 4. Structure of the TBX1/DNA Complex. Ribbon diagram of a TBX1 bound to its DNA target site. TBX1 is in yellow (monomer “a” light yellow, monomer “b” dark yellow), DNA is in blue) (El Omari K et al., 2012).
15
Tbx1 can regulate target genes without binding the DNA.
DNA binding is not the unique mechanism by which Tbx1 can function. Two papers published in 2009 reported that TBX1 interacts with specific proteins and its biological function is independent from its binding to DNA. Fulcoli FG et al., 2009 have demonstrated an interaction between TBX1 and SMAD1. SMAD1 is a member of SMADS family of proteins that are key signal transducers downstream of the TGF-Beta superfamily type I receptors (Mehra A et al., 2000). SMAD1 has a central role in BMP signal transduction essential for mesoderm formation, cartilage development, postnatal bone formation and heart development. In addition, BMP4 plays an important role during gastrulation stage, in particular conditional deletion of BMPR1a in embryos showed a shortened cardiac outflow tract with septation defects, a process known to require neural crest and is necessary for perinatal viability (Stottmann RW et al., 2004). The interaction TBX1-SMAD1 suppresses SMAD1 binding to SMAD4, and a Tbx1 mutation that prevents binding to DNA does not affect binding to SMAD1 nor does it affect the ability to suppress SMAD1 activity (Fulcoli FG et al., 2009). Thus, TBX1 can affect the BMP signal transduction mechanism without binding the DNA. The TBX1-SMAD1 interaction is not the only mechanism by which TBX1 acts without binding to DNA. In another paper it has been shown that Tbx1 plays an important role in regulating proliferation and differentiation of multipotent heart progenitors by interacting with another transcription factor, Serum Response Factor (SRF), a master regulator of muscle differentiation, and it regulates negatively its level. The TBX1 effect on SRF dosage was not due to transcriptional downregulation but was proteasome-dependent (Chen L et al., 2009). The TBX1-SRF interaction is potentially important for regulating the differentiation of cardiac progenitors (CP). Indeed, it was demonstrated that TBX1 promotes CP proliferation and inhibits their differentiation (Chen L et al., 2009).
16
Chromatin remodeling and Transcription factor activity.
Although a systematic, unbiased screening of TBX1 protein interactions has not been done, an initial picture of TBX1-chromatin interactions is emerging. Many biological processes, in particular developmental programs, are controlled, by transcription factors and chromatin regulators. The cooperation between transcription factor and chromatin remodelers is necessary to maintain specific gene expression programs through epigenetic modification of the genome (Zaret KS et al., 2011). Thanks to new technologies it is becoming clear that there is a strong correlation between genome and epi-genome. The epigenetic landscape of enhancer elements is important for commitment of embryonic stem cells and their self-renewal. There are at least two post-translational histone modifications correlated with TBX1 known to date: H3K27Ac (the acetylation of lysine 27 of histone 3) and H3K4me1 (the monomethylation of lysine 4 of histone 3). H3K27Ac distinguishes active enhancers from primed ones, which are characterized only by H3K4me1 (Creighton MP et al., 2010). Chen et al., 2012, have demonstrated an interaction between TBX1 and a methyltransferase SETD7, but it has later been shown that this occurs outside from the chromatin context, so the significance of this interaction is unclear (Fulcoli FG et al., 2016). In contrast, in the chromatin context, TBX1 interacts with KMT2C (MLL3). KMT2C and LSD1, a histone demethylase, maintain the methylation level of H3K4. ChIP-seq using anti TBX1 and H3K4me1 antibodies revealed a highly significant overlap between TBX1 binding sites and H3K4me1-enriched regions. Furthermore, ChIP-seq with an antibody anti H3K27Ac demonstrated that TBX1 binds to H3K27Ac-poor regions (Fulcoli FG et al., 2016). Whether TBX1 actively maintains histone hypoacetylation is still unclear. ChIP-seq and RNA-seq correlations using P19Cl6 with and without Tbx1 knock down suggested that Tbx1 is neither a strong activator nor a strong repressor. In general, T-box proteins can be activators or repressors (Kawamura A et al., 2008), depending on biological context. For example, Tbx1 is “activator” for mechanisms correlated to proliferation and “repressor” for mechanisms correlated to differentiation of muscle cells (Chen et al., 2012). It is possible that the TBX1 function is to prime target enhancers and make them accessible to other regulators which can act as activator or repressor (Baldini A et al., 2017). It is possible that the
Tbx1 haploinsufficiency phenotype could be a direct consequence of reduced
H3K4me1, resulting in reduced accessibility of specific enhancers (Baldini A et al., 2017).
TBX1 interacts also with ASH2l, the mammalian homolog of Drosophila ASH2 (absent small homeotic 2), a core component of multimeric histone
17 methyltransferase necessary for methylation of histone lysine residues. The interaction could be seen with a yeast 2-hybrid system and in mammalian cells, although its biological significance is unknown. (Stoller JZ et al., 2010). TBX1 interacts also with Nkx2-5 which encodes a homeobox-containing transcription factor required for heart development (Nowotschin S et al., 2006). Experiments in Ciona Intestinalis have revealed an antagonism mechanism between TBX1 and NKX2-5. Specifically, in cells undergoing asymmetric cell division of common progenitors, Nkx2-5 promotes GATA expression and cardiac specification in the second heart precursor by antagonizing Tbx1-mediated inhibition of GATA and activation of determinants of atrial siphon muscle (ASM) specification, the homologous regions of mastication muscle in mammalian (Wang W et al., 2013).
Furthermore, it has been reported a genetic interaction between Chd7 and
Tbx1, in particular it was found that these two genes were in epistatis and that
the correct level of their expression was required in pharyngeal ectoderm for proper morphogenesis of the great arteries (Randall V et al., 2009). The Chd7 gene encodes a chromo-domain containing, chromatin remodeling protein, involved in CHARGE syndrome (an acronym for Coloboma, Heart defect, Atresia choanae, Retarded growth, Genital hypoplasia, and Ear anomalies) which has some similarities with DGS. The mechanism of genetic interaction is unclear but CHD7 binds approximately 10000 regions in the mouse genome and most of them localize in H3K4me1 rich regions (Schnetz MP et al., 2010). This parallelism suggests that TBX1 and CHD7 may co-localize in some enhancers.
Chen and co-workers (Chen L. et al., 2012) found an interaction between TBX1 and BAF60A also known as SMARCD1. This protein belongs to a SWI/SNF complex, whose members have helicase and ATPase activities and can regulate gene expression by remodelling chromatin (Hsiao PW et al., 2003). TBX1 co-immunoprecipitates with BAF60A and is able to recruit BAF60A onto the target gene Wnt5a. Knock down of Baf60a affects the ability of TBX1 to regulate different target genes in vitro, including Wnt5a.
Tbx1 and Wnt5a interact genetically because the loss of both genes produces
a more severe phenotype than loss of one of them in vivo. In cultured cells, TBX1 binds the T-box binding elements of the Wnt5a gene (Chen et al., 2012). It may be that TBX1 is able to interact with BAF60A and recruit the member of the complex in proximity to its target sites where it remodels chromatin and active target enhancers through recruiting of histone metyltransferase. Time-course experiments in vitro and expression analyses in vivo suggest that Baf60a is expressed in most tissues during mouse embryonic development and it is downregulated during cardiac differentiation. In contrast the expression of Baf60c (Smarcd3), an alternative member of the same complex, has an inverse correlation with cardiac
18 differentiation. Overall, the review of the literature presented here suggests that Tbx1 functions may be related to epigenetic modifications operated through interactions with other transcription factors, histone modifiers and chromatin remodelers.
19
Tbx1 and the Second Heart Field (SHF).
Tbx1 expression is variable both spatially and temporally across tissues, it is
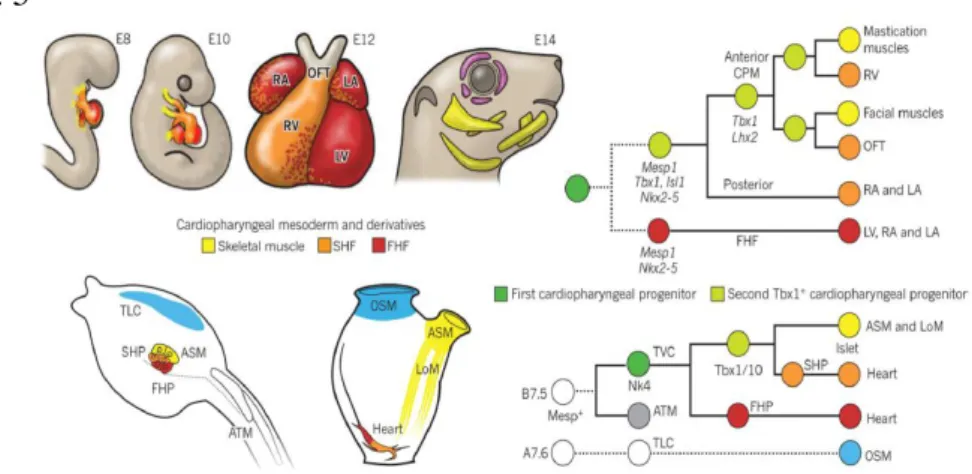
expressed in mice during embryogenesis and is finely regulated (Xu H et al., 2005). Specifically, it is expressed in the pharyngeal apparatus which includes phanyngeal endoderm, ectoderm, mesodermal core of pharyngeal arches, head mesenchyme and the second heart field (SHF) (Xu H et al., 2005). The SHF is defined as a reservoir of cardiac progenitors, which gradually migrate into the heart and contribute to the growth of the outflow tract, the right ventricle and atria (Mjaatvedt CH et al., 2001; Kelly RG et al., 2001; Waldo KL et al., 2001). The amniote heart is made up of cardiomyocytes arisen from two different adjacent progenitor cell populations in the early embryo (Meilhac SM et al., 2004). Early differentiating cardiac progenitor cells of the first heart field (FHF) give rise to the linear heart tube, that eventually becomes the left ventricle, and to part of the atria (Kelly RG 2012, Tzahor E et al., 2011). Progenitors of the SHF derive from the primitive streak and later localize to the pharyngeal and splanchnic mesoderm. These progenitors are multipotent and will give rise to cardiomyocytes and endothelial cells of the outflow tract, right ventricle and most of the atria (Kelly RG et al., 2001; Mjaatvedt CH et al., 2001). The SHF is divided into two subpopulations, the anterior and posterior SHF that contribute to the arterial and venous poles of the heart, respectively (De Bono C et al., 2018). SHF-derived segments of the heart share a lineage relationship with craniofacial skeletal muscle (Lescroart F et al., 2014) revealing that there are common progenitors that give rise to both cardiac and craniofacial muscle cells. This newly discovered lineage is conserved across species and has been named the cardiopharyngeal mesoderm (Diogo R et al., 2015) (Fig. 5).
20 Fig. 5
Figure 5. An evolutionary conserved cardiopharyngeal ontogenic motif. On the top, left: mouse embryo at E8 and 10, four chamber at E12 and mouse head at E14. On the top, right: Lineage tree depicting the origins of cardiac compartments and branchiomeric muscles in mice. All cells derive from common pan-cardiopharyngeal progenitors (dark green) that produce the FHF, precursors of the left ventricle and atria, and the second Tbx1+ cardiopharyngeal progenitors (light green). On the bottom, left: Cardiopharyngeal precursors in Ciona intestinalis hatching larva (left) and their derivatives in the metamorphosed juvenile (right). On the bottom, right: Lineage tree depicting clonal relationships and gene activities deployed in Ciona intestinalis cardiopharyngeal precursors. The latter pancardiopharyngeal progenitors express Nk4 and divide asymmetrically to produce the FHP (red) and second TVCs, the Tbx1/10+ second cardiopharyngeal progenitors (second TVC, light green disk) (Diogo R et al., 2015).
Genetic experiments in mouse and other organisms have shown that Tbx1 is necessary for outflow tract development and it also affects the development of craniofacial muscle as well as other organs derived from the pharyngeal apparatus. Therefore, Tbx1 is hypothesized to be a major regulator of the development of the cardiopharyngeal mesoderm lineage. Genome-wide gene expression analysis in Tbx1 mutant embryos have highlighted a number of pathways that are affected by the loss of the gene. For example, in one study
Hod and Nkx2-6 were downregulated in Tbx1 null embryos, in contrast some
of the genes necessary for cardiac morphogenesis, such as Gata factors (Gata4), Raldh2 and Tbx5, and a subset of muscle genes were ectopically expressed (Liao J et al., 2008). Tbx1 also downregulates the expression of
Vegfr2 in the posterior SHF and the expression of Vegfr2 is up regulated and
extended in the absence of Tbx1 (Lania G et al., 2015). Tbx1 plays an important role for tissue architecture. Pathway analyses of Tbx1 target genes identified genes involved in focal adhesion and tissue architecture (Fulcoli FG et al., 2016). Recent data from the lab have confirmed that Tbx1 is required for the integrity of the axis ECM-Integrin-Focal adhesion in the SHF (Alfano D et al., 2018 Biorxiv). The communication between extracellular
21 matrix, integrin and focal adhesion, is altered in SHF of Tbx1 null mice, suggesting that Tbx1 is required for correct ECM-cell interactions. In particular, in the epithelial-like layer of the SHF (eSHF), Paxillin, Vinculin, E-cadherin, F-actin and NMIIB are mis-localized, possibly compromising the cohesiveness of the epithelial cell layer. Discoveries concerning the exact relationship between Tbx1 and SHF development will lead new insights into the pathogenesis of congenital heart defects.
The developmental roles of Tbx1 has been under study for years. In Tbx1-null mice, outflow tract progenitor cells fail to expand and contribute to the dorsal pericardial wall and then to the heart poles, leading to abnormalities of the outflow and inflow tracts (Rana MS et al., 2014). The developmental roles of
Tbx1 are at least partially conserved during evolution. For example, in
zebrafish the loss of Tbx1 is associated with ventricular and outflow tract defects consistent with a conserved role in SHF-mediated cardiogenesis. More in details, in Tbx1 null animals there were 25% less cardiomyocytes that contributes to the heart tube suggesting a defective proliferation of cardiac precursor (Nevis K et al., 2013).
22
AIMS
The overall aim of my thesis work is to explore mechanisms by which the transcription factor TBX1 regulates its targets through interaction with chromatin.
In particular, I will address the following specific aims:
1) To understand the relationship between TBX1 and histone acetylation.
TBX1 binds H3K4me1-rich regions and H3K27Ac-poor regions. I will ask the question if TBX1 has an active role in maintaining the histone acetylation status on chromatin. To do this, I will use a cell culture model to understand if TBX1 dosage affects the acetylation status of the Mef2c “anterior heart field” enhancer.
2) To map chromatin accessibility genome-wide with and without TBX1.
I will use a recently developed technology, known as “Assay for Transposase-Accessible Chromatin followed by deep sequencing” (ATAC-seq) to quantitatively measure chromatin accessibility genome-wide. I will use two cell models: mouse P19Cl6 cells and mouse embryonic stem cells (mESC). Both models can be differentiated in vitro. Manipulation of TBX1 dosage will be obtained by small interfering RNA (for P19Cl6 cells) or by gene deletion (mESC). Finally, I will extend the experiments to genetically-labelled cells purified from heterozygous and homozygous mutant mouse embryos.
3) To determine the correlation between changes in chromatin accessibility and TBX1 binding to chromatin.
I will integrate chromatin accessibility data with available map of TBX1 binding sites and gene expression data. I will ask whether TBX1 has a local impact on chromatin remodelling and, if so, which genes respond to TBX1 dosage changes.
23
MATERIALS AND METHODS
1. Experimental Models
Mouse lines
Tbx1Cre/+
Cre-recombinase is knocked-into exon 5 of the Tbx1 gene. The insertion caused inactivation of the gene, so Tbx1Cre/+ animals are functionally heterozygous mutants (Huynh T et al., 2007). In this line, Cre is faithfully expressed in the Tbx1 expression domain. The Cre/loxP system has been used for many years in conditional mutagenesis in mice.
R26RmT-mG
This is a Cre recombination reporter line. Reporters of Cre enzyme are important for defining the spatial and temporal extent of Cre-mediated recombination. R26RmT-mG is a double-fluorescent Cre reporter mouse that
expresses membrane-targeted tandem dimer Tomato (mT) in every tissue. Upon Cre-mediated recombination, it switches to expression of a membrane-targeted green fluorescent protein (mG) (Muzumdar MD et al., 2007).
Tbx1flox/+
This line carries a loxP-flanked (flox) exon 5 of the Tbx1 gene (Xu et al., 2004). Upon Cre recombination, the floxed allele is excised and the gene inactivated.
Embryos with genotype Tbx1Cre/flox are functionally homozygous mutants but only in cells in which Tbx1 is expressed (and thus Cre is expressed). In embryos Tbx1Cre/flox; R26mT-mG, homozygous (recombined) cells are
identifiable because they express green fluorescence. Mice were genotyped by PCR using DNA extracted from tail biopsies (or embryo yolk sacs) using the following primers pairs:
Tbx1Cre: Tbx1Cre-F (5’-TGATGAGGTTCGCAAGAACC-3’) Tbx1Cre-R (5’- CCATGAGTGAACGAACCTGG-3’)
24 Tbx1flox-R (5’-AAAGACTCCTGCCCTTTTCC-3’) R26R mT-mG: TOM R1 AAAGTCGCTCTGAGTTGTTAT TOM R3 GGAGCGGGAGAAATGGATATG pCAG GTCGTTGGGCGGTCAG
25 Cell lines (P19Cl6, C2C12, mESC)
P19Cl6.
P19Cl6 cells are a clonal derivative isolated from murine P19 embryonic carcinoma cells (Mueller I et al., 2010). This Cl6 subline efficiently differentiates into beating cardiomyocytes with adherent conditions when treated with 1 % DMSO. Cells are maintained a minimal essential medium supplemented with 10% fetal bovine serum, penicillin (100 U/mL), streptomycin (100 µg/mL) and L-glutamine (300 µg/mL). Cells were maintained at 37°C in 5% CO2.
C2C12.
C2C12 cells are mouse undifferentiated myoblast cells (ATCC CRL-1772) which express high levels of Tbx1 and can be manipulated through siRNA transfection. C2C12 were cultured in Dulbecco’s modified Eagle’s medium (DMEM, Invitrogen) supplemented with 10% FBS and L-glutamine (300 µg/mL). Cells were maintained at 37°C in 5% CO2.
Mouse embryonic stem cells (mESC).
Mouse embryonic stem cells (mESC) derive from the inner cell mass of blastocyst. Due to their ability to differentiate in many cell types, mESCs are largely used in the research lab for “in vitro” studies and it is a very powerful tool for genetic disease and obviously are extremely used in development and stemness field. We have used the line ES-E14TG2a (ATCC CRL-1821) that is grown in feeder free conditions. Cells were cultured in Glasgow medium (GMEM, Sigma), 15% FBS, ESGRO Chemicon (ESG1106), 100x β-mercaptoethanol (BME), 100x Glutammine, 100x Non-Essential Amino Acid (NEAA), 100x Sodium pyruvate (NA-Pyr), 100x PenStrep. Cells were maintained at 37°C in 5% CO2.
Gene knock down using small interfering RNA (siRNA).
In P19Cl6 siRNA transfection, cells were plated at 5.0x10⁵ per well in six-well plates and transfected with a pool of Silencer Select Pre-Designed Tbx1 siRNA (pool of s74767, s74768 and s74769, Life Technology) in antibiotic-free medium using Lipofectamine RNA iMAX Reagent (Life Technology) according to the instructions. In ATAC-seq experiment, 42 hours after siRNA, using in the same time a siRNA control, cells were harvested and processed. In time course experiments, 13 hours after siRNA, using in the same time a siRNA control, cells were harvested and processed.
26 In C2C12 siRNA transfection, cells were plated at 1.2x10⁵ per well in
six-well plates and transfected with a pool of Silencer Select Pre-Designed Tbx1 siRNA (pool of s74767 and s74769, Life Technology) in antibiotic-free medium using Lipofectamine RNA iMAX Reagent (Life Technology) according to the manufacturer’s instructions. 48 hours after siRNA, using in the same time a siRNA control, cells were harvested and processed for further analyses.
27 In vitro differentiation
P19Cl6
P19Cl6 cells differentiate into beating cardiomyocytes in adherent conditions when treated with 1% DMSO.
The protocol used for this cells was established in the lab, and consists in plating about 500.000 cells in a 35-mm dish. Next day, when the cells are confluent, it was added 10uM 5-Azacytidine (5-Aza) to induce differentiation. After 24h, it was added a fresh medium containing DMSO 1 %. For time course experiment for both loss and gain of function, cells were collected at T1 (13 hr after Transfection), at D1 (24 hr after 5-Aza induction) and at Day2 (24 hr after DMSO adding).
mESCs
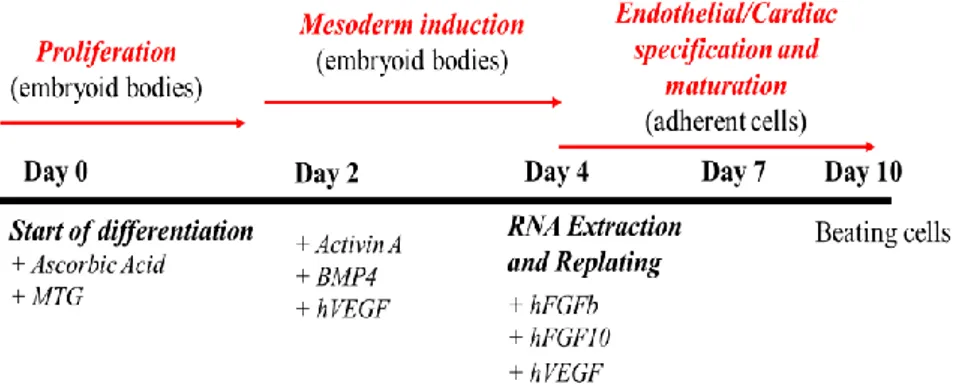
mESCs differentiate into the cardiac lineage using a protocol established in Dr. Keller’s laboratory (Keller G 2005). This protocol generates, starting from undifferentiated embryonic stem cells, cardiac precursor (CP) and cardiomyocytes (CM). mESCs were maintained at Day 0 using leukemia inhibitory factor (LIF, 106 units/ml) when the cells were stimulated to proliferate as embryonic bodies by adding ascorbic acid (5 mg/mL) and monotioglycerol (MTG, dilution from 1.25 g/mL). At day 2, the differentiation can start by adding general growth factor: activin A (10 ng/µL), bone morphogenetic factor (BMP4, 10 ng/µL), vascular endothelial growth factor (VEGF 5 ng/µL) while at day 4 starts the specification and maturation of cardiomyocytes by plating cells on gelatin coat with fibroblast growth factors (FGFb, 10 ng/µL; FGF10, 50 ng/µL) and VEGF (5 ng/µL), therefore day 4 cells encompass cardiac precursor markers. At day 10, cells become beating cardiomyocytes. The Fig. 6 illustrates the differentiation scheme.
28 Fig. 6
Figure 6. murine Embryonic Stem Cells (mESCs) differentiation. Three different phases that mESCs need to differentiate into beating cardiomyocytes: Proliferation, Mesoderm induction, Endothelial/Cardiac specification and maturation (Keller G 2005).
mESCs, differentiated at day 4, sorted for PDGFRa were isolated through flow cytometry. Tbx1-KO cells were generated in the lab using CRISPR-Cas9 technology (Clustered regularly interspaced short palindromic repeats).
29 2. Molecular Biology procedures
RNA-seq
Cells in dishes were washed with PBS cold and then 1 mL of Trizol was added directly on a single dish. Lysate was then harvested and vortexed in order to promote lysis of cells. Then, 200 µl of chloroform was added to 1 mL in order to separate three distinct phases: upper phases (where we can find RNA), intermediated phases (where we can find DNA) and lower phases (where we can find proteins and other cells-derived). The mixture was centrifuged at 12000g for 15 min. The top (aqueous) phase was removed and transferred into a new tube in which was added 500 µl of isopropanol and the solution was incubated for 20 min at room temperature (RT). After 20 min, solution was centrifuged for 10 min at 12000g. Pellet (RNA) was washed two times with Ethanol 80% and centrifuged for 5 min at 7500 g. Pellet was resuspended in a fresh water and then processed for further analyses. The concentration was estimated with Nanodrop. All samples were run on agarose gel and all three different RNA fragments (28S, 18S and 5S) were distinguished. After quality/quantity check RNA samples were used for libraries preparation with the Illumina’s strand specific RNA seq protocol, barcoded and pooled in one lane. The raw data for sequencing of cDNA were generated with Illumina platform (NextSeq 500) for paired-end reads of length 75bp.
30 Assay for Transposase-Accessible Chromatin (ATAC-seq) and
quantitative ATAC (Q-ATAC)
This new method, developed by Buenrostro et al., 2015 is now widely used for mapping chromatin accessibility genome-wide. This technique uses Tn5 transposase which is able, when the chromatin is open, to insert sequencing adapters into accessible regions of chromatin. More in details, Tn5 is a prokaryotic transposase, which endogenously functions through the “cut and paste” mechanism, requiring sequence-specific excision of a locus containing 19 bp inverted repeats. The Fig. 7 is a schematic representation of the technique.
Fig. 7
Figure 7. ATAC-seq schematic pipeline. Tn5 transposase (orange) insert sequencing adapters (green and red) in chromatin accessible regions. Open chromatin (violet) can be isolated, amplified and then sequenced (Buenrostro J et al., 2015).
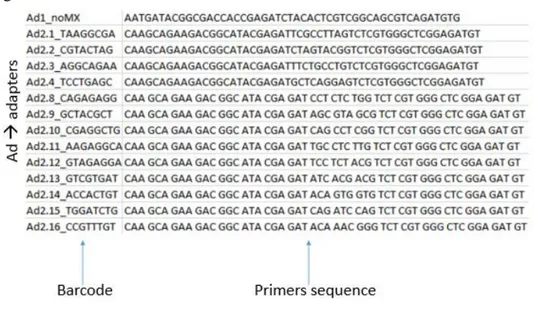
Sequencing adapters, associated to open chromatin regions, can be amplified and then sequenced. Sequencing adapters associated with regions of increased accessibility were recognized by Customer Nextera PCR Primer 1 and Custom Nextera PCR primer 2 which contains barcode necessary for sample pooling. A complete list of primers is illustrated in the figure 8.
31 Fig. 8
Figure 8. Custom Nextera PCR Primers. PCR primers are used to amplify fragment of opened chromatin. Primer 1 does not contain barcode while Primer 2 contains barcode necessary for sample pooling (Buenrostro J et al., 2015).
It is possible to map regions of transcription factor binding and nucleosome position. ATAC-seq has replaced DNase-seq for open chromatin regions and MNase-seq for assaying nucleosome position because it is fast and sensitive. A critical point of this new technique is cells number: in general, too few cells causes over-digestion of chromatin and appears to create a larger fraction of reads that map to inaccessible regions of the genome; using too many cells may cause under-digestion and creates high molecular weight fragments, which certainly is difficult to sequence. Cells were harvested and they absolutely must not be fixed, intact cells in a homogenous suspension tend to give the best results. In order to determine the quantification of DNA obtained is not recommended Qubit analysis but we have used Tapestation, automated sample processing for quality control of Next Generation Sequencing and microarray data.
For sequencing was used NextSeq 500, based on Illumina protocol, 60bp each reads in paired-end, MID flowcell, 240.000.000 total reads.
ATAC-seq was optimized in about three hours: 30 minutes for nuclei extraction, 45 minutes for transposition and purification, 1 hour and 45 minutes for PCR and purification and the remaining time for quantification analysis. More in details there are 4 main areas in which the protocol can be divided. The first one is cell preparation: we have used 50.000 cells for P19Cl6 cells and 12500 cells for mESCs. After washes in PBS, cells were suspended in 50 µL of cold lysis buffer (10mM Tris-HCl, pH 7.4, 10mM
32 NaCl, 3mM MgCl2, 0.1% IGEPAL CA-630) and immediately spin down at 500 x g for 10 min at 4 °C. The second part consists of Transposition mix and Purification, the nuclei were incubated at 37 °C in Transposition Reaction Mix (25 µL reaction buffer, 2.5 µL of Transposase, 22.5 µL Nuclease free water), purified using Qiagen MinElute PCR Purification Kit and eluted in 10 µL of Nuclease Free water. The Third part consists of PCR amplification of 10 µL Tagmented DNA with 2.5 µL of PCR primer without barcode, 2.5 µL of specific barcode PCR primer, 10 µL Nuclease free water and 25 µL NEBNext High-Fidelity 2x PCR Master Mix. The PCR cycles are: 1 cycle of 72°C for 5 min (critical to allow extension of both ends of the primer after transposition), 4 cycle of 98 °C for 10 secs, 63 °C for 30 secs and 72°C for 1 min. In order to reduce GC and size bias in PCR, the appropriate number of PCR was calculated through real-time to stop amplification prior to saturation (Buenrostro J et al., 2013). The last part consists of assessing the quality/quantity of DNA purified which represent the regions of accessible chromatin.
ATAC can be also associated to a screening, through real-time, of different loci in order to estimate how chromatin accessibility changes. This technique is called quantitative ATAC (Q-ATAC). In this work, Q-ATAC has done on a set of loci during loss and gain of function time-course experiments.
33 Chromatin Immunoprecipitation (ChIP) and quantitative ChIP C2C12 cells were cross-linked with 1% formaldehyde for 15 min at room temperature and glycine was added to stop the reaction to a final concentration of 0.125 M for 5 min. The cell pellet was suspended in 6 x volumes of cell lysis buffer (10 mM HEPES, 60 mM KCl, 1 mM EDTA, 0.075% v/v NP40, 1 mM DTT and 1X protease inhibitors, adjusted to pH 7.6) in a 1.5 mL tube incubating on ice for 15 min. Isolated nuclei were suspended in Buffer B of LowCell ChIP Kit reagent and chromatin was sonicated into 200-500 bp long fragment using the Covaris S2 Sample Preparation System (Duty Cycle: 5%, Cycles: 5, Intensity: 3, Bath temperature: 4 °C. Cycles per Burst: 200, Power mode: Frequency Sweeping, Cycle Time: 60 seconds, Degassing mode: Continuous). After sonication, chromatin was diluted in Buffer A, according with LowCell Kit in order to make a SDS-dilution (SDS-high concentration may interfere between antibody and protein interaction). Chromatin was incubated with anti H3K27Ac (Abcam, ab4729), or normal rabbit IgG (Santa Cruz Biotechnology, 2027). Next, steps included extensive washes and reverse crosslinking following the same kit previously described. For quantitative ChIP, I performed real-time PCR of the immunoprecipitated DNA and inputs, using the FastStart Universal SYBR Green Master kit (Roche) on System or Step-one plus (Applied Biosystems) using primers specific for the AHF-enhancer region of Mef2c.
Forward primer: TGAGGAGGGAGCTGCAGTAT Reverse primer: CCGTTTCTCTATCCCAACCA
The experiment was performed two different Tbx1 dosages (Control and
Tbx1-KD). The H3K27Ac around AHF-enhancer region was calculated on
1% of input (sonicated and purified chromatin). Results are the mean of two biological replicates (error bars indicate s.e.m.).
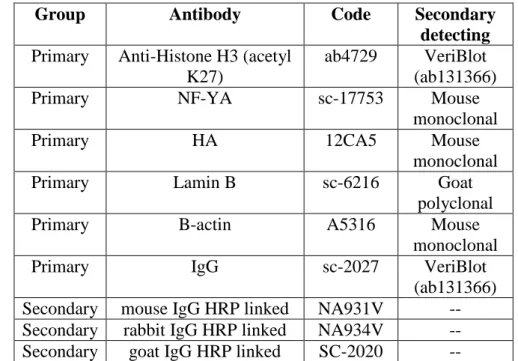
34 Antibodies
All antibodies used for this Ph.D. project are listed in the Table 2. Table 2
Group Antibody Code Secondary
detecting Primary Anti-Histone H3 (acetyl
K27)
ab4729 VeriBlot
(ab131366)
Primary NF-YA sc-17753 Mouse
monoclonal
Primary HA 12CA5 Mouse
monoclonal
Primary Lamin B sc-6216 Goat
polyclonal
Primary B-actin A5316 Mouse
monoclonal
Primary IgG sc-2027 VeriBlot
(ab131366)
Secondary mouse IgG HRP linked NA931V --
Secondary rabbit IgG HRP linked NA934V --
Secondary goat IgG HRP linked SC-2020 --
Table 2. Antibody list used in this work. The table is divided in Group, Antibody, Code and Secondary detecting.
35 3. Bioinformatics analyses
RNA-seq
Two biological replicates were sequenced for each sample. For each replicate, we have used about 2.0 × 10⁷, each read about 150bp long. Reads obtained were mapped to the mouse genome (mm9) using TopHAt2 (Trapnell C et al., 2009). All other parameters were used as default. The reference annotation, Mus_musculus.NCBIM37.67.gtf, was downloaded from ensemble database (http://www.ensemble.org). Gene expression levels were estimated for each sample in term of Fragment Per Kilo base of exon model per Million mapped reads (FPKM) using Cufflinks (Trapnell C et al., 2012). I selected only protein coding genes, all other proteins were masked from our analysis and for each gene we tested the significance of 95% confidence interval. For counting reads, I have used HT-seq (Anders S et al., 2015) for gene count matrix and in order to pre-process RNA-seq data for differential expression analysis by counting the overlap of reads with genes. Then from this point I moved for further analysis with a graphical user interface (GUI) for the identification of differentially expressed genes across multiple biological condition, RNA-seqGUI (Russo F et al., 2014). This R package includes some well-known tools always used in the RNA-seq pipeline. All counted reads were normalized and for all data were plotted HeatMap Profiles and Principal Component Analysis (PCA) to establish the reproducibility in all experiments. At least, differentially expressed (DE) genes were estimated using DeSeq2 (Love MI et al., 2014) using default parameters. Gene with adjusted P-values < 0.05 were considered DE.
36 ATAC-seq
Although ATAC-seq is being adopted in many laboratories because is fast and sensitive, in literature there are no available pipelines. A new pipeline was developed in the lab in order to analyse these kind of data. First of all, each sample was sequenced in paired-end, 60 bp reads long. Quality check control on the raw sequencing data was made using FastaQC with different parameters: 1) Per base quality means how is it correct the position of each nucleotide in a read. This parameter is measured through a scale (0 is worst, 36 is excellent); 2) GC content means how results, in the GC context, overlap with hypothetical distribution; 3) Per base N content means how many undefined nucleotides are calling; 4) Duplication levels means how many redundant reads are generated by PCR; 5) Adapter content means which is the percentage of adapters in selected reads.
Reads were aligned using Bowtie2 (Langmead B et al., 2012). Bowtie2 is a tool for aligning sequencing reads to long reference sequences and it is used for reads of about 50 up to 100s or 1000s of characters. Analysis were performed using bash command from LINUX operative system and the output file was in Sam format.
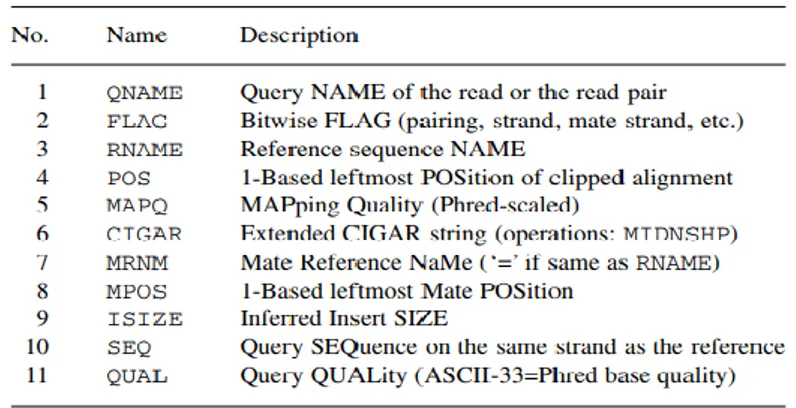
The Sam file stands for Sequence Alignment/Map format and it is a Tab-delimited text format divided into two parts: the first one includes header and second one which has details about alignment, for example mapping position. A detailed example of Sam field output alignment is illustrated in the figure 9 (Li H et al., 2009).
Fig.9
Figure 9. Sam output structure. Detailed field in Sam file are QNAME, FLAG, RNAME, POS, MAPQ, CIGAR, MRNM, MPOS, ISIZE, SEQ, QUAL (Li H et al., 2009).
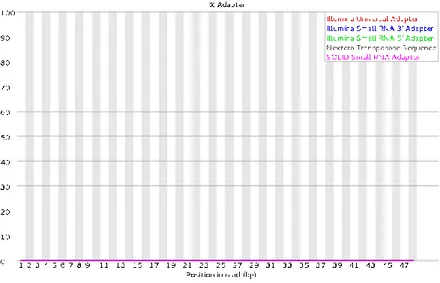
37 FASTQC report, for all samples in our sequencing has found a short contamination around 33-35 bp to 47 bp of Nextera transposase sequence (black curve), figure 10.
Fig. 10
Figure 10. Adapter contamination in raw reads. On X-axis there is the position (bp), on Y-axis the reads percentage. It is clearly visible Nextera Transposase Sequence contamination between 33-35 and 47 bp (black curve).
Nextera Transposase Sequence were removed in order to increase the alignment rate output. The “contaminations” sequences were CTGTCTCTTATACACATCTCCGAGCCCACGAGAC which is the reverse complement of the Nextera transposase sequence attached to read 2 and CTGTCTCTTATACACATCTGACGCTGCCGACGA which is the reverse complement of the Nextera transposase sequence attached to read 1 (Turner FS et al., 2014). Cutadapt was used to remove the Nextera transposase sequences. This algorithm is largely used in bioinformatics analysis, it searches and cut off specific sequence independent from its localization (Martin M 2011). Reads without Nextera transposase sequences are illustrated in the figure 11.
38 Fig. 11
Figure 11. Contamination free in raw reads. On X-axis there is the position (bp), on Y-axis the reads percentage. Nextera Transposase Sequence was completely removed.
Once files in Sam format with uncontaminated reads were obtained, they were converted into Bam files and then in Bed files. Bam file is the compressed binary version of a Sam file that is used to represent aligned sequences. It is divided into Header which contains general information: sample name and length, the alignment method, start/end position, alignment quality and the match descriptor string. Furthermore, the alignment section includes the following information: RG (number of reads for specific sample), BC (indicate demultiplexed sample ID associated with the read), SM (single-end alignment quality), AS (paired end alignment quality), NM (Edit distance tag), XN (Amplicon name tag) (Li H. et al., 2009).
Bed format stand for Browser Extensible Data and it can be defined as a flexible way to represent genomic coordinates in a very sample manner. In Bed file there are different parameters: chromosome (the name of the chromosome on which the genomic feature exists), start (the zero-based starting position of the features in the chromosome), end (the one-based ending position of the feature in the chromosome). Then there are other optional columns, for example: name (the name of the Bed feature), score (Bed score range between 0 to 1000), strand (defines the strand “+” or “–”) (Quinlan AR et al., 2010). From file Bed, R1 and R2 reads (sequencing was made in paired-end mode) were isolated using “grep” as bash command and then sorted using bedtools. Starting from Bed files, it was calculated files which contain all genomic coordinates without PCR duplicates. Last problem in ATAC-seq technique was linked to mitochondrial reads (M) that can strongly reduce number of reads. There is one literature study which explain
39 a possible method to reduce mitochondrial reads using CRISPR-CAS9. Researchers, through CRISPR, were able to reduce mitochondrial noise from samples by 1.5 to 3 fold (Montefiori L et al., 2017). Mitochondrial reads were counted and removed from files and used for genome coverage and at least they were uploaded on UCSC Genome Browser.
The last bioinformatics analysis was peak calling, which quantify how many open regions (peaks) were there in a specific sample. The algorithm used is MACS2 (Model-Based Analysis of seq), has been optimized for ChIP-seq and DNase-ChIP-seq data but it is largely used in the ATAC-ChIP-seq work (Feng J et al., 2012). This tool identifies statistically enriched genomic regions. By default, it is able to calculate also PCR duplicates by removing them and calculates also a p-value for each peak using a dynamic Poisson distribution to capture local bias in read background levels. In ATAC-seq, due to absence of input sample, MACS2 measures the total genome-wide coverage background in order to estimate enriched accessible regions. The bash command used was: /share/apps/MACS2-2.1.1/bin/macs2 callpeak -t file_input.bed -f BED -g mm -n file_output.bed -nomodel --shif100 --extsize 200. /share/apps/MACS2-2.1.1/bin/ represents the directory path in which MACS is located; macs2 was the version used; -t recalls the input file; -f specifies the file input type; -g is the animal genome (mm9 in our analyses); shift and extsize represent some advanced parameters which consider the Tn5 transposase cut site.
40 Real-time PCR, statistical analysis
Real-time polymerase chain reaction, also known as quantitative real time polymerase chain reaction (qPCR) or kinetic polymerase chain reaction, is a molecular technique based on PCR, which is used to amplify and quantify a targeted DNA molecule. It enables both detection and quantification (as absolute number of copies or relative amount when normalized to DNA input or additional normalizing genes) of a specific sequence in a DNA sample. RNA was extracted from cells using Trizol reagent (explained in more details in the session “RNA-seq”). Before reverse transcription, RNA samples were treated with DNAse I. Contamination with genomic DNA (located in the interphase during trizol extraction) was identified by including “no RT/RT
-controls”. cDNA was retro-transcribed from 1 to 2 µg of RNA. All samples were run in duplicates in 15 µL reaction volume. The run used was similar to PCR default condition but the number of cycles is increases up to 45 cycles. The cycle threshold (Ct) was determined during geometric phase of the PCR amplification plots, as illustrated in the manufacturer. Relative differences in transcript levels were quantified using the ΔΔCt method and normalized to
Gapdh and Rpl13a expression references. The Tbx1 primers were:
Forward: 5'-CTGACCAATAACCTGCTGGATGA-3' Reverse: 5'- GGCTGATATCTGtGCATGGAGTT-3'
For time-course experiments with loss of function (LoF) and gain of function (GoF) they were set different statistical parameter in order to understand if there are chromatin accessible variations between control and treated samples on some specific loci (Q-ATAC). It was calculated 2- ΔCt by considering the
differences between Ct of sample and Ct of endogenous control. It was added, as internal control, the DNA extracted from the same undifferentiated cell lines (P19Cl6) in order to minimize the differences in primers annealing efficiency.
Biological duplicates were considered and for each sample it was measured the standard deviations and error standard in order to assess whether each locus has or not variations in chromatin accessibility between samples. Negative control was used to establish the threshold of opened/closed chromatin. Primers were designed in a region that does not contain genes for about 80 kb. The Ct signal of this genomic window was set as the threshold: trend above threshold has indicated as “open chromatin”; in contrast, trend below threshold has indicated as “closed chromatin”.
41
RESULTS
Chapter 1
TBX1 controls histone acetylation at the Mef2c-Anterior Heart Field
(AHF) locus.
TBX1, in P19Cl6 cells, tends to coincide with H3K27Ac-poor regions (Fulcoli FG et al., 2016). In order to explain why TBX1 tends to bind hypo-acetylated regions, the mechanism remains unknown. TBX1 binds to and represses Mef2c expression (Pane LS et al., 2012), therefore, we used this gene as a model to understand mechanisms of gene regulation. TBX1 binds the so called “anterior heart field” (AHF) enhancer of Mef2c gene. To understand if this enhancer could be differentially acetylated following by
Tbx1 dosage variation, we performed a Chromatin Immunoprecipitation
(ChIP) with anti H3K27Ac antibody on undifferentiated C2C12 cells (see Materials and Methods paragraph for further informations) with and without
Tbx1 knock down using transfection with siRNA pool (Fig. 12).
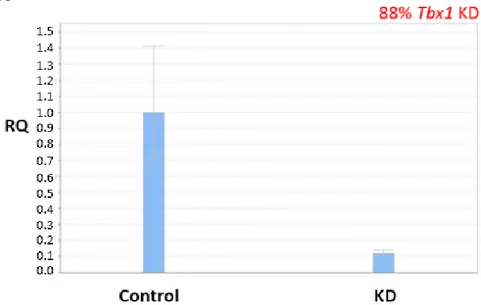
Fig. 12
Figure 12. Tbx1-KD in C2C12 cells. Tbx1 (239bp) was knocked down in C2C12 cells on three different biological replicates (Tbx1-KD_1, Tbx1-KD_2, Tbx1-KD_3) compared to control (Control_1, Control_2, Control_3). Gapdh (106bp) was used as control.
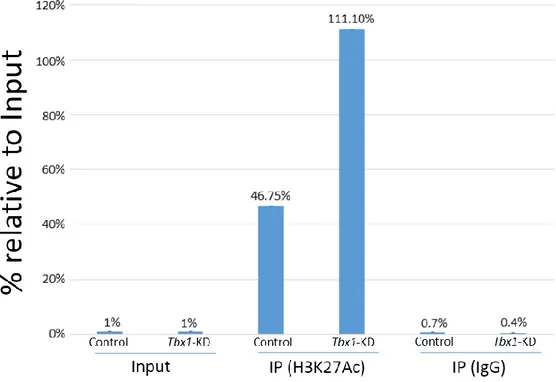
I have chosen the first and second replicate because the transfection was better than third biological replicate and then it was performed ChIP with H3K27Ac followed by real-time PCR on AHF enhancer. I found that C2C12 with low level of Tbx1 have a significant increase of H3K27Ac enrichment at the Mef2c-AHF enhancer compared to Control (Fig. 13) suggesting that TBX1 is able to maintain H3K27Ac enrichment low. The H3K27Ac
42 enrichment of Mef2c-AHF has been calculated on two biological duplicates and immunoprecipitation (expressed in percentage) was based on 1% DNA input from the same cell line. Colleagues in the lab have tested whether TBX1 interacts with HDAC1 or HDAC2, but with negative results. Thus, decreased dosage of TBX1 is associated with increased H3K27Ac, but the mechanism by which low acetylation is maintained by TBX1 is probably indirect. These results have been included in a publication (Pane LS et al., 2018). Future experiments will explore the relationship between TBX1 dosage and H3K27Ac genome-wide using ChIP-seq.
Fig. 13
Figure 13. TBX1 and H3K27Ac enrichment at Mef2c-AHF enhancer in C2C12 cells. Histogram showing the results of Q-ChIP analyses using anti H3K27Ac antibodies on C2C12 cells treated with non-targeting siRNA (Control) or with Tbx1-targeted siRNA (Tbx1-KD) on Mef2c-AHF locus. Enrichment is shown as percentage of input. Results are the mean of two biological replicates (error bars indicate s.e.m.).