Classe di Scienze
PhD Thesis
A B I O P H Y S I C A L A P P R O A C H T O T H E S T U D Y
O F L I V I N G β - C E L L S
Candidate:
Gianmarco Ferri
Supervisor:
Prof. F. Cardarelli
2019
/2020
C O N T E N T S
List of Figures vi
List of Tables viii
Nomenclature xiii
Foreword: a global emergency targeted...at the nanoscale 1
1 β-cell function: the need for new biophysical ap-p r oa c h e s 5
1.1 At the center of stage: the β-cell. 5
1.1.1 Inside the β-cell: insulin maturation steps. 7
1.1.2 The insulin secretory granule: more than merely a
container. 9
1.2 From structure to function. 9
1.2.1 Step-1: a cascade of metabolic reactions transforms glucose in a trigger signal. 12
1.2.2 Step-2: ISGs mobilization and exocytosis. 12
1.3 Approaching the β-cell by quantitative biophysics. 14
1.3.1 Metabolic imaging of β-cells in physiology and dis-ease: a new label-free paradigm. 14
1.3.2 Spatiotemporal fluctuation spectroscopy as a fast and robust screening method to study granule structural and dynamic properties. 16
2 p h a s o r f l i m a na ly s i s o f β-cell metabolic response. 21
2.1 Imaging of NAD(P)H autofluorescence. 21
2.2 Phasor-FLIM approach to NAD(P)H-based metabolic
finger-print. 23
2.3 Experimental model of β-cells. 27
2.4 The β-cell metabolic status. 28
2.4.1 Preliminary fluorescence intensity analysis of NAD(P)H species in INS-1E cells. 28
2.4.2 FLIM analysis of NAD(P)H species in INS-1E cells in response to glucose stimulation. 30
2.4.3 The characteristic metabolic signature of the β-cells. 31
2.5 Effect of β-cell exposure to chronic hyperglycemic
condi-tions. 34
iv c o n t e n t s
2.5.1 Reduced response to glucose stimulation under hy-perglycemic conditions correlates with production of intracellular oxidative stress. 35
2.6 Concluding remarks 35
3 i m s d a na ly s i s o f f l u o r e s c e n t ly-labelled insulin gran-u l e s. 41
3.1 Fluorescence correlation spectroscopy techniques. 42
3.2 The iMSD approach. 43
3.2.1 iMSD extracted parameters. 43
3.2.2 Application of iMSD: from molecules to proteins, from nanoparticles to organelles. 46
3.3 Application of iMSD to insulin secretory granules. 46
3.3.1 Workflow of the experiment. 47
3.3.2 The importance of temporal resolution and pixel size. 49
3.4 The iMSD-based ISG structural-dynamic fingerprint. 51
3.5 Fingerprint validation. 55
3.5.1 Validation of iMSD by standard SPT analysis. 55
3.5.2 Validation of iMSD-derived granule size by TEM. 58
3.5.3 Functional validation of iMSD-derived parameters: glucose stimulation. 59
3.5.4 Functional validation of iMSD-derived parameters: cholesterol overloading. 60
3.6 Concluding Remarks. 62
4 e f f e c t o f f l u o r e s c e n c e l a b e l l i n g o n g r a n u l e p r o p e r -t i e s. 63
4.1 Proteins used as molecular markers of ISGs. 64
4.1.1 IAPP. 64
4.1.2 Syncollin. 64
4.1.3 Phogrin. 65
4.2 iMSD based approach to compare ISGs’ labelling
strate-gies. 65
4.3 Phogrin overexpression effect: possible explanations. 72
4.4 Which future for label-free imaging of ISGs in living
mat-ter? 76
4.4.1 Comparison between the light scattering properties of ISGs and lysosomes. 77
c o n t e n t s v
5 t o wa r d s m u lt i p l e x e d b i o p h y s i c a l a na ly s e s i n t h e l i v -i n g -i s l e t. 83
5.1 Phasor-FLIM analysis on HIs. 84
5.1.1 Characterization of autofluorescence signal and life-time in isolated human pancreatic islets. 84
5.2 Structural-dynamic fingerprint of ISGs in dispersed HI cells. 87
5.3 Concluding Remarks. 90
a m at e r i a l s a n d m e t h o d s 93
a.1 Cell cultures. 93
a.2 Transfections and plasmids. 93
a.3 Human pancreatic islets cells. 94
a.4 Cellular staining. 95
a.5 Drugs treatments. 95
a.6 Insulin secretion assay. 95
a.7 Fluorescerce confocal microscopy. 95
a.8 iMSD analysis. 96
a.9 Cluster similarity analysis. 97
a.10 Fluorescence-based expression level analysis. 99
a.11 Trajectory analysis. 99
a.12 Granule morphometric analysis from TEM micrographs. 99
a.13 Two-photon microscopy and phasor-FLIM measurements. 100
a.14 Data analysis on FLIM data. 100
a.15 Cross-STICS analysis. 101
b imsd plot: y-axis intercept and object size 103
b.1 Instrumental waist. 103
b.2 Intercept of the iMSD curve. 103
b.3 Contribrution of the particle size. 104
L I S T O F F I G U R E S
Figure 1.1 Schematic representation of islet and pancreas cell
types 6
Figure 1.2 Insulin maturation steps 8
Figure 1.3 The insulin secretory granule 10
Figure 1.4 β-cell functions 11
Figure 1.5 Granules’ pools and biphasic insulin secretion 13
Figure 1.6 ISGs mobilization 15
Figure 1.7 Experimental approaches 18
Figure 2.1 Cellular autofluorescence spectra 22
Figure 2.2 Scheme of NAD(H) fractions upon metabolic changes 24
Figure 2.3 Phasor plot principles 25
Figure 2.4 Phasor-FLIM measurement on a NADH solution 26
Figure 2.5 Autofluorescence intensity analysis 29
Figure 2.6 NAD(P)H intensity and insulin secretion 30
Figure 2.7 Phasor-FLIM analysis 32
Figure 2.8 Segmentation analysis on INS-1E cells upon glucose stimulation 33
Figure 2.9 Phasor coordinates shift in different cell lines 34
Figure 2.10 Phasor FLIM analysis on hyperglycemic culturing
condition 36
Figure 2.11 Segmentation analysis on INS-1E cells pre-incubated in hyperglycemic conditions 37
Figure 2.12 LSS species as oxidative stress signature induced by
hyperglycemia 38
Figure 2.13 Model for coupling of glucose metabolism to insulin secretion 40
Figure 3.1 FCS principle 42
Figure 3.2 iMSD workflow 45
Figure 3.3 From time-lapse imaging to the iMSD of ISGs in living cells 48
Figure 3.4 Bleaching profile 49
Figure 3.5 DMdepending on the analyzed time window 50
Figure 3.6 Impact of scan speed on iMSD extracted size 52
Figure 3.7 From single iMSD traces to whole-cell-population
analysis 53
Figure 3.8 C-peptide-EGFP labelled ISGs fingerprint 54
Figure 3.9 Example of typical acquisition of transfected ISGs 57
Figure 3.10 Impact of high mobility and brighter granules on iMSD analysis 58
Figure 3.11 TEM micograph of ISGs 59
Figure 3.12 Effect of glucose stimulation on ISG fingerprint 60
Figure 3.13 Effect of cholesterol overload on ISG fingerprint 61
Figure 4.1 iMSD derived parameters of IAPP-FP and Syncollin-FP labelled ISGs 66
Figure 4.2 Fingerprints of IAPP-FP and Syncollin-FP labelled
ISGs 67
Figure 4.3 iMSD derived parameters of phogrin-FP labelled
ISGs 69
Figure 4.4 Fingerprints of phogrin-FP labelled ISGss 70
Figure 4.5 fingerprint of cotrasfected cells 71
Figure 4.6 Fluorescence expression level analysis of stably trans-fected cells 72
Figure 4.7 Actin cytoskeleton 73
Figure 4.8 Fingerprint of Latrunculin-B treated C-peptide-EGFP
ISGs 74
Figure 4.9 Insulin secretion analysis 76
Figure 4.10 Backscattering analysis 77
Figure 4.11 Cross-correlation analysis 79
Figure 4.12 Amino acidic stucture of insulin 80
Figure 5.1 Phasor FLIM analysis on HIs 85
Figure 5.2 Emission spectra of autofluorescence species 86
Figure 5.3 Phasor FLIM analysis on lipofuscin contribution 88
Figure 5.4 iMSD-based screening of ISGs in dispersed human
β-cells 89
Figure B.1 PSF profiles 104
Figure B.2 Gaussian fitting and PSF profiles 105
viii l i s t o f ta b l e s
L I S T O F TA B L E S
Table 3.1 Summary of iMSD-derived parameters 55
Table 4.1 Summary of iMSD-derived parameters for chimeric FP used to labelled ISGs 66
Table 4.2 Summary of iMSD-derived parameters for Latrunculin-B treated cells 75
Table 4.3 Optical properties of the principal fluorescent amino
acids 81
L I S T O F P U B L I C AT I O N S
Articles in peer-reviewed journals included in this Thesis:
1. Ferri, G, Digiacomo, L., D’Autilia, F., Durso, W., Caracciolo, G. & Cardarelli, F. Time-lapse confocal imaging datasets to assess structural and dynamic properties of subcellular nanostructures. eng. Scientific Data 5, 180191 (2018).
2. Ferri, G, Bugliani, M., Marchetti, P. & Cardarelli, F. Probing the light scattering properties of insulin secretory granules in single live cells. Biochemical and Biophysical Research Communications 503, 2710 (2018). 3. Ferri, G, Digiacomo, L., Lavagnino, Z., Occhipinti, M., Bugliani, M.,
Cappello, V., Caracciolo, G., Marchetti, P., Piston, D. W. & Cardarelli, F. Insulin secretory granules labelled with phogrin-fluorescent proteins show alterations in size, mobility and responsiveness to glucose stimulation in living β-cells. Scientific Reports 9 (2019).
4. Ferri, G, Tesi, M., Massarelli, F., Marselli, L., Marchetti, P. & Cardarelli, F. Metabolic response of Insulinoma 1E cells to glucose stimulation studied by fluorescence lifetime imaging. accepted by Faseb BioAdvances (2020).
Articles not included in this Thesis:
1. Palchetti, S., Digiacomo, L., Giulimondi, F., Pozzi, D., Peruzzi, G.,
Ferri, G, Amenitsch, H., Cardarelli, F., Mahmoudi, M. & Caracciolo, G. A mechanistic explanation of the inhibitory role of the protein corona on liposomal gene expression. Biochimica et Biophysica Acta (BBA) - Biomembranes 1862, 183159 (2020).
2. Quagliarini, Di Santo, Palchetti, Ferri, G, Cardarelli, Pozzi & Caracci-olo. Effect of Protein Corona on The Transfection Efficiency of Lipid-Coated Graphene Oxide-Based Cell Transfection Reagents. Pharma-ceutics 10, 11 (2020).
x List of publications
3. Moliterni, A., Altamura, D., Lassandro, R., Olieric, V., Ferri, G, Car-darelli, F., Camposeo, A., Pisignano, D., Anthony, J. & Giannini, C. Synthesis, crystal structure, polymorphism and microscopic lu-minescence properties of anthracene derivative compounds. Acta Crystallographica Section B: Structural Science, Crystal Engineering and Materials 2, 15 (2020).
Conference contributions:
5. Ferri, G. Probing nucleocytoplasmic transport impairment upon defective nuclear lamina assembly. in Oral presentation Sept. 8–11, 2013 (Methods and Application in Fluorescence MAF, Genova, Italy).
6. Ferri, G. Probing the dynamic fingerprint of insulin secretory granules in living cells by spatiotemporal fluctuation spectroscopy. in Poster May 18– 19, 2017 (Biophysics @ Rome, Rome, Italy).
7. Ferri, G. Probing the dynamic fingerprint of insulin secretory granules in living β-cells by spatiotemporal fluctuation spectroscopy. in Oral presen-tation Oct. 1–5, 2018 (EASD, European Association for the Study of Diabetes., Berlin, Germany).
8. Ferri, G. Effects of GLP-1R agonists on beta cell survival, function and granule motility. in Oral presentation Sept. 16–19, 2019 (EASD, European Association for the Study of Diabetes., Barcelona, Spain).
9. Ferri, G. 2nd Practical Workshop on Advanced Microscopy. in Workshop Dec. 1–4, 2015 (Nikon Center, IIT, Genova, Italy).
10. Ferri, G. Corso di orientamento federato SNS, IUSS, Sant’Anna in Semi-nario July 4, 2018 (Orientamento, San Miniato, Italy).
11. Ferri, G. Probing the dynamic fingerprint of insulin secretory granules in living cells by spatiotemporal fluctuation spectroscopy. in Poster May 6–8, 2019(Quantitative Aspects of Membrane Fusion and Fission, Padova, Italy).
12. Ferri, G. Screening delle proprietà strutturali e dinamiche del granulo di insulina in cellule vive in Poster May 16–19, 2018 (Congresso nazionale SID, Società italiana di Diabetologia, Rimini, Italy).
13. Ferri, G. Microscopia ottica non invasiva rivela la traiettoria metabolica di cellule INS-1E stimolate con glucosio in Poster Dec. 1–5, 2020 (Congresso nazionale SID, Società italiana di Diabetologia, Rimini, Italy).
xi
14. Ferri, G. Phasor-FLIM analysis of β-cell metabolic trajectory upon glucose stimulation in Submitted Sept. 21–25, 2020 (EASD, European Associa-tion for the Study of Diabetes., Wien, Austria).
N O M E N C L AT U R E
ATP/ADP Adenosine triphosphate/Adeno-sine biphosphate; a complex organic chemical that provides energy to drive many processes in living cells
CHO Chinese hamster ovary (CHO) cells; an epithelial cell line de-rived from the ovary of the Chi-nese hamster, often used in bi-ological and medical research and commercially in the produc-tion of therapeutic proteins DMSO dimethyl sulfoxide; organic
sol-vent, readily passes through skin, cryoprotectant in cell cul-ture
ELISA Enzyme-linked immunosorbent assay; an assay to detect the presence of a ligand (commonly a protein) in a liquid sample us-ing antibodies directed against the protein to be measured ER Endoplasmatic reticulum; a type
of organelle found in eukary-otic cells that forms an in-terconnected network of flat-tened, membrane-enclosed sacs or tube-like structures known as cisternae
FCS Fluorescence Correlation Spec-troscopy; a correlation analy-sis of fluctuation of the fluores-cence intensity. The analysis pro-vides parameters of the physics under the fluctuations. One of the interesting applications of this is an analysis of the con-centration fluctuations of fluo-rescent particles (molecules) in solution
FLIM Fluorescence lifetime imaging microscopy; an imaging tech-nique for producing an image based on the differences in the exponential decay rate of the fluorescence from a fluorescent sample. It can be used as an imaging technique in confocal microscopy, two-photon excita-tion microscopy, and multipho-ton tomography.
FP Fluorescent protein; a protein that exhibits bright fluorescence when exposed to visible light FWHM Full widht half maximum; an
expression of the extent of func-tion given by the difference be-tween the two extreme values of the independent variable at which the dependent variable is equal to half of its maximum value
GSIS Glucose stimulated insulin se-cretion; secretion of insulin from pancreatic β-cells mediated by a raising of glucose concentration in bloodstream
HI Human Islet; Langerhans Islet; regions of the pancreas that contain its endocrine (hormone-producing) cells, discovered in 1869 by German pathological anatomist Paul Langerhans. The pancreatic islets constitute 1 to 2% of the pancreas vol-ume and receive 10–15% of its blood flow. The pancreatic islets are arranged in density routes throughout the human pancreas, and are important in the metabolism of glucose IAPP Islet amyloid poli-peptide; is a
37-residue peptide hormone.It is cosecreted with insulin from the pancreatic β-cells in the ra-tio of approximately 100:1 (in-sulin:amylin). Amylin plays a xiii
xiv n o m e n c l at u r e
role in glycemic regulation by slowing gastric emptying and promoting satiety, thereby pre-venting post-prandial spikes in blood glucose levels
ICS Image correlation spectroscopy; fluorescence correlation tech-nique in which autocorrelation on an image is calculated IDF International Diabetes
Federa-tion
iMSD image-Mena square displace-ment; a measure of the devia-tion of the posidevia-tion of a particle with respect to a reference po-sition over time. It is the most common measure of the spatial extent of random motion, and can be thought of as measuring the portion of the system "ex-plored" by the random walker INS-1E Insulinoma (clone) 1E;
labora-tory cell-model used to study physiophatology of β-cell ISG Insulin secretory granule; a
com-plex intracellular organelle of pancratic β-cell comprised of a many proteins with different catalytic activities and messen-ger functions. It contains insulin molecule.
ISI Insulin stimulation index; index calculated by dividing secretd insulin concentration after glu-cose stimulation (at the 28 mM glucose) by secreted insulin con-centration at resting condition (2.8 mM glucose)
LLS Long lifetime species; chemical species characterized by high fluorescence lifetimes (i.e. 8 ns); marker of ROS-induced dam-ages of membranous compart-ments
mGPDH (mitochondrial) Glycerol-3-phosphate dehydrogenase is an enzyme that catalyzes the reversible redox conversion of dihydroxyacetone phosphate into glycerol 3-phosphate using NADH as cofactor.It permits to transport reducing agents across the inner mitochondrial mem-brane as NADH that cannot cross the membrane alone but it can reduce another molecule that can cross the membrane, so that its electrons can reach the electron transport chain. mMDH (mitochondrial) Malate
Dehy-drogenase is an enzyme that reversibly catalyzes the oxida-tion of malate to oxaloacetate using the reduction of NAD+ to NADH. Togheter with mGPDH act as mitochondrial NADH shuttle
NAD(P)H Nicotinamide adenine dinu-cleotide (phosphate); a cofac-tor found in all living cells. The compound is called a din-ucleotide because it consists of two nucleotides joined through their phosphate groups. One cleotide contains an adenine nu-cleobase and the other nicoti-namide. Nicotinamide adenine dinucleotide exists in two forms: an oxidized and reduced form, abbreviated as NAD+ and NADH respectively
PIP Phosphatidylinositol phosphate; a phospholipid found in cell membranes that helps to recruit a range of proteins, many of which are involved in protein trafficking, to the membranes PMT Photomultiplier tube; extremely
sensitive detectors of light in the ultraviolet, visible, and near-infrared ranges of the
electro-n o m e electro-n c l at u r e xv
magnetic spectrum. These detec-tors multiply the current pro-duced by incident light by as much as 100 million times, en-abling (for example) individual photons to be detected when the incident flux of light is low PSF Point spread function; the
re-sponse of an imaging system to a point source or point object. A more general term for the PSF is a system’s impulse response, the PSF being the impulse re-sponse of a focused optical sys-tem
PTP Protein tyrosine phosphatase; group of enzymes that remove phosphate groups from phos-phorylated tyrosine residues on proteins
RICS Raster image correlation spec-troscopy; a noninvasive tech-nique to detect and quantify events in a live cell, includ-ing concentration of molecules and diffusion coefficients of molecules; in addition, by mea-suring changes in diffusion coef-ficients, RICS can indirectly de-tect binding
RRP Ready releasable pool; It is func-tionally defined as a small sub-set of the many vesicles in a cell that is more readily released than other vesicles
SCD Statistical cluster distance; a global statistical analysis on whole-cell-population data based on the Mahalnobis ap-proach
SIM Structured illumination mi-croscopy; a type of wide-field super-resolution microscopy SPT Single particle tracking; the
observation of the motion of
individual particles within a medium. The coordinates time series, which can be either in two dimensions (x, y) or in three dimensions (x, y, z), is referred to as a trajectory. The trajectory is typically analyzed using sta-tistical methods to extract infor-mation about the underlying dy-namics of the particle
SRP Signal recognition particle; an abundant, cytosolic, universally conserved ribonucleoprotein (protein-RNA complex) that recognizes and targets specific proteins to the endoplasmic reticulum in eukaryotes and the plasma membrane in prokary-otes
STICS Spatio-temporal image correla-tion spectroscopy; fluorescence correaltion technique used to study the spatio-temporal evolu-tion on a system (i.e. fluorescent proteins inside a cell)
T1D e T2D Type 1 diabetes e Type 2 dia-betes
TEM Transmission electron mi-croscopy; a microscopy tech-nique in which a beam of elec-trons is transmitted through a specimen to form an image. The specimen is most often an ul-trathin section less than 100 nm thick or a suspension on a grid. An image is formed from the interaction of the electrons with the sample as the beam is trans-mitted through the specimen TICS Temporal image correlation
spectroscopy; fluorescence cor-realtion technique used to study the temporal evolution on a sys-tem (i.e. fluorescent proteins in-side a cell)
xvi n o m e n c l at u r e
TIRFM Total internal reflection fluores-cence microscope; is a type of microscope with which a thin re-gion of a specimen, usually less than 200 nm can be observed TPEN N,N,N,N-tetrakis
(2-pyridinylmethyl)
-1,2-ethanediamine; an intracellular membrane-permeable ion chela-tor. TPEN has a high affinity for many transition metals and should not be considered spe-cific or selective for a particular ion
F O R E W O R D : A G L O B A L E M E R G E N C Y TA R G E T E D . . . A T T H E N A N O S C A L E
463million people worldwide suffer from Diabetes (both type I and II), as reported in the 2019 report of the International Diabetes Federation (IDF) [1]. It is a growing trend that involves primarily low- and middle-income coun-tries but it is a global emergency affecting the health of individuals, societies and economics [1]. At the center of stage, the β-cells. These specialized cells naturally present in the Langerhans Islets of mammalian pancreas exert the complex function of secreting insulin in response to an augmented con-centration of glucose in the blood (glycaemia) and this happens through a tight regulation of key molecular processes. In brief, after being transported into the cell cytoplasm, glucose gets readily phosphorylated and metaboli-cally digested during glycolysis; the products of glucose oxidation, such as pyruvate and Nicotinamide Adenine Dinucleotide in its reduced form (i.e. NADH), are shuttled together with others substrates into mitochondria by mitochondrial transporters to participate to the Krebs Cycle and produce large quantities of NADH. NADH then acts as a potent electron carrier (being oxidized into NAD+) during the mitochondrial oxidative phospho-rylation, fueling the production of ATP molecules. Increased ATP/ADP ratio levels induce closure of plasma-membrane-associated ATP-sensitive potassium channels, which in turn induces depolarization of the plasma membrane and activation of voltage-sensitive calcium channels. Ca2+
influx finally promotes and sustain insulin secretion by mobilization of specialized organelles within β-cells, the insulin secretory granules (ISGs) from the cytoplasm to the fusion with the plasma membrane. ISGs, are approxi-mately 300 nm in linear size and contain a core of insulin molecules densely packed into crystalline-like arrays. Their structural and dynamic properties such as size, speed, mode of motion, number, etc. are tightly regulated throughout the metabolic process described. Hence, to summarize, the
β-cells orchestrate their peculiar response to glucose by (i) a cascade of fast
metabolic reactions and, subsequently, (ii) granule activation towards secre-tion. It is clear that a quantitative description of these processes, possibly within living cells/tissues, would be crucial for our understanding of β-cell function in physiology and its alterations in pathology. In this context, it is not surprising that, among others, the European scientific community
2 Foreword: a global emergency targeted...at the nanoscale
envisioned a road-map in Diabetes research that points to a fundamental role of multidisciplinary, quantitative approaches for future investigations of β-cell (dis)function [2]. Along the same reasoning, the overriding goal of my PhD project is to apply and adapt methods and concepts from the field of quantitative biophysics and optical microscopy to the study of the
β-cell and increase our understanding of two main pillars of its function,
as already mentioned above: the metabolic response to glucose and the subsequent regulation of insulin granule structural and dynamic properties to exert secretion. More in detail:
• The metabolic response of β-cells upon glucose stimulation is mon-itored by Fluorescence Lifetime IMaging (FLIM) microscopy on the intrinsic signal coming from NAD(P)H molecules.
• Granule structural and dynamic properties are investigated by spatio-temporal fluctuation spectroscopy, in particular by means of a fluores-cence based spatio-temporal fluctuation analysis algorithm (named image-derived Mean Square Displacement, or iMSD), that extracts the average size and dynamics of granules directly from imaging, with no need to preliminarily assume any interpretative model.
This Thesis is the result of my research activity at the NEST Laboratory of Scuola Normale Superiore in Pisa and has greatly benefited from the collaboration with Prof. Piero Marchetti and his research group at the De-partment of Clinical and Experimental Medicine (Islet Cell Laboratory) of University of Pisa and Cisanello Hospital. They provided cells and tissues, together with the fundamental expertise in the field of β-cell and Langer-hans Islets physio-pathology. For the sake of clearness, the main results of this Thesis were divided into separate Chapters, each addressing a different aspect of the biophysical analyses proposed. In brief: Chapter 1 presents an overview on β-cell biology and on the techniques available to study its key molecular aspects. The rationale behind my Thesis work is described in the final section of this Chapter.
Chapter 2introduces the use of FLIM microscopy, coupled to phasor anal-ysis, to study the β-cell metabolic response to glucose concentration. By means of Phasor-FLIM on NAD(P)H signal, is possible to quantify the ratio of protein-bound and free NAD(P)H and it can used to follow the metabolic shift that the β-cell experiences during glucose stimulation, both in a nor-mal condition and in presence of glucotoxicity induced by a hyperglycemic culturing condition (and simulating a T2D case).
3
The second pillar of this Thesis, the study of granule structural/dynamic properties, is addressed in Chapter 3 and Chapter 4.
In detail, Chapter 3 describes how we tuned the iMSD analysis to obtain a systematic study of granule size and motion in the cell cytoplasm. In particular, the optical microscopy acquisition parameters (i.e. frame rate, pixel size, etc) were optimized and validate by means of stimuli known to affect ISGs properties (e.g. cholesterol overload, glucose stimulation) and by comparing with results obtained by orthogonal well-established techniques used in the field (e.g. Electron Microscopy for structural details, Single particle Tracking for the analysis of granule dynamics).
Chapter 4builds on what learned before to achieve a comprehensive iMSD-based view of granule properties upon using different fluorescent tags for labelling. A short list of chimeric fluorescent proteins (FP) used to label ISGs is available in literature, differentiated from being localized inside the gran-ule lumen or trans-membrane. In this Chapter the main ones are compared in terms of their impact on granules properties. While iMSD analysis pro-duces similar results for the luminal markers, the use of a trans-membrane marker, phogrin-FP, shows a clearly altered result. Phogrin over-expression induces a substantial granule enlargement and higher mobility, together with a partial de-polymerization of the actin cytoskeleton and a reduced cell responsiveness to glucose stimulation. FP over-expression related artifacts are often underestimated, but they can seriously compromise the obtaining of reliable data. A few perspectives to tackle the limitation associated to FP over-expression for ISGs imaging are discussed in the final section of the Chapter.
Finally, Chapter 5 reports on the initial steps towards the application of all aforementioned biophysical tools in a new biological context, i.e. an entire, intact, human pancreatic islet. Preliminary measurements and future perspectives are presented in this Chapter.
All materials and methods are gathered in AppendixA. AppendixB contains supplementary information on iMSD analysis, including a detailed derivation of iMSD equations.
1
β- C E L L F U N C T I O N : T H E N E E D F O R N E W B I O P H Y S I C A L
A P P R O A C H E S
1.1 at t h e c e n t e r o f s ta g e: the β-cell.
The β-cell is localized in the Langerhans Islets [3] of mammalian pancreas and exert the complex function of secreting the peptide hormone insulin in response to an augmented concentration of glucose in the bloodstream. This function is essential in maintaining glucose homeostasis, whose imbalance causes damages to tissues and organs throughout the body. Langerhans Islets belong to the so-called "endocrine pancreas" and can be defined as micro-organs interspersed among the "exocrine pancreas" [4], constituted by cells secreting digestive enzymes. Each Islet contains different cell types: α,
β, δ, e, and PP cells, categorized according to the type of secreted endocrine
peptide hormone: 15–20% of cells are α-cells [5], 75–80% are β-cells, 5% are δ-cells [6], 1% are e-cells, and 4% are PP cells [7]. α-cells secrete the hormone glucagon that, together with the insulin secreted by β-cells, control glucose homeostasis; δ-cells secrete somatostatin that inhibits the secretion of insulin and glucagon; e-cells promote appetite and secrete ghrelin that inhibits insulin secretion; finally, PP cells secrete Pancreatic Peptide whose function is yet to be fully understood (Fig.1.1) [3,8].
Of all these cell types, the insulin secreting β-cells have been the primary focus of research in decades due to their recognized central role in Dia-betes mellitus. In Type 1 DiaDia-betes (T1D), in fact, a cellular autoimmune response results in the specific destruction of β-cells and consequent loss of insulin secretion [10,11]. In Type 2 Diabetes (T2D), by the other hand, defects in the actions of insulin generate the so-called "insulin resistance" pathological state, in which a sensibly higher concentration of insulin is required to maintain normal glucose homeostasis [12, 13]. T2D occurs only when insulin secretion becomes abnormal and/or the levels of se-creted insulin are insufficient to compensate for the increased demand from other organs. Such deregulation of protein production is one of the factors contributing to the stress of β-cells and consequent cell death. The dys-function of insulin secretion and associated hyperglycemia ultimately leads to micro- and macro-vascular damage, causing long-term complications
6 β-cell function: the need for new biophysical approaches
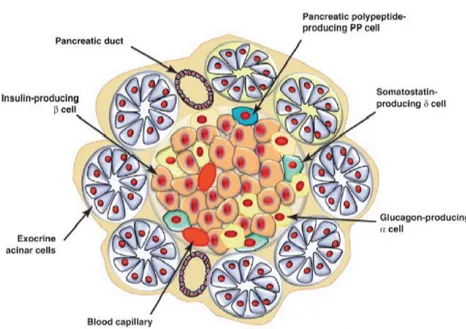
Schematic representation of islet and pancreas cell types
Figure 1.1: Most of the pancreatic tissue is composed of pancreatic acinar cells that produce digestive enzymes, which together with duct cells form the exocrine pancreas. The endocrine pancreas consists of four major cell types: α, β, δ and PP cells. These specialized cell types which are organized in compact islets secrete hormones into the bloodstream. The α and β cells that produce glucagon and insulin, respectively, regulate blood glucose levels. The δ and PP cells produce somatostatin and pancreatic polypeptide that modulate the secretory properties of the other cell types. Adapted from Efrat and Russ (2012) [9].
1.1 at the center of stage: the β-cell. 7
including neuropathy, nephropathy, retinopathy and cardiovascular disease that significantly affects quality of life and reduces life expectancy [14].
1.1.1 Inside the β-cell: insulin maturation steps.
A pancreatic β-cell acts, essentially, as a glucose sensor that responds to an acute hyperglycemic event (a temporary glycemic peak, typically postprandial) with the release of a dosed amount of insulin molecules, that are stored in specialized vesicles, produced and handled by the β-cell, the insulin secretory granules (ISGs) [15]. Each β-cell has an average volume of 763 µm3and contains approximately 10.000 ISGs each with a diameter of around 300 nm [16]. Insulin molecules are packed into the granules during a maturation process, that starts, as for many other exocytosed vesicles, from the Golgi apparatus and ends with a mature ISG free in the cell cytoplasm and ready to be secreted [15].
In their mature form, ISGs contain a dense core composed of tightly packed crystals, composed by six molecules of insulin stabilized by the coordination of one calcium and two zinc ions [15,17], in addition to a variety of soluble proteins and ions. Contextually to granule maturation, the insulin molecule undergoes several maturation steps too, that progres-sively change its structure and arrangement. First, pre-pro-insulin mRNA translation begins in the cytosol of pancreatic β-cells and consists of 110 amino acids (Fig.1.2).
The immature peptide form, like most secreted proteins, contains an amino-terminal signal peptide (SP), which allows its interaction with ribonu-cleoprotein signal recognition particles (SRP) [19], followed by a B-chain, a C-chain (also known as C-peptide) and an A-chain. The signal peptide is recognized by the SRPs, which specifically translocate pre-pro-insulin across the membrane of the Endoplasmic Reticulum (ER). In the ER, the signal peptide is cleaved by signal peptidase to produce pro-insulin that has 86 amino acids consisting only of B-chain, C-peptide, and A-chain. Pro-insulin has three disulfide bonds in A6–A11, A7–B7, A20–B19 [20] and, within the ER, is finally folded through the concerted action of chaperone proteins and protein-thiol reductase. The molecule is then transported via repeated cycles of vesicle budding and fusion from the ER to the Golgi apparatus; within the trans Golgi network (TGN), pro-insulin is packaged along with multiple other components into nascent secretory granules (Fig. 1.2). As the immature granules bud from the TGN, the process of
con-8 β-cell function: the need for new biophysical approaches
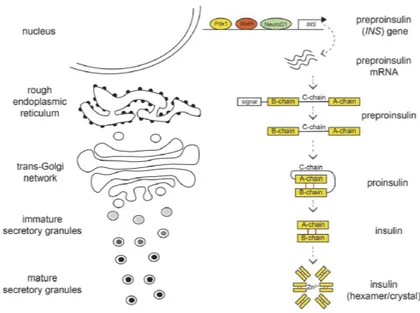
Insulin maturation steps
Figure 1.2: Insulin maturation along the granule secretory pathway. Pre-pro-insulin mRNA is transcribed from the INS gene and translated to pre-pro-Pre-pro-insulin peptide. As this transits through the ER and TGN, the pre-peptide is pro-cessed to its mature form and ultimately stored as hexameric insulin/Zn2+ crystals within mature secretory granules. Adapted from Tokarz (2018) [18].
1.2 from structure to function. 9
densation and acidification [21] (priming) of the granule content begins along with the proteolytic conversion of pro-insulin and other intra-granule precursors to generate their mature forms [22,23], ready to be secreted. In these final steps, pro-protein convertases (PC1/3) remove C-peptide from pro-insulin, originating mature insulin molecules composed only by A- and B-chains (Fig.1.2). The maturation process impacts also ISGs size, since this process involves further condensation of the matrix constituents, reduction in granule diameter and the dissociation of the coat proteins [24,25].
1.1.2 The insulin secretory granule: more than merely a container.
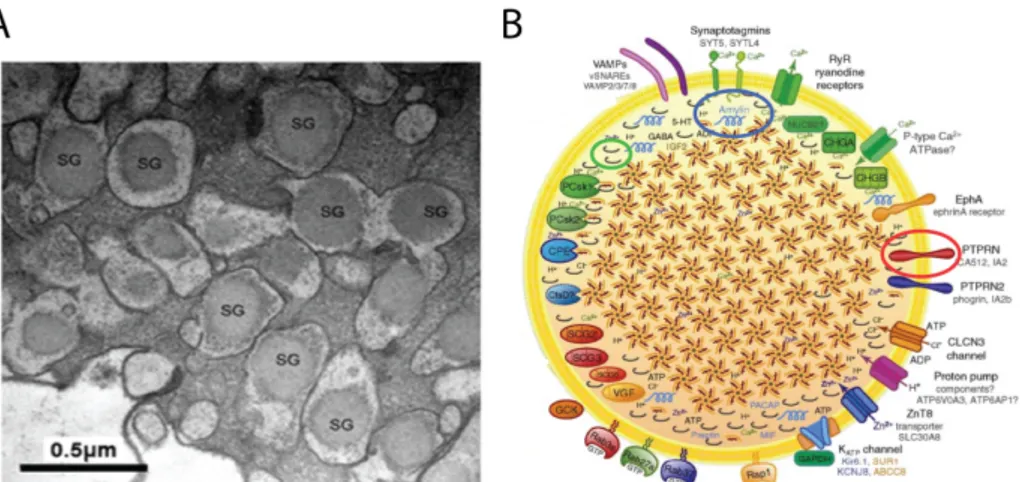
Apart from the insulin-related peptides, ISGs contain more than 100 pro-teins, comprised of other precursor propro-teins, processing enzymes, and vari-ous membrane proteins [26] (Fig.1.3). Electron microscope micrographs [27, 28] revealed that ISGs contains an electron-dense core separated from the surrounding membrane by a characteristic halo (Fig1.3.A), composed by the semi-crystal structure made by hexamers of mature insulin molecules [29]. The halo contains the "soluble part" of the ISG, i.e. several co-secreted proteins and ions.
The insulin granule was previously thought as merely a container, but accumulating evidence [16,30] suggests that it also acts as a signaling hub (Fig.1.3.B). Regulatory pathways originate from the ISG capable to influence granule movement, β-cell transcription and proliferation. Moreover, many co-secreted compounds possess regulatory functions, that affect both the
β-cell activity and that of neighbor cell types [31,32]. The concert of this multitude of signals ensures the coordination of several cellular processes and tissues to achieve nutrient homeostasis.
1.2 f r o m s t r u c t u r e t o f u n c t i o n: glucose-stimulated insulin s e c r e t i o n.
The metabolic response of the β-cell to glucose is essential for the mainte-nance of systemic glucose homeostasis. This process can be roughly divided into two main steps: (i) the events of glucose entry and metabolism by the
β-cell enzymatic machinery and (ii) the mobilization of ISGs for insulin
10 β-cell function: the need for new biophysical approaches
The insulin secretory granule
Figure 1.3: A) Transmission electron micrograph of insulin secretory granules with electrondense core surrounded by a pale halo. B) Representation of granules complexity. Apart from principal component, granules contain many proteins, small molecules and ions in the lumen, as well as several transmembrane proteins, channels and membrane associated proteins. Adapted from Suckale (2010) [16].
1.2 from structure to function. 11
β-cell functions
Figure 1.4: Glucose sensing and metabolic signals leading to insulin granule secretion. The release of insulin via exocytosis of secretory granules from pan-creatic β-cells is controlled by a series of metabolic and electrical signals arising as a result of glucose entry through GLUTs, phosphorylation by GK, and entry into the TCA cycle. The closure of ATP-dependent K+ (K-ATP) channels trig-gers electrical events that culminate in Ca2+
entry through voltage-dependent Ca2+
channels (VDCCs), which triggers exocytosis mediated by SNARE complex proteins. The overall secretory response is modulated by numerous receptors, channels, intracellular Ca2+
stores, metabolic signals, and cytoskeletal elements. Adapted from Tokarz (2018) [18].
12 β-cell function: the need for new biophysical approaches
1.2.1 Step-1: a cascade of metabolic reactions transforms glucose in a trigger signal.
The rise in circulating glucose levels that normally follow consumption of a meal lead to increased influx of glucose into the cytoplasm of β-cells through the low affinity glucose transporter 2 (GLUT) [33] (Fig.1.4). The transported glucose is then rapidly converted to glucose-6-phosphate by a low affinity glucokinase, which is the rate-limiting step of glycolysis [34]. The products of glucose oxidation, pyruvate in the first place, and Nicoti-namide Adenine Dinucleotide in its reduced form (i.e. NADH) (which is shuttled into mitochondria by mitochondrial glycerol phosphate dehydro-genase (mGPDH) and mitochondrial malate dehydrodehydro-genase (mMDH) [35]) together with others substrates participate in the Krebs cycle to produce larger quantities of NADH [36,37]. NADH then acts as a potent electron carrier (being oxidized into NAD+) during the mitochondrial oxidative phosphorylation, fueling the ATP production. Increased ATP/ADP ra-tio levels induce closure of plasma-membrane-associated ATP-sensitive potassium (K-ATP) channels (Fig.1.4), which in turn induces depolariza-tion of the plasma membrane and activadepolariza-tion of voltage-sensitive calcium channels. Ca2+
influx finally promotes and sustain insulin secretion [38], through granule docking and fusion with the plasma membrane via soluble N-ethylmaleimide-sensitive factor attachment protein receptor (SNARE) complexes and release of the granule’s content into the blood stream [18] (Fig.1.4).
1.2.2 Step-2: ISGs mobilization and exocytosis.
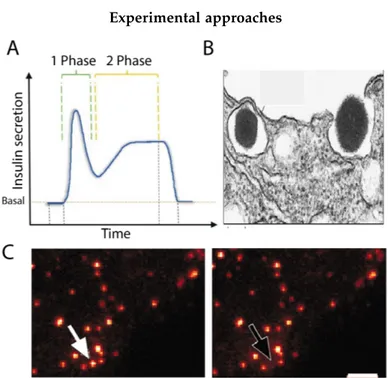
The second step is granule-mediated insulin secretion, a concerted and complex process which typically happens in a bi-phasic manner [39]. The first phase develops rapidly after glucose stimulation and lasts for a few minutes followed by a second sustained phase that rises slowly and lasts for 1 hours until glycaemia returns to resting levels (Fig.1.5.A). Notably, the lack of the first phase and a reduction of the second phase of insulin secretion are characteristic features of T2D [38].
The existence of two distinct phases, delayed in time, implies that ISGs experience regulated movements within the β-cell [41–43] (Fig.1.5.B). In fact, similarly to secretory vesicles in numerous other cell types, ISGs exist within the cell in various functional pools [40,44]: these include a readily
1.2 from structure to function. 13
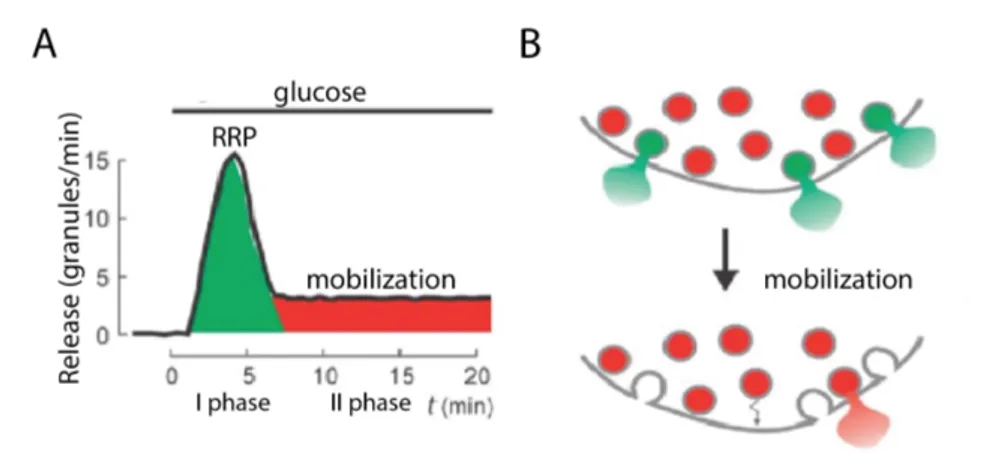
Granules’ pools and biphasic insulin secretion
Figure 1.5: A) Schematic of glucose-induced insulin secretion. B) A limited pool of granules is immediately available for release, corresponding to I phase of secretion (RRP, green granules). Most granules initially belong to a reserve pool (red granules) must undergo a series of preparatory reactions in order to be secreted (mobilization). Adapted from Rorsman (2003) [40].
14 β-cell function: the need for new biophysical approaches
releasable pool (RRP) (Fig. 1.5), chemically "primed" for exocytosis, re-sponsible of the first phase and an intracellular reserve pool, that must be mobilize and recruited for the long-lasting second phase [45]. Studies performed in living cells by Total Internal Reflection Fluorescence (TIRF) mi-croscopy demonstrated that second phase secretion results largely from the exocytosis of insulin granules newly recruited to the plasma membrane [46] that comes from the cytoplasm along microtubules through conventional motor proteins [42] and isotropic movements. Near the plasma membrane, insulin granules are transported along the cortical actin network in an ATP-dependent manner, likely by myosin. Actin remodeling stimulated by glucose is also suggested to be an important pre-requisite for granule recruitment and insulin secretion [47,48] (Fig. 1.6).
1.3 a p p r oa c h i n g t h e β-cell by quantitative biophysics: state o f t h e a r t a n d m o t i vat i o n o f m y w o r k.
As described so far in this Chapter, the peculiarity of the β-cell consists in the tight and regulated coupling between (i) glucose uptake and pro-cessing through the common metabolic reactions of cell respiration (i.e. glycolysis and oxidative phosphorylation) and (ii) subsequent mobilization and exocytosis of the secretion units the ISGs. This peculiar scheme of processes is altered in T1D and T2D with the final failure and/or loss of insulin-secreting β-cells [49,50]. It is clear that facing these processes exper-imentally is multifaceted challenge. The processes described, in fact, occur in a context that evolves within the whole cellular space. For this reason, non-invasive techniques (i.e. capable not to alter cell native status) simulta-neously able to address quantitatively the above-mentioned processes in time and space are highly desirable. The arsenal of biophysical techniques available at present hold the potential to tackle these tasks directly in living matter.
1.3.1 Metabolic imaging of β-cells in physiology and disease: a new label-free paradigm.
Concerning the first point, i.e. the metabolic response triggered by glu-cose intake, label-free techniques capable not to alter the chemical identity and endogenous stoichiometry of the key biochemical components of the secretion process are fundamental. The molecular-based biochemical
ap-1.3 approaching the β-cell by quantitative biophysics. 15
ISGs mobilization
Figure 1.6: Glucose enters through the GLUT transporter and rapidly undergoes intracellular metabolism. Through the classic stimulus-secretion coupling ISGs in proximity of the plasma membrane give rise to the first phase of insulin secretion. Concurrently, the metabolic signal also induces actin reorganization and granules’ recruitment to the plasma membrane to support the sustained second phase of insulin secretion. Adapted from Wang (2009) [48].
16 β-cell function: the need for new biophysical approaches
proaches presented so far, although very useful, suffer from several issues: the use of over-expressed fluorescence probes to monitor the events in living matter (i.e. fluorescent NADH sensor [51] or fluorescent ATP sen-sor [52]), with the risk of altering the stoichiometry of the molecular actors involved, or the need to study these processes outside the natural context of a living cell, as for classical biochemical studies. In this regard, two-photon microscopy offers a unique platform for imaging the intrinsic enzyme co-factors NADH and NADPH (which share same excitation and emission properties, hereafter referred to as NAD(P)H) in living cells. NAD(P)H molecules are involved in almost all the metabolic reactions of cellular respiration and glucose processing. NAD(P)H fluorescence imaging was applied to the specific context of the β-cell by Patterson et al. [53] to char-acterize the response to glucose-stimulation in rodent Langerhans islets. Yet, intensity-based measurements may contain artifacts due to the hetero-geneity of NAD(P)H concentration and to differing quantum yields (i.e. different fluorescence emission) of the molecule in the free and bound (to many different proteins/enzymes) forms. A way to overcome the limitation of intensity-based analyses consists in measuring NAD(P)H fluorescence lifetime (the time a fluorophore spends in the excited state before returning to the ground state by emitting a photon) instead of its intensity. Fluores-cence Lifetime IMaging (FLIM) microscopy was applied for the first time to the intrinsic signal of intracellular NAD(P)H molecules by Stringari and collaborators [54]. The lifetime of NAD(P)H changes according to its molec-ular state: if molecules are bound to enzymes they show higher lifetimes (and can be associated to a more oxidative metabolism) as compared to the case they are free (a metabolic status often defined as more "glycolytic"). By exploiting the differences in NAD(P)H lifetime measured by FLIM tech-nique, contrast based on an intrinsic signal can be obtained and can be used to generate a representative map of the metabolic state of the cell. Chapter 2describes how this technique was applied to study β-cell response to changing glucose levels.
1.3.2 Spatiotemporal fluctuation spectroscopy as a fast and robust screening method to study granule structural and dynamic properties.
The β-cell’s metabolic response to glucose described above rapidly trig-gers insulin secretion by granule mobilization and fusion to the plasma membrane. An increasing amount of evidences show that a tight
regula-1.3 approaching the β-cell by quantitative biophysics. 17
tion of both ISGs structural (e.g. size, number) and dynamic (e.g. speed, diffusion mode) properties is pivotal to assure their function (i.e. proper regulation of glucose homeostasis through insulin secretion) at cellular, and then systemic, level [40]. In fact, defects in granule structural and dynamic properties are found as hallmarks of pancreatic β-cells dysfunction and, in turn, of the onset of the pathological condition. For instance, it was recently proposed that hypercholesterolemia is capable of increasing granule size and, at the same time, impairing its membrane trafficking properties [55]. Despite the huge research interest and experimental efforts, however, no method proposed thus far is capable of providing fast, robust and simul-taneous access to both structural and dynamic information on ISGs in living cells, i.e. is able to probe both the spatial and temporal dimension at the scale of interest. Historically, the insulin secretion process has been addressed measuring the temporal profile of insulin release by means of absorbed antibodies and colorimetric reaction, such as in the ELISA assay (Fig.1.5.A and Fig.1.7.A). In this method, still used and fundamental to monitor the efficiency of the overall secretion process, the spatial dimension of the process is inevitably missing. Only indirect evidences of granule spa-tial organization within the cell cytoplasm (e.g, the presence of RRP) can be retrieved from these measurements, as mentioned above (see section1.2.2). On the other hand, high spatial resolution can be achieved at the expense of the temporal dimension by means of Transmission Electron Microscopy (TEM) (Fig. 1.3.A and Fig. 1.7.B). Here, at the wavenumbers of electron, it is possible to dissect the finest details of the granule structure, number, and spatial distribution within the β-cell. It is worth noting, however, that this approach has been recently questioned as could be prone to fixation artifacts as demonstrated by Fava et al. [56] in fact, chemical fixation with aldehydes induces morphological alterations due to dehydration of the sam-ple which can, eventually, lead to errors in granule size estimation. Recent attempts to tackle this limit by Structured Illumination Microscopy (SIM) (i.e. sub-diffraction resolution applied to living cells exploiting fluorescence) were severely hampered by the dynamic nature of ISGs [40].
Concerning this latter property of ISGs, on the other hand, most of our knowledge comes from the use of fluorescence-based optical microscopy on live cells either by total internal reflection fluorescence (TIRF) imag-ing [39,46,57] and/or by Single Particle Tracking (SPT) studies [58–62]. The former is technically limited to study the cell/glass interface in ad-herent cells. It was used to clarify the process of docking and fusion at the plasma membrane of fluorescently-labelled granules (Fig.1.7.C). The
18 β-cell function: the need for new biophysical approaches
Experimental approaches
Figure 1.7: A) Insulin secretion temporal profile with first and second phases. Adapted from Castiello (2015). B) TEM micrograph of ISG exocytosis. Adapted from Duvoor (2017). C) TIRF microscopy image shows fluorescently la-belled ISGs during exocytosis. Adapted from Ma (2004).
1.3 approaching the β-cell by quantitative biophysics. 19
latter is inherently time-consuming and technologically-challenging. Yet, it was pivotal to extend the spatial scale of interest, allowing ISGs intracel-lular trafficking properties to be fully characterized, at the level of single granules [58]. It must be noted, however, that neither of the two strategies was exploited to extract structural information on the trafficking ISGs. In this scenario, fluorescence-based spatio-temporal fluctuation analysis was recently proposed in my laboratory as a powerful quantitative tool to simul-taneously extract average structural and dynamic properties of diffusing objects, from molecules [63,64] to entire sub-cellular nanostructures/or-ganelles [65,66] directly from standard imaging on living cells, with no need for complex instrumentation, no need for preliminary assumptions/-knowledge on the system, and no need to extract individual trajectories. In Chapter3and Chapter 4of this Thesis I will present the application of a fluctuation spectroscopy method in particular, the image-derived Mean Square Displacements (iMSD) technique, to retrieve information on ISGs’ structural and dynamic properties. It appears clear how fluorescence-based techniques are at present the only capable to satisfy the need spatiotemporal investigations in living cells with the only limitation being that the overex-pression of fluorescence probes can, in principle, alter the stoichiometry of the molecular actors involved, generating potential artifacts and leading to misinterpretation of data. This is specifically addressed in Chapter4with a close examination of how fluorescent proteins used to tag ISGs impact on granule structural and dynamic properties. Because of these general concerns, the need of label-free approaches is constantly increasing in the scientific community and some (not many) endogenous "contrast-generator" are available within biological systems, but needed to be validated before performing reliable imaging experiments [67]. Some of these, specific for granule, will be described in the final section of Chapter4.
2
P H A S O R F L I M A N A LY S I S O F β - C E L L M E TA B O L I CR E S P O N S E T O G L U C O S E S T I M U L AT I O N
Most of the content of this Chapter is included in the following manuscript, re-cently accepted by Faseb Bioadvances:
- Metabolic response of Insulinoma INS-1E cells to glucose stimulation studied by fluorescence lifetime imaging.
Ferri G., Tesi M., Massarelli F., Marselli L., Marchetti P., Cardarelli F.
Once docked to the cell membrane, granules are ready to be secreted. A cascade of highly regulated biochemical processes, extensively summa-rized in section 1.2.1, connects glucose stimulation to insulin secretion (GSIS). In spite of the central role of the β-cell biochemistry for systemic glucose homeostasis, there is a lack of non-invasive and fast strategies to identify the metabolic state of living β-cells in the physiological state and its possible alteration in the pathological condition. To tackle this issue, NAD(P)H species are used here as intrinsic metabolic biomarkers and the phasor approach to FLIM microscopy applied to extract the metabolic signature of β-cells in terms of the ratio between protein-bound and free NAD(P)H under different conditions. Here, Insulinoma 1E (INS-1E) β-like cells are elected as model for recapitulating primary β-cell functions. Their metabolic response to glucose stimulation in terms of bound/free NAD(P)H is measured by phasor-FLIM analysis in normal and hyperglycemic con-dition. Moreover, with phasor-FLIM is possible to concomitantly monitor the appearance of hyperglycemia-induced ROS damages to intracellular membranous compartments, recognizable as long-lifetime species (LLS).
2.1 i m a g i n g o f na d(p)h autofluorescence.
Given its biological importance, the possibility to monitor NAD(P)H level in living cells could represent a valid marker for qualitative/quantita-tive assessments on cellular metabolic state. In this sense, the pioneering studies of Chance et al. [69, 70] have laid the ground for future works
22 p h a s o r f l i m a na ly s i s o f β-cell metabolic response.
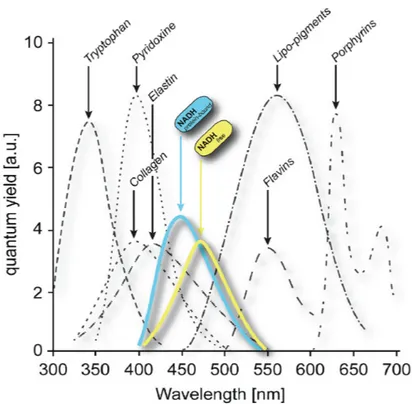
Cellular autofluorescence spectra
Figure 2.1: Emission spectra of NAD(P)H bound (blue) and NAD(P)H free (yellow) are shown. The emission is peaked around 460 nm. Adapted from Schaefer et al. (2019). Adapted from Schaefer (2019) [68].
2.2 phasor-flim approach to nad(p)h-based metabolic fingerprint. 23
based on NAD(P)H optical properties. In fact, both oxidized NAD(P)+ and reduced NAD(P)H show strong absorption in the UV region around 260 nm; however, only NAD(P)H absorbs appreciably at 350–365 nm and emits fluorescence with a peak at ∼460nm (Fig.2.1). In the emission interval between 400−500 nm the contribution of other autofluorescence species is negligible except for collagen which is not present in laboratory cultured cells [71]. Within intrinsic fluorophores, NAD(P)H also has a good two-photon cross section around 720 nm [72], allowing two-photon excitation and therefore achievement of a good penetration depth and minimal per-turbation/damage of the sample. However, intensity-based measurements may contain artifacts due to the heterogeneity of fluorophore concentration and to differing quantum yields of NAD(P)H in the free and bound (to proteins) form [53,73].
2.2 p h a s o r-flim approach to nad(p)h-based metabolic fin-g e r p r i n t.
To overcome these issues, Lakowicz et al. [74, 75] introduced a new methodology based on Fluorescence Lifetime IMaging (FLIM) microscopy in which the "contrast" depends on the fluorescence lifetime (i.e. a measure of the time a fluorophore spends in the excited state before returning to the ground state by emitting a photon) and not on the local concentration and/or intensity of the fluorophore (the number of emitted photons). The main advantage of FLIM microscopy is that it can selectively discriminate the free and protein-bound forms of NAD(P)H molecules [74]. In turn, then, the ratio of bound/free NAD(P)H species can be used to identify different metabolic states of cells (e.g. the glycolytic phenotype, with a low bound/free ratio, and the oxidizing condition, with a high bound/free ratio). In fact, free NAD(P)H has a relatively short decay time of 0.4 ns. The mean fluorescence lifetime of protein-bound NAD(P)H varies between 2.0 and 4.0 ns [75], dependent on its microenvironment. As the absolute amount of NAD(P)H bound to proteins is usually relatively stable [75], the ratio of free to protein-bound NAD(P)H coincides with the NAD(P)H redox state. It can be concluded that a shift in cellular metabolism toward glycolysis and/or lower mitochondrial respiration corresponds with a shortening of NAD(P)H lifetime and vice versa (Fig.2.2) [68].
In particular, the ratio of bound/free NAD(P)H species was used to identify different metabolic fingerprints of cell states, including disease
24 p h a s o r f l i m a na ly s i s o f β-cell metabolic response.
Scheme of NAD(H) fractions upon metabolic changes
Figure 2.2: Under the assumption of a stable NAD+/NAD(P)H pool, a change in redox ratio, for example, due to metabolic alterations, changes the NAD(P)H concentration and thereby the total NAD(P)H autofluorescence intensity. FLIM further allows differentiation of free and protein-bound NAD(P)H by their decay times, resulting in the mean NAD(P)H lifetime, which coincides with the redox state and metabolism.Adapted from Schaefer (2019) [68].
2.2 phasor-flim approach to nad(p)h-based metabolic fingerprint. 25
Phasor plot principles
Figure 2.3: A) Selecting different regions of the phasor plot results in B) a selection of different areas of the image and a phasor color-mapped FLIM image and viceversa.Adapted from Ranjit (2018) [79].
progression, stage of differentiation, apoptosis and cell fate [54,76,77]. To summarize, differently from NAD(P)H intensity analysis, FLIM has the potential to retrieve quantitative information about the ratio of NAD(P)H molecules in the "bound" (e.g. to enzymes) and "free" form, although with a few selected limitations, namely: (i) NAD(P)H and NAD(P)H species cannot be distinguished; (ii) the metabolic response is reported in terms of bound/free ratio but changes can occur in both the numerator and denominator; (iii) the approach, as used here, does not have native single-enzyme or single-pathway resolution.
A further step of analysis can be reached when FLIM-based measure-ments are coupled with phasor analysis, historically applied in electric circuit studies, and then extended for the first time to the FLIM field by Digman et al. [78]. In phasor analysis, the fluorescence lifetime spectra of each pixel in the image is mapped onto a “phasor” that is made up out of two numbers: the real and imaginary parts of the first harmonic of the Fourier transform of the fluorescence intensity decay (see Methods in AppendixA). These two numbers (namely g and s coordinates) are used as coordinates in a scatter plot, the phasor plot. Thus, the phasor plot contains clouds of points that correspond to pixels with similar lifetime spectra (Figure 2.3.A). The phasor plot is represented by a semicircle where the zero lifetime is located at (g=1, s=0) and the infinite lifetime located at (g=0, s=0). By changing the lifetime from zero to infinity the phasor point moves along a semicircle from (1,0) to (0,0).
26 p h a s o r f l i m a na ly s i s o f β-cell metabolic response.
Phasor-FLIM measurement on a NADH solution
Figure 2.4: Phasor-FLIM measurement on a 250 µM NAD(P)H "free" solution, used as reference for trajectory position.
The goal of this approach is the creation of a color-mapped image in which different colors represent different fluorescence lifetime decays [79]. In fact, a distinguishing feature of phasor analysis is that any region of the phasor plot (which corresponds to a type of decay) can be selected with cursors (red and blue in the figure) in order to directly identify the pixels in the image with that given lifetime (Fig.2.3.B). This process can be also reversed, and different areas of the intensity image can be selected to obtain the corresponding phasor distribution (segmentation analysis). The phasor approach to FLIM provides a powerful visualization of the data content with a fit-free analysis of the information contained in the thousands of pixels constituting an image. Graphically, in the phasor plot it is possible to define a trajectory, starting from a region of the plot corresponding to enzymes-bound NAD(P)H characteristic lifetimes (spanning from 3 to 3.6 ns) [80,81] to a region corresponding to free NAD(P)H in solution (lifetime 0.4 ns) measured with at high repetition rate (80 MHz) by two-photon laser (Figure2.4).
2.3 experimental model of β-cells. 27
Associated to this trajectory, a color-bar can be used to color each pixel of the image according to the lifetime decay measured in that pixel. According to the linear combination properties of phasors [82], in fact, each pixel lying on the trajectory contains a mixed fraction of the two pure species representing the end-points of the line (bound and free NAD(P)H in this case).
Specifically in the context of insulin secretion, the phasor-FLIM analysis on NAD(P)H species was already used to monitor the metabolic status of intact human and/or mouse Langerhans islets under different stim-uli [83–85]. In particular, in a recent pioneering work by Gregg and col-laborators [83], phasor-FLIM analysis revealed an increase in the ratio of bound/free NAD(P)H species in both human and mouse islets in response to glucose stimulation, an effect then impaired by aging. The observed shift in NAD(P)H lifetimes measured on entire islets after glucose stimulation is generally attributed to the response of the β-cells to this event, although it is not currently possible to distinguish between different endocrine cell types within such a complex system.
2.3 e x p e r i m e n ta l m o d e l o f β-cells.
The majority of studies published so far on β-cells physio-pathology have been accomplished on laboratory cell models recapitulating the principal features of native β-cells, especially the response to glucose stimulation. While, on the one hand, these cell lines cannot provide a complete replica of real β-cells situated within the pancreas (which benefit from input by neural, cellular and vascular regulators) they allow to tackle the major limitation related to the availability of animals or human primary tissues. Rodent derived cell lines possess both immortality and intact β-cell stimulus secretion coupling. They have been generated since 1980 [86] and well characterized during these years both for research purposes and for use in proof-of-principal studies of cell therapy, such as anti-diabetic drug testing. Between all, MIN6 [87] and INS-1E [88] cell lines have proven particularly popular for β-cell research, as indicated by estimated publication numbers: 1145 for MIN-6 and 1538 for INS-1E (data updated to 2018 [89]). INS-1E cells, especially, exhibit a high insulin content and a very accurate β-cell function and for these reasons they were chosen also for the majority of the experiments proposed in this Thesis.
28 p h a s o r f l i m a na ly s i s o f β-cell metabolic response.
2.4 t h e β-cell metabolic status.
The phasor-FLIM analysis is applied here to INS-1E cells to monitor their metabolic status in terms of bound/free NAD(P)H species in standard culturing (11 mM glucose) and then, the metabolic response to glucose stimulation.
2.4.1 Preliminary fluorescence intensity analysis of NAD(P)H species in INS-1E cells.
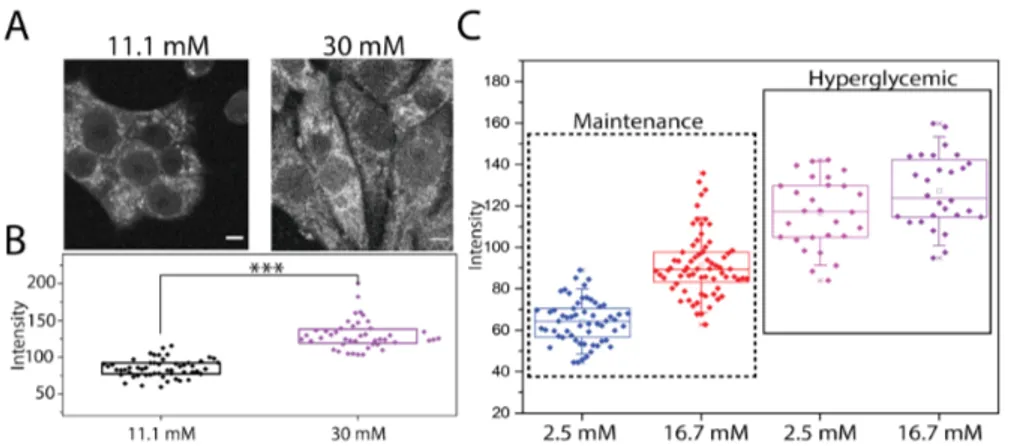
By using a two-photon excitation source tuned at 710 nm flashed on living cultured (and unlabeled) cells, the main contribution to the total detected auto-fluorescence signal arises from NAD(P)H species, which are optically active with most of the fluorescence emission in the 400-500 nm range [54] (Fig.2.1). Under typical maintenance culturing conditions (i.e. complete RPMI medium supplemented with 11.1 mM glucose), an intrinsic fluorescence signal from INS-1E cells is clearly detectable (Fig. 2.5.A). It derives mainly from cytoplasmic regions, which appear with a peculiar patterned staining (presumably belonging to mitochondria). Cell nuclei, instead, can be distinguished as ellipsoidal regions with a sensibly lower auto-fluorescence signal (Fig.2.5.A).
Overall, the intracellular distribution of detected signals reflects the ex-pected localization of NAD(P)H species and well agrees with previous measurements on different cellular systems [53,90]. The same cells cultured for 48 hours in condition of hyperglycemia, which is known to impair β-cells metabolism and physiology [90,91], show a similar autofluorescence pat-tern, but with absolute intensity values that appear significantly increased compared to maintenance condition (130.2±19.9, 84.7±12.2 respectively, p < 0.0001) (Fig.2.5.B). This finding is in line with previous observations correlating glucose concentration in the medium and intracellular autoflu-orescence signal [53,90]. As described in detail in the AppendixA and according to previous reports [92], a protocol for acute glucose stimulation of INS-1E was used. The total autofluorescence intensity of INS-1E cells (Fig.2.5.C) increases significantly upon exposure to 16.7 mM glucose con-centration with respect to 2.5 mM glucose after both the above-mentioned culturing conditions (48h at 11.1 mM or 30 mM glucose). However, this increment is significantly higher in cells previously kept at 11.1 mM glucose, compared to those culture at 30 mM glucose (respectively 41.6±10.6 %
2.4 the β-cell metabolic status. 29
Autofluorescence intensity analysis
Figure 2.5: A) Representative images of NAD(P)H auto-fluorescence intensity in INS-1E in maintenance condition (11.1 mM glucose) and in INS-1E cultured for 48hours in hyperglycemic condition (30 mM glucose). Scale bar: 5 µm. B) Box plots for different culturing conditions. Each point represents the total NAD(P)H intensity of a single cell. Boxes represent 25 and 75 percentiles, lines represent median, whiskers represent SD. (∗ ∗ ∗p value < 0.001, Mann-Whitney test). C) Box plots for different culturing conditions. Each point represents the total NAD(P)H intensity of a single cell. Boxes represent 25 and 75 percentiles, lines represent median, whiskers represent SD.
30 p h a s o r f l i m a na ly s i s o f β-cell metabolic response.
NAD(P)H intensity and insulin secretion
Figure 2.6: A) NAD(P)H intensity fractional increment in maintenance (M) and hyperglycemic (H) conditions, calculated as fold increment in NAD(P)H intensity measured between 2.5 and 16.7 mM;∗p value < 0.05. B) Insulin release measured by ELISA-kit assay in low (2.5 mM) and high (16.7 mM) glucose concentration in cells pretreated for 48h with 30 mM glucose. Stimulation was carried out following protocol described in Methods section. Data are the means ± SE of three separate measurements. Dashed columns represent measured insulin release in maintenance condition.∗p value < 0.05 compared with high glucose (16.7 mM) of maintenance condition.
and 8.9 ± 2.0 %, p=0.007, Fig.2.6.A). Accordingly, acute glucose-stimulated insulin release in response to 16.7 mM glucose was significantly higher with the INS-1E cells cultured for 48h at 11.1 mM glucose than with those kept at 30 mM glucose (Fig.2.6.B), indicating that in this latter case cells had functional features of "glucose toxicity" [93].
2.4.2 FLIM analysis of NAD(P)H species in INS-1E cells in response to glucose stimulation.
As already stated above [68], intensity-based measurements of NAD(P)H species inevitably contain artifacts due to the heterogeneity of fluorophore concentration and to differing quantum yields of NAD(P)H in the free and bound (to proteins) form. FLIM, instead, reports on the fluorophore’s micro-environment and, in this case, can discriminate between "free" and
"protein-2.4 the β-cell metabolic status. 31
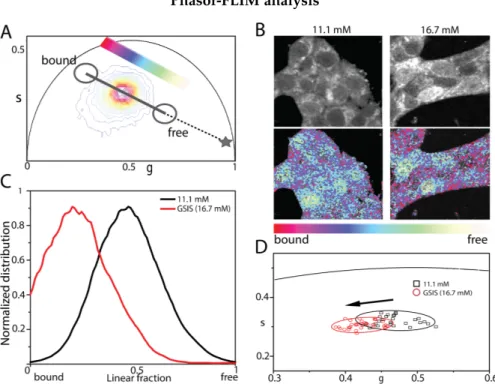
bound" NAD(P)H species within the cell. Phasor FLIM analysis applied to INS-1E cells under maintenance culturing conditions yields a reference position of the NAD(P)H bound/free lifetime ratio (Fig. 2.7.A). Visual inspection of FLIM maps suggests the expected prevalence of NAD(P)H molecules in the "bound" form within the cytoplasm while nuclei are enriched NAD(P)H molecules in the "free" form (Fig.2.7.B, left panels).
This readout is used to test cell response to glucose stimulation following the protocol described above. More in detail, once exposed at 16.7 mM glucose, cells were imaged for approximately 45 minutes. As showed in Fig.2.7.B-C, glucose stimulation produces a clear shift of the NAD(P)H bound/free lifetime ratio towards higher values. In particular, a comparative analysis of the phasor coordinates of unstimulated (black squares, n=28) and stimulated cells (red circles, n=35), represented by single data points, is reported in Fig.2.7.D, in which variations along both g and s axes of the phasor plot can be appreciated. At this point, by exploiting the imaging potential of 2-photon FLIM, it is performed a spatial segmentation analysis of data (see section2.2) to extract the specific contribution of the cytoplasm (and nucleus) of cells to the observed metabolic shift (Fig. 2.8.A). The obtained scatter plots of the average values of phasor distributions from the nucleus (yellow, top graph) and cytoplasm (red, bottom graph) are reported in Fig.2.8.B: it is clear that the cytoplasm of cells is the location where the metabolic shift towards an higher bound/free NAD(P)H lifetime ratio does take place (compare empty and full data points in Fig.2.8.B, bottom panel).
2.4.3 The characteristic metabolic signature of the β-cells.
The metabolic response upon glucose stimulation observed in insulin-secreting INS-1E cells was compared to similar measurements performed in non-secreting cells, namely A549 (lung tumor-related cells) and HEK 293 cells (human embryonic kidney cells) (Fig.2.9.A). Both A549 and HEK293 cells exposed to the same treatments (i.e. pulsed stimulation with 16.7 mM glucose to mimic secretion) did not show any significant increase in the bound/free NAD(P)H lifetime ratio of NAD(P)H calculated as the Euclidean distance between the ellipsoid central points of unstimulated and stimulated cells (Fig.2.9.B. The observed different response between insulin-secreting cells and non-secreting cells reflects a different biochemical regulation of glucose intracellular metabolism. This result can be readily interpreted as a tight coupling between glucose influx and activation of
32 p h a s o r f l i m a na ly s i s o f β-cell metabolic response.
Phasor-FLIM analysis
Figure 2.7: A) Phasor plot of control and stimulated cells. Color-bar defines the variations from NADH bound state (red/magenta) to NADH free state (green/white). Grey symbol represents the position in the phasor plot of pure NADH solution. B) Exemplary images of total NADH intensity of INS-1E cell clusters (top line) in 11.1 mM glucose and . On bottom line, same images colored in accordance to the color bar defined below. C) Distributions of the free and bound NADH species for all pixels of acquired image in (B) for 11.1 mM and GSIS condition. D) Scatter plot of the average values of distinct phasor distri-butions, each relative to distinct acquired cells. Black squares represent cells in maintenance condition, in red circles stimulated cells. Standard deviation is depicted as 90% confidential ellipsoid in accordance to aforementioned colors.