DIPARTIMENTO DI CHIMICA E BIOLOGIA
TESI DI DOTTORATO
IN
CHIMICA
(
XXX CICLO
)
Development of new in vitro models based on the
use of electrospun scaffolds and their imaging by
multiphoton microscopy coupled with fluorescence
lifetime imaging microscopy
Relatore:
Candidato:
Ch.ma Prof.
Germano Pasquale
Brigida BOCHICCHIO
PICCIRILLO
Correlatore:
Matr.: 8800100001
Ch.ma Prof.
Antonietta PEPE
LIST OF ABBREVIATIONS ... 1
GENERAL INTRODUCTION ... 4
OUTLINE AND OBJECTIVES ... 8
CHAPTER 1. MATERIALS AND METHODS ... 10
1.1. Synthesis of Diclofenac-Glycine (DCF-Gly) ... 10
1.2. Nuclear magnetic resonance (NMR) analysis ... 11
1.3. Electrospinning ... 12
1.4. Reverse phase high performance liquid chromatography (RP-HPLC) ... 13
1.5. Cross-linking procedure ... 14
1.6. Hyaluronic acid (HA) coating ... 14
1.7. Swelling test analysis ... 15
1.8. Liquid displacement method ... 15
1.9. Scanning electron microscopy (SEM). ... 16
1.10. Drug release experiments ... 16
1.11. Contact angle measurements ... 17
1.12. Uniaxial tensile testing ... 18
1.13. Cell culture and seeding ... 18
1.14. Multiphoton microscopy (MPM) ... 19
1.15. In vitro cytotoxicity assay ... 20
1.16. Fluorescence lifetime imaging microscopy (FLIM) ... 21
1.17. ImageStream® analysis... 22
1.18. Raman microspectroscopy. ... 23
1.19. Data analysis ... 23
CHAPTER 2. IMAGING OF DICLOFENAC INDUCED CELL DEATH IN HUMAN DERMAL FIBROBLASTS USING MULTIPHOTON MICROSCOPY COUPLED WITH FLUORESCENCE LIFETIME IMAGING MICROSCOPY ... 24
2.1. Introduction ... 24
2.2.1.1. Electrospinning ... 26
2.2.1.2. SEM and fiber diameter analysis ... 26
2.2.1.3. Drug release experiments ... 27
2.2.1.3.1. UV-monitoring and fitting using Peppas equation ... 28
2.2.1.3.2. RP-HPLC ... 28
2.2.1.3.3. Electron X-ray dispersive spectroscopy (EDX) ... 30
2.2.1.3.4. Nuclear magnetic resonance (NMR) analysis ... 32
2.2.1.4. Tensile tests ... 33
2.2.1.5. Contact angle measurement ... 34
2.2.1.6. In vitro cytotoxicity ... 35
2.2.2. MPM and FLIM analysis ... 35
2.2.3. ImageStream® analysis... 38
2.2.4. MPM and FLIM real time analysis ... 39
2.3. Discussion ... 41
2.4. Conclusions ... 46
CHAPTER 3. PRODUCTION AND CHARACTERIZATION OF AN ELECTROSPUN PLA SCAFFOLD LOADED WITH A SYNTHETIC DICLOFENAC PRODRUG FOR THE LOCAL TREATMENT OF ACTINIC KERATOSIS. ... 47
3.1. Introduction ... 47
3.2. Results ... 50
3.2.1. Synthesis of a Diclofenac prodrug via SPPS ... 50
3.2.2. Production of the scaffolds by electrospinning ... 50
3.2.3. SEM and fiber diameter analysis ... 50
3.2.4. Contact angle measurements ... 52
3.2.5. Tensile tests ... 52
3.2.6. MPM analysis ... 53
3.2.7. Drug release experiments ... 54
3.2.8. In vitro cytotoxicity ... 55
3.2.9. FLIM analysis ... 55
3.3. Discussion ... 57
SCAFFOLDS WITH CONTROLLED HYDROPHOBICITY AND WETTABILITY .. 63
4.1. Introduction ... 63
4.2. Results ... 69
4.2.1. HYBRID GELATIN/POLY-L-LACTIDE SCAFFOLDS WITH CONTROLLED POROSITY AND WETTABILITY ... 69
4.2.1.1. Production of the scaffolds by electrospinning and cross-linking ... 69
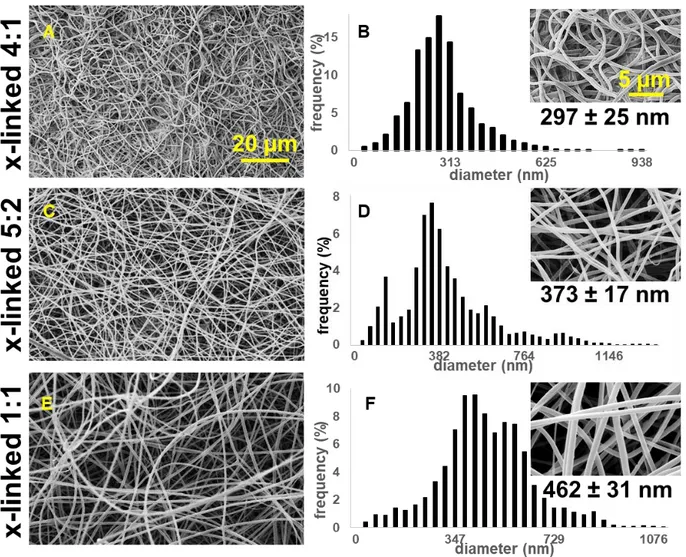
4.2.1.2. SEM and fiber diameter analysis ... 70
4.2.1.3. Porosity, swelling properties and contact angle measurements ... 74
4.2.1.4. Tensile tests ... 76
4.2.1.5. Raman spectra and principal component analysis (PCA) ... 78
4.2.1.6. Scaffolds biocompatibility ... 81
4.2.2. HYBRID GELATIN/POLY-L-LACTIDE IN 1:1 RATIO SCAFFOLDS WITH CONTROLLED HYDROPHOBICITY ... 81
4.2.2.1. Functionalization of the scaffolds with hyaluronic acid ... 81
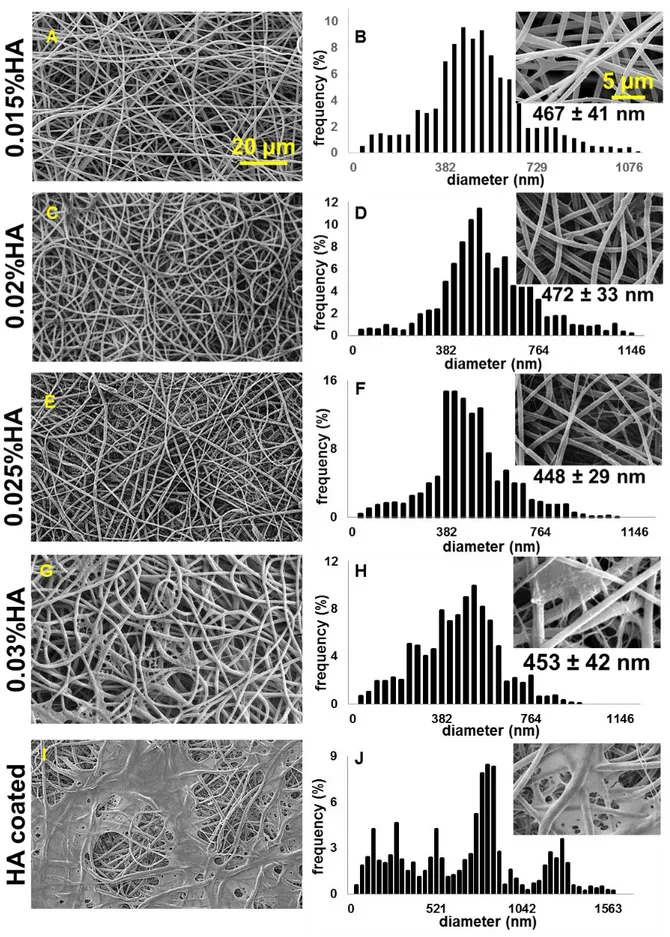
4.2.2.2. SEM and fiber diameter analysis. ... 82
4.2.2.3. Porosity, swelling properties and contact angle measurements ... 84
4.2.2.4. Tensile tests ... 85
4.2.2.5. Raman spectra and principal component analysis (PCA) ... 87
4.2.2.6. Scaffolds biocompatibility. ... 90
4.2.3. MPM AND FLIM ANALYSIS OF HUMAN DERMAL FIBROBLASTS ON HYBRID GELATIN/POLY-L-LACTIDE SCAFFOLDS ... 91
4.2.3.1 MPM imaging ... 91
4.2.3.2 FLIM analysis ... 92
4.3. Discussion ... 95
4.4. Conclusions ... 99
SUMMARY AND CONCLUDING REMARKS ... 100
SUPPLEMENTARY MATERIALS ... 101
REFERENCES ... 110
Siqua meis fuerint, ut erunt, vitiosa libellis, excusata suo tempore, lector, habe. exul eram, requiesque mihi, non fama petita est, mens intenta suis ne foret usque malis.
1
LIST OF ABBREVIATIONS
[3-(4,5-dimethylthiazol-2-yl -5-(3-carboxymethoxyphenyl -2-(4-sulfophenyl -2H-tetrazolium] = MTS
1,1,1,3,3,3-Hexafluoro-2-propanol = HFIP 1-Hydroxybenzotriazole hydrate = HOBT 2,2,2-Trifluoroethanol = TFE
2-Chloro Trityl Chloride = 2-CTRL-Cl
4, 4-dimethyl-4-silapentane-1-sulfonic acid = DSS 7-aminoactinomycin D = 7-AAD
Acetic acid = AcOH
Acetonitrile = CH3CN
Actinic keratosis = AK After release = a.r. Arbitrary unit = a.u. Aspartic acid = L-Asp Basal cell carcinoma = BCC
Benzotriazol-1-yloxy-tripyrrolidino-phosphoniumhexafluorophosphate = PyBOP Cross-linked = X-linked
CTRL = control
Deuterated dimethyl sulfoxide = DMSO-d6
Deuterium oxide = D2O
Dichloromethane = DCM Diclofenac sodium salt = DCF Diclofenac-Glycine = DCF-Gly Dimethyl sulfoxide = DMSO Dimethylformamide = DMF
2
Dulbecco’s modified eagle medium = DMEM Electron X-ray dispersive spectroscopy = EDX Ethanol = EtOH
Extracellular matrix = ECM Fetal calf serum = FCS
Fluorescence lifetime imaging microscopy = FLIM Food and Drug Administration = FDA
Fourier-transformed infrared spectroscopy = FTIR Gelatin = GE
Glass-transition temperature = Tg
Glutamic acid = L-Glu Glycosaminoglycan = GAG Gray value intensity = GVI
Human dermal fibroblasts = HDFs Hyaluronic acid = HA
Isoelectric point = IEP
Matrix-assisted laser desorption ionization mass spectrometry = MALDI-MS
Melting temperature = Tm
Methanol = MeOH
Multiphoton microscopy = MPM
N-(3-Dimethylaminopropyl)-N′-ethylcarbodiimide hydrochloride = EDC·HCl N,N-Diisopropylethylamine = DIPEA
Negative control = NC
N-Hydroxysuccinimide = NHS
Non-steroidal anti-inflammatory drugs = NSAIDs Nuclear magnetic resonance = NMR
Phosphate buffer saline (1X) = PBS
3
(DMSO containing) Diclofenac sodium salt loaded poly-L-lactide scaffold = PLA + DCF (w DMSO)
Diclofenac sodium salt loaded poly-L-lactide scaffold = PLA + DCF Diclofenac-Glycine loaded poly-L-lactide scaffold = PLA + DCF-Gly Poly-DL-lactic acid = PDLLA
Poly(lactic-co-glycolic) acid = PLGA Poly-L-lactide = PLA; PLLA
Positive control = PC
Principal component analysis = PCA
Reduced (phosphorylated) nicotinamide adenine dinucleotide = NAD(P)H Reverse phase high performance liquid chromatography = RP-HPLC Room temperature = r.t.
Scanning electron microscopy = SEM Second harmonic generation = SHG Sodium dodecyl sulfate = SDS
Solid phase peptide synthesis = SPPS Squamous cell carcinoma = SCC Stratum corneum = SC
TFA = 2,2,2-Trifluoroacetic acid
Time correlated single photon counting = TCSPC Two-photon-excitated fluorescence = TPEF Volume = v
4
GENERAL INTRODUCTION
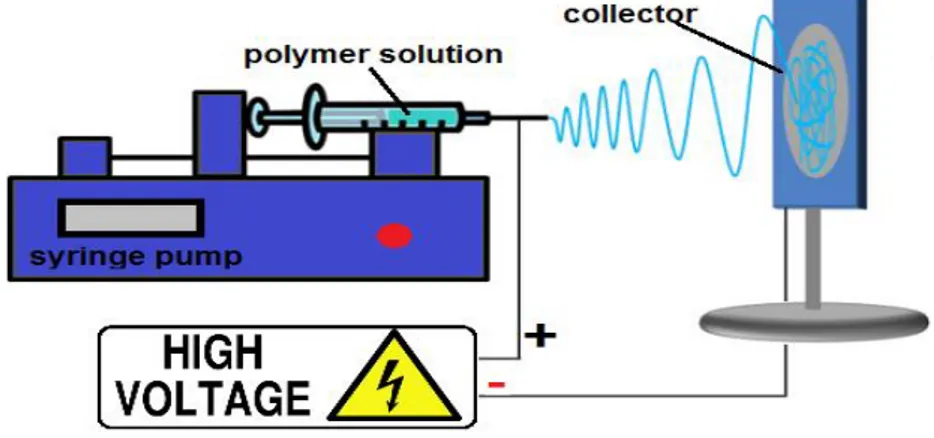
One of the greatest challenges in the biomaterials field is to obtain versatile in vitro systems that can be easily controlled and adapted in order to reproduce properties that still belong only to in vivo models [1]. To reach this purpose the information and the technologies available nowadays must be combined together taking into account all the possible variables [2]. In the last 30 years, electrospinning has gained growing interest as a polymer processing technique for applications in tissue engineering and drug delivery [3]. Electrospinning is regarded as a simple approach for creating nanofibrous networks that can mimic the structure of the extracellular matrix (ECM). Interactions between cells and ECM are crucial to cellular differentiation and in regulating cell function [4–8]. Actually, the cells typically lose some of their normal in vivo behavior when they are removed from their microenvironment and cultured in vitro. A principal objective of tissue engineering, therefore, is to recreate in an in vitro culture system some of the essential factors of the cellular microenvironment, which control and regulate cell function in vivo. In this way, the high surface to volume ratio of nanofibrous electrospun scaffolds combined with their microporous structure can favor cell adhesion, proliferation, migration, and differentiation, all of which are highly desired properties for tissue engineering applications [9]. Electrospinning is a process that utilizes a high voltage source to inject charge of a certain polarity into a polymer solution or melt, which is then accelerated toward a collector of opposite polarity [3]. A typical electrospinning setup is shown in Fig.1.
5
Fig. 1. Schematic diagram of an electrospinning setup.
The high surface to volume ratio of electrospun scaffolds can be also used for the efficient release of drugs after their incorporation in the scaffolds. After tissue engineering, drug delivery represents nowadays the second most exploited application field of electrospun scaffolds [3, 10-14]. Besides being a system that ensures a controlled and targeted drug-delivery, nanofibrous electrospun scaffolds have also the benefit of being matrices that can favor the healing process [15]. In the last 20 years a variety of electrospun fibrous scaffolds for biomedical applications have been developed [9-23]. Biodegradable and natural materials can be electrospun, and a wide range of molecules as drugs and proteins can be incorporated in the scaffolds too [9-23]. To date, electrospinning has been applied for the fabrication of nanofibrous scaffolds from numerous biodegradable synthetic polymers, such as polylactic acid [16], polyglycolic acid [17], polyurethane [18] and the copolymer poly(lactic-co-glycolic) acid [19]. Furthermore, incorporation of collagen and other biological components such as alginate [20], hyaluronic acid [21] and starch [22] into synthetic polymers was used to improve the scaffold biocompatibility or to introduce essential components of the ECM. In addition, the direct electrospinning of various biological substances, such as collagen, silk, fibrinogen, gelatin and chitosan, alone or together with synthetic polymers, has been investigated [23]. Since the scientific community has paid attention to electrospinning this technique has been regarded with constantly rising interest, and nowadays we have a great number of information about materials that can be electrospun and about their possible
6
applications [9-23]. Only some of them have been presented in this introduction and many new ones are daily investigated and published. However, the production of structures that can mimic biological tissues and samples is not the one and only goal when aiming to establish in vitro models that should be as close as possible to what happens in vivo. The development of methodologies that allow the dynamic imaging and analysis of living organisms in a neither invasive nor destructive way represents another great challenge [24]. Multiphoton microscopy (MPM) has grown extremely in this field since its first use for bioimaging [25]. MPM is a technique based on nonlinear optical processes such as two-photon-excited fluorescence (TPEF) or second harmonic generation (SHG). The simultaneous absorption of two photons is very unlikely to occur and short-pulsed femtosecond lasers operating in the near infrared (near-IR) are necessary [26, 27]. Nevertheless, the usage of this kind of lasers offers many advantages when aiming to image biological samples. For example, relative low average powers (in the milliwatts range) are needed for the analysis since the excitation is limited to the focal point. At the same time, no absorption and fluorescence occur above and below the plane of focus and so photobleaching and phototoxicity are generally avoided [27]. Not least, the use of excitation wavelength in the near-IR (700 nm or even greater) makes this technique less biologically harmful, and allows a deeper penetration in tissues or scattering samples when compared for example to confocal microscopy [27]. Moreover, many endogenous biomolecules (elastin, reduced nicotinamide adenine dinucleotide, flavin adenine dinucleotide) exhibit autofluorescence or are able to generate second harmonic signals (collagen) after excitation at specific wavelengths, and so they do not need to be stained [26-29]. All these aspects make MPM a technique that allows high-resolution imaging of untreated samples without damaging them. To date, MPM has already been employed for the in vivo evaluation of basal cell carcinoma [29]. Besides the imaging, other information can be obtained from each single pixel of a MPM acquisition if the system is specifically modified. Fluorescence lifetime imaging microscopy (FLIM) represents one of the techniques that can
7
be coupled with MPM. FLIM allows, for example, the discrimination between fluorophores exhibiting different decay times [26, 27], or helps to gain information about cellular metabolism and biological microenviroment when having specific endogenous fluorophores as target molecules [28, 29]. The demand for versatile, reliable in vitro models will increase in the years ahead. One of the biggest limits of many in vitro models already available is that they can be highly specific and sensitive for particular applications, but they cannot be extended to other fields [30]. Thus, the challenge of creating new systems, easily adaptable depending on the final desired application, and that can be analyzed unmodified with non-invasive methodologies, could help to obtain closer to in vivo, innovative in vitro models.
8
OUTLINE AND OBJECTIVES
In this PhD innovative in vitro applications for electrospun scaffolds are presented. Besides, multiphoton microscopy (MPM) coupled with fluorescence lifetime imaging microscopy (FLIM) has been employed for the imaging and the analysis of the samples, representing a neither invasive nor destructive methodology. These techniques have been combined together with the final aim of developing new versatile in vitro models. The work has been structured in three different parts. In the first part of the thesis (chapter 2) we aimed to develop a new model to assess drugs cytotoxicity in vitro. For this purpose the cytotoxic unmodified Diclofenac sodium salt (DCF) has been encapsulated in a pure poly-L-lactide (PLA) scaffold in order to obtain a system for its controlled release over time. A system ensuring a sustained drug release helps to better mimic a real therapeutic condition. The drug loaded scaffold has been then incubated together with human dermal fibroblasts (HDFs), before analyzing the cells exposed to the cytotoxic drug with MPM coupled with FLIM. These microscopies allow the imaging of unmodified biological samples without damaging them. In this thesis they have been chosen in order to develop a model to image morphological changes in the treated cells with MPM and evaluate their metabolic activity with FLIM. At the end, the use of an electrospun scaffold as a system for a specific and prolonged drug release together with the non-invasive analysis of the drug-exposed cells with MPM coupled with FLIM would offer a novel approach to investigate drugs cytotoxicity. In the second part of the thesis (chapter 3) we instead aimed to synthesize a non cytotoxic prodrug of DCF. Solid phase synthesis has been chosen representing a clean, versatile synthetic method. Moreover, we also aimed to encapsulate the synthesized DCF prodrug in a PLA scaffold and investigate in vitro its effects on HDFs comparing the prodrug to the cytotoxic DCF. To reach this purpose, a marker-free analysis of the unmodified cells based on the use of MPM coupled with FLIM is proposed. In the last part of the thesis (chapter 4), we aimed to obtain extracellular matrix (ECM)
9
mimicking scaffolds with tunable properties such as porosity and hydrophilicity and to investigate cell-material interactions in vitro with a non-invasive approach. To reach this purpose hybrid gelatin/PLA scaffolds have been produced by electrospinning, further modified and characterized. By blending naturally derived polymers with synthetic ones it is possible to obtain final structures with unique properties. Electrospinning allows the production of nanofibrous, high porous tridimensional scaffolds. Thus, this technique helps to obtain ECM-like final structures. According to our idea, by electrospinning gelatin, a biopolymer, together with PLA, a synthetic one, it may be possible to achieve final hybrid structures with unique properties that can be even further modified. Besides, we aimed to image cellular growth of HDFs on the hybrid scaffolds, and analyze their metabolic activity with MPM and FLIM, respectively. By working with hybrid electrospun scaffolds and analyzing them with a non-invasive methodology it would be possible to final obtain innovative versatile tridimensional in vitro models. On resuming, in this PhD thesis different applications of electrospun scaffolds are presented, while MPM and FLIM are proposed as imaging tools to analyze unmodified samples in a non-invasive, non-destructive and marker-free way. At the end, we aim to demonstrate how the versatility of the electrospinning process and the use of MPM coupled with FLIM offer together a broad spectrum of possibilities for the development of versatile in vitro models that can be analyzed unmodified in a non-invasive way. Particurarly, in this PhD these techniques have been combined together to finally develop in vitro models to investigate drugs cytotoxicity and cell-material interactions.
10
CHAPTER 1. MATERIALS AND METHODS
1.1. Synthesis of Diclofenac-Glycine (DCF-Gly)
Diclofenac-Glycine (DCF-Gly). 2-{2-[(2,6-dichlorophenyl)-(N-glycine)-amino]phenyl}
acetic acid (C16H14Cl2N2O3). All coupling reagents were purchased from Novabiochem
(EMD Millipore by Merck KGaA, Darmstadt, Germany). 2-chlorotrityl chloride resin preloaded with glycine (H-Gly-2ClTrt Resin), the solvents and DCF sodium salt (DCF) were purchased by Sigma-Aldrich (Steinheim, Germany). Diclofenac free acid was obtained by the dissolution of DCF in water followed by acidification and extraction [31]. For the synthesis, H-Gly-2ClTrt resin (227 mg, 0.250 mmol, substitution 1.1 mmol/g, mesh 75-150) was suspended in a solvent mixture (Dimethylformamide (DMF):Dichloromethane (DCM) = 1:1)
to a final volume of 10 mL, using a glass frittered disk sealed in glass column equipped with a
faucet. The suspension was stirred (250 rpm) for 2 hours using an orbital shaker. The solvent was then removed by filtration and 8 mL of a DCM:DMF = 1:1 solution containing 148 mg (0.5 mmol) of Diclofenac free acid, 520 mg (1mmol) of Benzotriazol-1-yloxy-tripyrrolidino- phosphoniumhexafluorophosphate (PyBOP) and 150 mg (1mmol) of 1-Hydroxybenzotriazole hydrate (HOBT) were added to the resin. After shaking the mixture manually for a few minutes, 175 µL (1 mmol) of N,N-Diisopropylethylamine (DIPEA) was added and the mixture was shaken (280 rpm) using an orbital shaker for 20 hours. Thereafter, the solvent was removed by filtration, the resin was washed (2x10 mL DMF, 3x10 mL methanol (MeOH), 2x10 mL DMF, 3x10 mL DCM), and the functionalized amino acid was cleaved by adding 10 mL of a mixture of acetic acid (AcOH):2,2,2-Trifluoroethanol (TFE):DCM = 1:1:8. The solution was shaken (250 rpm) employing an orbital shaker for 30 minutes. The cleavage mixture was then filtered, and the resin was washed with DCM (3 x 5mL). The filtrates were combined and evaporated under reduced pressure to 5% of the initial volume, and 10 mL of
11
product was lyophilized twice to remove any solvent residual, and recovered as a white fluffy powder in a final yield of 98% (86.5 mg, 0.245 mmol). The final product was characterized by nuclear magnetic resonance (NMR) and matrix-assisted laser desorption ionization mass spectrometry (MALDI-MS, analysis by Dr. Emiliano Bedini, University Federico II of
Naples). 1H-NMR (500MHz, DMSO-d6): δ= 3.61 (s, 2H); 3.75 (d, J=5.6 Hz, 2H); 6.25 (d, J=
8.0 Hz, 1H); 6.81 (t, J= 7.5 Hz, 1H); 7.00 (t, J= 7.9 Hz,1H); 7.12 (t, J =8.1 Hz, 1H); 7.18(d,
J= 7.6 Hz, 1H) 7.47 (d, J= 8.2 Hz, 2H); 8.14(s, 1H); 8.63 (t, J= 5.6 Hz, 1H) ppm; 13C-NMR
(500MHz, DMSO-d6): δ= 39.12, 41.35, 116.44, 121.14, 125.52, 125.72, 127.68, 129.61,
129.90, 130.90, 137.61, 143.38, 171.43, 172.31. MS (MALDI) calcd for C16H14Cl2N2O3+
[(M+H)+]: 353.1997, found: 353.2356; calcd for C16H14Cl2N2NaO3+ [(M+Na)+]: 376.1895,
found: 376.9826.
1.2. Nuclear magnetic resonance (NMR) analysis
The crude DCF-Gly was characterized by 1H- and 13C- nuclear magnetic resonance (NMR)
analysis. The 1H- and 13C- NMR spectra were acquired at room temperature on a Inova 500
NMR spectrometer (Varian, Agilent technologies, Inc., Palo Alto, CA, USA), equipped with a
5 mm triple resonance probe and z-axial gradients operating at 500 MHz for 1H nuclei and
125 MHz for 13C nuclei. Reference peaks for 1H and 13C spectra were respectively set to
chemical shift (δ) 2.49 and δ 39.5 for deuterated dimethyl sulfoxide (DMSO-d6). The pure
DCF spectra were instead acquired in deuterium oxide (D2O, Sigma-Aldrich), adding 2µl of 4,
4-dimethyl-4-silapentane-1-sulfonic acid (DSS) 10mM/D2O. Reference peak for 1H was in
this case set to δ of 0.00 for DSS. The residual water signal signal was removed by double pulsed field gradient spin echo (DPFGSE) pulse sequence [32], in order to increase sensitivity of the receiver and thus reveal the signals of the highly diluted DCF solution extracted from the scaffold. All the acquired spectra were processed with ACD®/ NMR Processor Academic Edition (Advanced Chemistry Development, Inc., Toronto, Canada).
12
1.3. Electrospinning
Poly-L-lactide (PLA, viscosity ~1.0 dL/g, 0.1% weight/volume (w/v) in chloroform (25°C),
Mn 59000, Mw 101 kDa, ester terminated) and gelatin (GE, gelatin from bovine skin, type B,
cell culture tested, Mw 50-100 kDa, Bloom strength ~225 Bloom) were purchased by
Sigma-Aldrich. The electrospun scaffolds were obtained starting from polymer solutions either containing or not the drug of interest too. When we aimed to obtain drug-loaded scaffolds the drug of interest was firstly allowed to complete dissolve before polymer addition. DCF-Gly was added to a final w/v% of 1%, while DCF to a final w/v% of 2% in chapter2 (when aiming to assess DCF cytotoxicity) and of 1% in chapter 3 (when aiming to compare it with DCF-Gly), respectively. After polymer(-s) addition the solutions were let stay at 37°C under magnetic stirring between 2 and 24 hours until they appeared completely clear. 1,1,1,3,3,3-Hexafluoro-2-propanol (HFIP, Sigma-Aldrich) was used as solvent for all the experiments. When using dimethyl sulfoxide (DMSO, ≥99.9%, for molecular biology, Bioreagent, Sigma-Aldrich) a 19:1 mixture represented the final HFIP:DMSO volume:volume ratio. All electrospinning experiments were performed with a customized device (Fig. 2).
Fig.2. Electrospinning customized device.
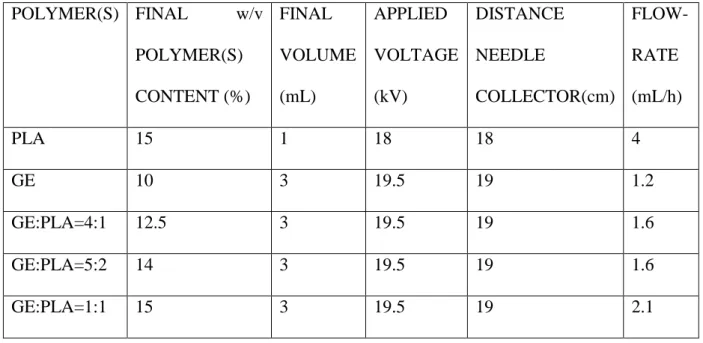
The parameters used for the electrospinning experiments are reported in Table 1. For the drug-loaded electrospun scaffolds the parameters were the same used for pure PLA. In all cases an 18G stainless steel needle was employed.
13 POLYMER(S) FINAL w/v POLYMER(S) CONTENT (%) FINAL VOLUME (mL) APPLIED VOLTAGE (kV) DISTANCE NEEDLE COLLECTOR(cm) FLOW- RATE (mL/h) PLA 15 1 18 18 4 GE 10 3 19.5 19 1.2 GE:PLA=4:1 12.5 3 19.5 19 1.6 GE:PLA=5:2 14 3 19.5 19 1.6 GE:PLA=1:1 15 3 19.5 19 2.1
Table 1. Parameters used in the electrospinning experiments.
1.4. Reverse phase high performance liquid chromatography (RP-HPLC)
All RP-HPLC analyses were performed on a Shimadzu (Shimadzu Europa GmbH, Duisburg, Germany) automated HPLC system supplied with a Jupiter C5 column (Phenomenex, 250 x 4.6 mm, 5µ, 300 Å) with a flow rate of 1 mL/min, and UV detection. A binary gradient was
used and the solvents were ddH2O with 0.1% TFA (2,2,2-Trifluoroacetic acid, Romil Super
purity Solvent (SpS™), Romil Ltd, Waterbeach, Cambridge, UK) and HPLC purity grade
acetonitrile (CH3CN, Romil Ltd). Products were eluted with a gradient of acetonitrile from 5
to 70% over 30 min (540% over the first 10 min followed by 4050% over the next 15 min and 5070% over the last 5 min). Reference chromatograms were obtained by injecting 20 µL of a 1 mg/mL solution of the compound of interest in phosphate buffer saline 1X (PBS, Gibco™ by Life Technologies GmbH, Darmstadt, Germany). The reported chromatograms were recorded at 270 nm as wavelength for UV detection.
14
1.5. Cross-linking procedure
All solvents and reagents were purchased by Sigma-Aldrich unless stated otherwise. Sodium hyaluronate (molecular weight blend: 240kDa, 480kDa and 800kDa) was obtained by Simply Essential™ (Palmerston, New Zealand). For the cross-linking a solution in EtOH 95%/
ddH2O of N-(3-Dimethylaminopropyl)-N′-ethylcarbodiimide hydrochloride (EDC·HCl,
Novabiochem®, EMD Merck Millipore) and N-Hydroxysuccinimide (NHS, Sigma-Aldrich) in equimolar ratio, both at the concentration of 50mM, was used. The electrospun scaffolds were immersed with a rate of 9mg/mL in a final mixture composed of the cross-linking and a
sodium hyaluronate/ ddH2O (or pure ddH2O) solutions in a 9:1 volume:volume ratio, as
described by Yang et al. [33]. Sodium hyaluronate/ddH2O solutions with four different final
w/v% (0.015%, 0.02%, 0.025%, 0.03%) were tested. After immersion, the scaffolds were shaken at room temperature (r.t.) for 24 hours using an orbital shaker (60 rpm). After the 24
hours, the scaffolds were gently dried on filter paper and washed with ddH2O (3x used
volume of the cross-linking mixture for each side). Thereafter, they were allowed to stay 24
hours at 37°C in ddH2O (same volume used for the cross-linking mixture) and finally washed
again with ddH2O (1x used volume of the cross-linking mixture for each side). After the
washing procedure, the excess of water was removed using filter paper. The scaffolds were
finally immersed in 70% EtOH/ddH2O (half the volume of the cross-linking mixture) for 30
minutes, then dried on filter paper and allowed to stay overnight at r.t. to complete evaporate any solvent residual.
1.6. Hyaluronic acid (HA) coating
Cross-linked GE:PLA in a 1:1 weight:weight (w:w) ratio scaffolds were fully immersed at a
rate of 9mg/mL in a 0.025% w/v HA solution in EtOH 85%/ ddH2O and gently mixed at r.t
15
at r.t., and used for further characterization either before or after being washed. The washing procedure was the same used for the cross-linked scaffolds, and described in the section 1.5.
1.7. Swelling test analysis
For each sample 16 different pieces obtained from four different scaffolds (4 pieces for each
scaffolds) were employed. Each scaffold piece was immersed in 10 mL of ddH2O and allowed
to mix at r.t. for 1 hour using an orbital shaker (60 rpm). After that time each side of the scaffold piece was let drip for 10 seconds. The excess of water was gently removed using filter paper, in case water drops on the scaffold surface were clearly visible. The rate of water absorbed by each piece was calculated according to the next shown formula (Scheme 1):
𝑆𝑤𝑒𝑙𝑙𝑖𝑛𝑔 (%) =𝑤𝑒𝑡 𝑠𝑐𝑎𝑓𝑓𝑜𝑙𝑑 𝑤 (𝑚𝑔) − 𝑑𝑟𝑦 𝑠𝑐𝑎𝑓𝑓𝑜𝑙𝑑 𝑤 (𝑚𝑔)
𝑑𝑟𝑦 𝑠𝑐𝑎𝑓𝑓𝑜𝑙𝑑 𝑤 (𝑚𝑔) 𝑥100
Scheme 1. Formula used for the swelling test.
1.8. Liquid displacement method
The porosity of the scaffolds was estimated using the liquid displacement method, as previously described [34-36]. Absolute ethanol was used as the displacement liquid. Scaffold
samples were immersed in a cylinder containing a known volume of absolute ethanol (V1) for
30 minutes. After that time, the scaffold was gently pressed to remove air bubbles and the
final volume represented by ethanol and ethanol-impregnated scaffold was recorded as V2.
Finally the ethanol-impregnated scaffold was removed and the residual ethanol volume in the
cylinder was recorded as V3. The porosity was calculated as follows (Scheme 2):
𝑝(%) =(𝑉1− 𝑉3)
(𝑉2− 𝑉3)
𝑥100
Scheme 2. Formula used for the porosity measurement according to the liquid displacement
16
1.9. Scanning electron microscopy (SEM)
The morphology of the electrospun scaffolds was determined using a scanning electron microscope (1530 VP, Zeiss, Jena, Germany). After platinum sputter coating, images were acquired at a distance of 8 mm from the detector, a voltage of 15 kV and different magnifications. The ImageJ® software supplied with the DiameterJ plug-in was used for fiber diameter and pores size/number analyses. Electron X-ray dispersive spectroscopy (EDX) analyses were instead performed on a scanning electron microscope (E-SEM XL30, FEI, Eindhoven, The Netherlands) equipped with energy dispersive X-ray spectrometer (EDAX GEMINI 4000, Zeiss). A voltage between 4 and 10kV was used to focus on the unsputtered scaffolds, and then set to 30kV for the EDX analysis. The working distance was in this case set to 10 mm from the detector. The schematic diagram of the analysis is represented in Fig.3. EDX spectra were acquired and plotted by Mr. Alessandro Laurita (University of Basilicata, Potenza, Italy).
Fig.3. Schematic diagram of the SEM and EDX analysis.
1.10. Drug release experiments
For the drug release experiments, the scaffolds were incubated at 37°C in PBS (Gibco™ by Life Technologies GmbH). In particular, 9 mg of the drug-loaded scaffolds were fully immersed in 3 mL of PBS. At different time points, 800 µL of the supernatant was taken to
17
read the absorbance. Reading wavelength was set to 272 nm. After each measurement we returned the supernatant to the scaffold containing solution. The amount of the released drug was estimated according to previously calculated calibration curves. Micro UV-cuvettes (BrandTech™ 759210, Brand™ by Thermo Scientific, Darmstadt, Germany) and a TECAN® Infinite 200 Reader were used for all the UV measurements. The final drug release profiles were obtained from 4 release experiments by each different scaffold. In all cases, the absorbance value at 272 nm was constant after the first 24 hours. This time was therefore set as the end point measurement. The amount of released drug was plotted over time. The obtained points (M(t)) were also fitted using the equation developed by Peppas et al. (Scheme 3 [37,38]). The drug amount released after 24 hours was set as M(∞) in Peppas equation.
𝑀(𝑡)
𝑀(∞) = 𝑘 × 𝑡
𝑛
Scheme 3. Peppas-Korsmeyer equation [37, 38]. k represents the release rate constant while n
the release exponent.
1.11. Contact angle measurements
Hydrophilicity of the electrospun substrates was analyzed using contact angle measurements with an OCA 40 device (DataPhysics Instruments GmbH, Filderstadt, Germany). A water drop with the volume of 2 µl was placed onto the sample and the contact angle was measured 10 seconds after the water deposition using a video setup and the SCA20 software (DataPhysics Instruments) as previously described [39]. Final results were calculated from 16 measurements obtained from 4 different scaffold pieces for each sample.
18
1.12. Uniaxial tensile testing
Electrospun scaffolds were cut into 10 mm × 20 mm rectangular pieces and clamped into the uniaxial tensile testing device (Electroforce 5500, ElectroForce® Systems Group, Bose Corporation, Minnesota, USA). The exact sample dimensions were determined before each measurement and recorded with the software for further calculations of the Young’s modulus (E-modulus) and the tensile strength. The scaffolds were pulled to failure by applying a stretch of 0.025mm/s. The Young’s modulus was calculated from the initial linear slope of the stress versus strain curve for each measurement. Measured values are presented as average±standard deviation (each group n=4).
1.13. Cell culture and seeding
All research was carried out in compliance with the rules for investigation of human subjects, as defined in the Declaration of Helsinki. This study was carried out in accordance with the institutional guidelines and was approved by the local research Ethics Committee (F-2012-078). After informed written consent was given, skin biopsies were obtained and human
dermal fibroblasts (HDFs) were isolated by enzymatic digestion as previously described [40].
Cells were cultured in Dulbecco’s modified eagle medium (DMEM, with L-Glutamine, Gibco™, Life Technologies GmbH) supplemented with 10% fetal calf serum (FCS, PAA Laboratories, Pasching, Austria) and 1% penicillin / streptomycin (100 U/mL Penicilium and 100 μg/mL Streptomycin, Life Technologies GmbH). Cells were cultured in an incubator at
37 °C and in a 5% CO2 atmosphere. Cell culture medium was changed every 3 days and cells
were passaged or seeded using trypsin-EDTA (15090046, PAA Laboratories) at approximately 70% confluence. When seeding the cells directly on electrospun scaffolds,
HDFs were seeded in number of 7x10⁵ in 12-well plates using inserts (CellCrown™,
19
1.14. Multiphoton microscopy (MPM)
A titanium-sapphire femtosecond laser (MaiTai XF1, Spectra Physics, Santa Clara, USA) was used to generate 2-photon excitation. An excitation wavelength of 710 nm and a laser power of 3.2 mW were employed. The spectral emission filter ranged from 425 to 509 nm. For the imaging of the drug encapsulation, punches (Ø =12 mm) of the scaffolds were put on Ibidi® (Ibidi GmbH, Planegg/Martinsried, Germany) glass bottom dishes (35mm) and carefully pressed on the bottom with a cover glass before analysis. HDFs morphology was assessed on
glass bottom dishes (Ibidi®, 35mm) with a density of 5 x 10⁴ cells per dish. After 24 h, the
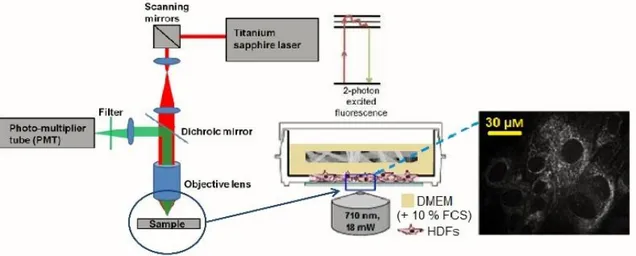
medium was removed and 2 mL of fresh DMEM (+ 10% FCS) was added. When the cells were incubated with the (drug-loaded) scaffolds, punches (Ø=28 mm) of previously sterilized (254 nm, 2 hours) scaffolds were given as well. When analyzing HDFs, the laser power was adjusted to 18 mW. The experimental setup is schematized in Fig. 4.
Fig. 4. Experimental setup for the MPM experiments.
When imaging cells directly on scaffolds, the electrospun scaffolds were instead removed from the inserts, flipped and carefully pressed on the bottom with a cover glass before analysis. For the mean gray value intensity (GVI) analysis of the drug-loaded scaffolds, ImageJ® was used as software to process and analyze the images.
20
1.15. In vitro cytotoxicity assay
According to an ISO 10993 accredited protocol, HDFs were exposed to an extract of the samples. The test was carried out as previously described [41]. In particular, the electrospun
scaffolds were sterilized by UV irradiation (254nm) for 2h. 6cm2 of each sample was then
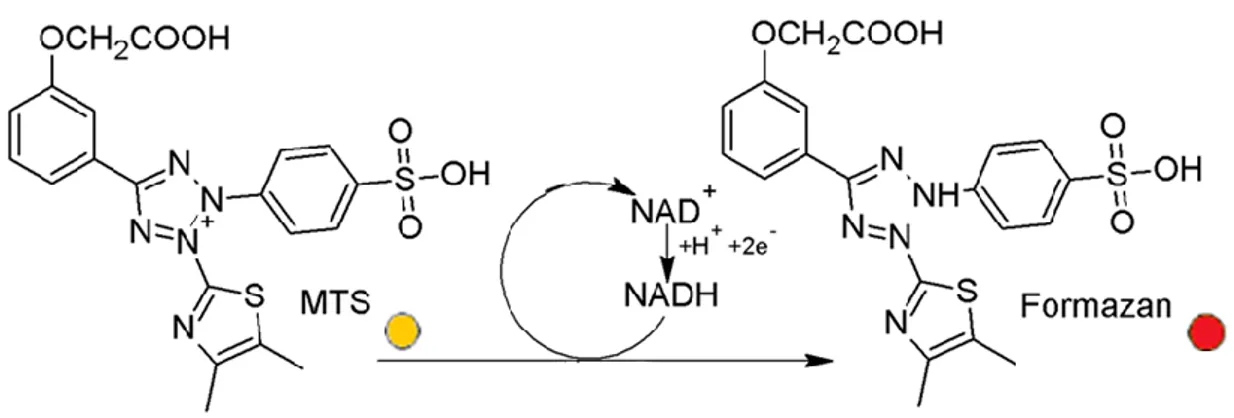
incubated in 1 mL FCS- and antibiotic-free DMEM medium. Each extract was prepared in triplicate. After 24 hours (72 hours in the case of the hybrid GE/PLA scaffolds, chapter 4), seeded HDFs were exposed for further 24 hours to the extracts supplied with 10% FCS. The extraction medium was removed and a tetrazolium salt ([3-(4,5-dimethylthiazol-2-yl)-5-(3-carboxymethoxyphenyl)-2-(4-sulfophenyl)-2H-tetrazolium], MTS, Fig. 5) assay (CellTiter 96Aqueous One Solution Cell Proliferation Assay, Promega, Mannheim, Germany) was performed as per the manufacturer’s protocol.
Fig. 5. Mechanism of the reduction reaction of MTS to Formazan.
Briefly, 20 µL of MTS solution was added to 100 µL of culture media. After incubation for 35 minutes at 37°C, the absorbance of each well was measured at 492 nm using a TECAN® Infinite 200 Reader. The test was performed for a blind, a negative control (NC; DMEM + 10% v FCS) and a sodium dodecyl sulfate (SDS, Life Technologies GmbH, 1% w/v in DMEM) treated positive control (PC). The procedure used to perform the MTS assay is schematized in Fig. 6. For analysis, the NC was set to 100%.
21
Fig.6. Schematic diagram of the protocol employed to perform the MTS assay.
1.16. Fluorescence lifetime imaging microscopy (FLIM)
FLIM was performed to assess reduced (phosphorylated) nicotinamide adenine dinucleotide (NAD(P)H) using time correlated single photon counting (TCSPC) at an excitation wavelength of 710 nm and a laser power of 18 mW. Analyzed samples were handled as described for MPM in section 1.14. FLIM data were recorded at an acquisition time of 180s for 512x512 pixels with 64 time channels. The instrument response function was recorded using urea crystals (Sigma-Aldrich) at an excitation wavelength of 920 nm and a laser power of 4.5 mW for 120s. The FLIM images were analyzed using the SPCImage software (Becker &Hickl GmbH, Berlin, Germany). A biexponential decay fitting model (Scheme 4) was
employed at each pixel since NAD(P)H has two different lifetimes represented by τ1 and τ2
[42]. A χ2<1.1 was accepted for a good fitting.
𝐼(𝑡) = 𝛼1𝑒−𝜏1 + 𝛼
2𝑒−𝜏2+ 𝐶
Scheme 4. Biexponential decay fitting used for the FLIM analysis. τ1 represents the free
NAD(P)H lifetime time, while τ2 the protein bound NAD(P)H one.
A binning factor of 6 was used in the analysis. Final data arise from 4 different donors. For each donor 3 different dishes were seeded with cells (50000 cells/dish) and 5 images were acquired per dish at each different time point. Between the different time point measurements
22
the dishes with the seeded cells were returned to 37°C/5%CO2. By the real time and
ImageStream® analyses (sections 3.2.2 and 3.2.3.), and when imaging HDFs on scaffolds (section 4.3.3.), only one donor was considered. Mean values arise in these cases from 12 images for each experimental point obtained from 3 different dishes (4 images/dish).
1.17. ImageStream® analysis
Annexin V (Annexin V Apoptosis Detection Kit eFluor™ 450) and 7-aminoactinomycin D (7-AAD, 7-AAD Viability Staining Solution) were purchased from eBioscience™ (part of Thermo Fischer Scientific, Darmstadt, Germany). By the analysis, for each group cells were obtained from three different dishes that were previously analyzed with FLIM as described in the 1.16 section. After FLIM analysis, cells were treated with trypsin-EDTA (PAA
Laboratories), recovered per centrifugation, counted and washed (PBS, GibcoTM). Thereafter,
cells were harvested and stained with Annexin V eFluor™ 450 and 7-AAD as per the
manufacturer’s protocol. In particular, the cells were re-suspended at a rate of 106
cells/mL in
Annexin V binding buffer (1X binding buffer diluted with ddH2O from the starting 10X
buffer). Samples were then stained with Annexin V-FITC (ApopNexin™ FITC, APT750a, Merck Millipore) and 7-AAD in Annexin V binding buffer (5 μL of fluorochrome-conjugated to 100 μL of the cell suspension) and left for 10 min at r.t. protecting from light. After that time, they were immediately placed on ice before analysis on an ImageStreamX Mark II (Amnis® part of Merck Millipore, Darmstadt, Germany) supplied with the INSPIRE (Amnis®) instrument controller software. The resultant data, obtained from at least 10000 cells/sample were then analyzed with the IDEAS (Amnis®) software. All samples were gated on single cells in focus (40X magnification) and then analyzed for Annexin V and 7-AAD. All ImageStream® analyses were carried out by Simone Pöschel (M.Sc., Women’s hospital, University of Tübingen, Germany).
23
1.18. Raman microspectroscopy
The Raman system and acquisition parameters used in this study were previously described [43]. Briefly, a 784 nm diode laser with an output laser power of 85 mW was focused through a water-immersion objective (60X, NA 1.2, Olympus, Tokyo, Japan). The total acquisition time per spectrum was 100 s (10x10s acquisitions). All Raman spectra were analyzed in the
range from 700 to 1800 cm-1. Spectra were background-subtracted, baseline-corrected and
vector-normalized using OPUS (Bruker Optics, Ettlingen, Germany) and Unscrambler X 10.3 (Camo, Oslo, Norway) as previously described [43]. Principal component analysis (PCA) was performed using Unscrambler X 10.3 (Camo) to reduce spectral variables and identify spectral differences among the compared samples. Seven PCs were calculated for each PCA. PC loadings were considered in detail to identify the molecular components that were relevant for the comparison of the spectra.
1.19. Data analysis
All the reported graphs were plotted using Microsoft™ Excel. All data are presented as mean±standard deviation (n=4, unless stated otherwise in the materials and methods). Statistical significance was determined by a Student’s two-tailed unpaired t-test. Either p≤0.01 (**) or p≤0.05 (*) were defined as statistically significant.
24
CHAPTER 2. IMAGING OF DICLOFENAC INDUCED CELL DEATH IN HUMAN DERMAL FIBROBLASTS USING MULTIPHOTON MICROSCOPY COUPLED WITH FLUORESCENCE LIFETIME IMAGING MICROSCOPY
2.1. Introduction
Diclofenac (as a sodium salt, DCF) is one of the most sold and used non-steroidal anti-inflammatory drugs (NSAIDs) prescribed to millions of people worldwide [44, 45]. DCF is successfully used to treat osteoarthritis, rheumatoid arthritis [46, 47] and muscle pain [48], among others [49]. Besides, Diclofenac exhibits also anticancer effects, like other anti-inflammatory drugs [50-53] and is, for example, efficiently employed for the treatment of actinic keratosis (AK) in combination with hyaluronic acid (HA) [54]. DCF pharmaceutical properties are mainly releated to its activity as a potent non-selective cyclooxygenase inhibitor [45, 55]. However, scientists have been widely researching on other possible explanations for its complex mechanism of action [56]. Many progresses have been made thus far also to explain the toxic side-effects related to (prolonged) DCF therapies [57-64]. Diclofenac toxicity is proved in both animals [58] and humans [59]. Tomic et al. [60] and a few other studies [61-64] have shown the hepato- and nephro-toxicity of DCF. Detailed analysis of single patients has revealed clinical features that could be compatible with a direct toxic effect of DCF or any of its metabolites [65], rather than a drug-allergy mechanism [66-69]. Since the liver toxicity represents the most reported complication related to a prolonged or high-dosage use of DCF, in vitro studies have been mainly carried out using hepatocytes as target cells. To date, many different studies with cultured hepatocytes from various species have proved that high DCF concentrations (400 µM to 500 µM) are able to induce acute cell injury [70-77]. Recently, in vitro toxicity of DCF has been demonstrated also in other cell lines [78-82]. However, the mechanism behind DCF acute cellular toxicity has not been clearly determined, and the use of such high concentrations has been questioned, as it doesn’t mimic a clinical
25
therapeutic situation. While DCF hepato- [61-68, 83-85] and nephro-toxicity [58-60] has been widely investigated, not that much is known about its activity as an anti-cancer drug [49-54]. For example, the mode of action of DCF in combination with HA in the local treatment of cutaneous AK is largely elusive, but its chemotherapeutic activity could be associated with drug induced apoptosis [86, 87]. In this thesis we proved DCF induced cell death in human dermal fibroblasts (HDFs) using a new effective, non-destructive in vitro model. Herein, HDFs were incubated together with a DCF-loaded electrospun poly-L-lactide (PLA) scaffold, which ensured to obtain a controlled drug release over 24 hours. The DCF exposed cells were imaged using multiphoton microscopy (MPM) and their metabolic activity was investigated using fluorescence lifetime imaging microscopy (FLIM). For the FLIM and MPM analysis reduced (phosphorylated) nicotinamide adenine dinucleotide (NAD(P)H), an endogenous fluorophore, was chosen as target [88]. NAD(P)H is mainly present in the mitochondria and directly involved in the ATP synthesis [89] which are both damaged in the cells after DCF exposure [90, 91]. Induced apoptotic and necrotic events were observed and then confirmed with ImageStream® analysis [92]. Besides, we investigated how the use of dimethyl sulfoxide (DMSO) as a co-solvent system in the electrospinning affected the scaffold morphology and its properties. Herein, we demonstrated that DMSO, a high boiling solvent, was not completely evaporated under our experimental conditions, thus being retained in the electrospun fibers. However, after water immersion DMSO diffused from the scaffold which regained the morphology typical of electrospun structures. Moreover, when the drug-loaded scaffolds were characterized we found that while diffusing DMSO enhanced DCF initial burst release. This aspect could be of great interest when producing nanofibrous scaffolds for drug delivery by electrospinning, also considering that DMSO is efficiently employed as a skin penetration enhancer in many pharmaceutical formulations [93, 94]. The effects of the presence of DMSO on the scaffold morphology were investigated using scanning electron microscopy (SEM). Besides, the effective release of DCF and DMSO from the electrospun
26
scaffolds was proved with energy-dispersive X-ray spectroscopy (EDX), reverse-phase high performance liquid chromatography (RP-HPLC) and nuclear magnetic resonance (NMR). The obtained results suggest that the here described model could represent an interesting way to control the diffusion of encapsulated bio-active molecules and test them using a marker-free, non-invasive approach.
2.2. Results
2.2.1. Production and characterization of the scaffolds
2.2.1.1. Electrospinning
PLA was dissolved in HFIP (+DMSO) either alone or in presence of DCF. Various electrospinning parameters were tested and those leading to stable Taylor’s cone and jet as well as to smooth and uniform fibers (Fig.7 A-C, G-I and Fig.8 A-C, G-I) were then used throughout the study. The conditions were first defined for pure PLA and then adapted for the other (drug-loaded) scaffolds.
2.2.1.2. SEM and fiber diameter analysis
The morphology and fiber sizes of the scaffolds, before and after PBS immersion (after release, a.r.) was investigated using SEM (Fig.7 A-C, G-I and Fig.8 A-C, G-I). It was possible to generate scaffolds with a random fiber orientation. In all conditions, we obtained uniform scaffolds (Fig.7 A-C and Fig.8 A-C) but when using DMSO the fibrous morphology of the electrosun scaffolds appeared altered (Fig.7 A, C and Fig.8 A, C). After drug release (Fig.7 G-I and Fig.8 G-G-I), morphological changes were clearly visible in the samples electrospun using DMSO (Fig.7 G, I and Fig.8 G, I). In all cases, after the release experiment, the fibers were still uniform and randomly oriented (Fig.7 G-I and Fig.8 G-I). When using no DMSO the
27
fiber size was not affected after the drug release (PLA + DCF: 143±6 nm versus PLA + DCF a. r.: 146±9 nm; p=0.74). In all other cases there was a significant decrease in fiber size after 24 hours PBS immersion (PLA (w DMSO): 317±6 nm versus PLA (w DMSO) a.r.: 179±7 nm; p=0.004; PLA + DCF (w DMSO): 187±10 nm versus PLA + DCF (w DMSO) a.r.: 134±6 nm; p=0.008). Besides, when encapsulating DCF the fiber size significantly decreased (PLA + DCF (w DMSO) versus PLA (w DMSO), p=0.005). This happens probably because of the use of DCF as sodium salt, which enhances the conductivity of the solution used for the electrospinning experiment. A similar behavior was found by Kim et al. when working with the antibiotic cefoxitin sodium [95]. All the significant differences observed in the fiber size are shown in Fig.7M (**: p≤0.01).
2.2.1.3. Drug release experiments
2.2.1.3.1. UV-monitoring and fitting using Peppas equation
The ability of the scaffold to release the drug was firstly investigated by UV detection. The absorbance at 272 nm of the PBS solution, in which the drug-loaded scaffold was immersed, was constantly monitored for the first 6 hours and then was measured again after 24, 48 and 72 hours. In order to be sure that the absorbance was not affected by the release of solvent residuals, absorbance values were corrected against a blank represented by a PBS solution containing a pure PLA or a PLA (w DMSO) scaffold for the PLA + DCF scaffold and the PLA + DCF (w DMSO) scaffold, respectively. In all cases by the release experiments, the absorbance value at 272 nm was constant after the first 24 hours. This time was therefore set as the end point measurement. The amount of released drug was plotted over time (Fig.7N). The obtained points were also fitted using the equation developed by Peppas et al. (Fig.7O). The drug amount released after 24 hours was set as M(∞) in Peppas equation. Peppas equation offers a simple model to study the release mechanism of incorporated molecules from
28
polymers [37, 38, 96, 97]. No significant differences (p=0.82) in the release exponent (n) could be found between the sample containing DCF alone and the one containing DCF and DMSO, since the obtained values were 0.10±0.02 and 0.10±0.03 (p=0.87), respectively. In both cases the exponent values suggest that the release undergoes a controlled diffusion [97]. According to our results, the use of DMSO affects the initial burst release of the drug since
the obtained values for the release rate constant (k) were 0.67±0.4 h-0.1 and 0.42±0.3 h-0.1
(p=0.003), when having DMSO or not, respectively.
2.2.1.3.2. RP-HPLC
The effectiveness of the DCF release from the scaffolds was verified using RP-HPLC. A
binary gradient of CH3CN/ddH2O from 5 to 70% over 30 minutes (540% over the first 10
min followed by 4050% over the next 15 min and 5070% over the last 5 min) was used
allowing a good separation for pure DCF in PBS (retention time: 19.7 min by 46.7% CH3CN/
ddH2O, Fig.S1A). The same conditions were then used also for the elution of the supernatant
of the scaffold extracts. In all cases, DCF with a high purity could be eluted indicating that the encapsulated drug doesn’t undergo any side-reaction during the electrospinning process. Chromatograms are reported in the supplementary materials section (Fig.S1B and Fig.S1C for DCF, released from pure PLA and PLA with DMSO, respectively).
29
Fig.7. A-C and G-I. SEM images of the electrospun scaffolds at 2kX magnification before
(A-C) and after (G-I) 24h PBS immersion (after release, a.r.). Scale bars equal 50 µm. A. Pure PLA (w DMSO); B. PLA + DCF; C. PLA + DCF (w DMSO). G. Pure PLA (w DMSO) a.r.; H. PLA + DCF a.r.; I. PLA + DCF (w DMSO) a.r. D-F and J-L. Histograms for the fiber distribution of the electrospun scaffolds before (D-F) and after (J-L) 24h PBS immersion
30
(a.r.). D. Pure PLA (w DMSO); E. PLA + DCF; F. PLA + DCF (w DMSO). J. Pure PLA (w DMSO) a.r.; K. PLA + DCF a.r.; L. PLA + DCF (w DMSO) a.r. M. Fiber mean diameter comparison after ImageJ® segmentation and DiameterJ® analysis. N-O. Drug-release profile (N) and fitting according to Peppas-Korsmeyer model (O) for the PLA + DCF scaffold (red squares) and the PLA + DCF (w DMSO) scaffold (blue rhombi).
2.2.1.3.3. Electron X-ray dispersive spectroscopy (EDX)
The effective DCF encapsulation and its release from the PLA scaffolds were verified with EDX analysis as well (Fig.8 D-F and Fig.8 J-L). Carbon (C) and Oxygen (O) signals arose mainly from PLA and did not allow us to assign them to the other molecules. Sulfur (S) signal was attributed to the presence of DMSO. Chlorine (Cl) and Sodium (Na) revealed instead the presence of DCF (Fig.8 D-F). After 24 hours PBS immersion (after release, a.r.), neither S nor Cl and Na signals could be detected (Fig.8 J-L), suggesting the diffusion of DMSO and DCF, respectively. Entire EDX spectra are reported in the supplementary materials (Fig.S2A-S6F) together with two example SEM images of the unsputtered scaffolds acquired to focus on the samples (Fig.S3).
31
Fig.8. A-C and G-I. SEM images of the electrospun scaffolds at 10kX magnification before
(A-C) and after (G-I) 24h PBS immersion (after release, a.r.). Scale bars equal 10 µm. A. Pure PLA (w DMSO); B. PLA + DCF; C. PLA + DCF (w DMSO). G. Pure PLA (w DMSO) a.r.; H. PLA + DCF a.r.; I. PLA + DCF (w DMSO) a.r. D-F and J-L. EDX spectra of the electrospun scaffolds before (D-F) and after (J-L) 24h PBS immersion (after release, a.r.) between 0 and 3.3 keV. D. Pure PLA (w DMSO); E. PLA + DCF; F. PLA + DCF (w DMSO). J. Pure PLA (w DMSO) a.r.; K. PLA + DCF a.r.; L. PLA + DCF (w DMSO) a.r.
32
2.2.1.3.4. Nuclear magnetic resonance (NMR) analysis
NMR analysis of the supernatant was done, after water removal by freeze-drying. PBS salts
cannot be revealed by 1H-NMR, and so did not affect the analysis. DCF 1mg/mL in D2O was
used as reference for signal comparison (Fig.9A). According to the NMR results, DCF diffused from both pure PLA (Fig.9B) and PLA with DMSO (Fig.9C). DMSO could be detected as well (singlet, δ = 2.71 ppm [98]) after its diffusion from PLA with DMSO (Fig.9C). The water signal (singlet, δ = 4.79 ppm [99]) could not be completely removed when using samples from the release experiments because the samples were too diluted (Fig.9B and 15C).
Fig.9. A. 1H-NMR spectra in D2O of pure DCF. B, C. 1H-NMR spectra of the extracts in PBS
of DCF-loaded PLA (B) and DCF-loaded PLA (w DMSO) (C) scaffolds after water removal by freeze-drying.
33
2.2.1.4. Tensile tests
PLA is an elastic and electrospinnable polymer. Pure electrospun PLA was previously characterized [88]. Representative stress-strain experimental curves are shown in Fig.10A-C. Generally, the mechanical properties of PLA were affected by the addition of DCF and DMSO (Fig.10A-E). The DCF encapsulation lowered the scaffold elasticity (Fig.10D, E-modulus, PLA + DCF: 133.8±13.6 MPa versus PLA: 24.4±9.7 MPa [88], p=0.0002; PLA + DCF (w DMSO): 74.8±9.7 MPa versus PLA (w DMSO): 14.0±1.2 MPa, p=0.004). Opposite, DMSO retain improved scaffolds elasticity, lowering the E-modulus (Fig.10D, PLA (w DMSO) versus PLA, p=0.0012; PLA + DCF (w DMSO) versus PLA + DCF, p=0.006). Generally, the E-modulus decreased with the increasing fiber diameter as previously described [100, 101]. However, the DCF encapsulation strongly increased the E-modulus, making the scaffold structure less elastic (Fig.10D). Not so big differences could be found in regards to tensile strength (Fig.10E). Nevertheless, pure PLA showed the highest tensile strength (1.84±0.19 MPa [88]). Actually, the addition of either DCF or DMSO as well as both of them led to significantly lower tensile strength values (Fig.10E, PLA (w DMSO): 0.83±0.18 MPa; PLA + DCF: 1.02±0.19MPa; PLA + DCF (w DMSO): 1.37±0.17 MPa) when compared with pure PLA (p≤0.01 in all cases). Moreover, the scaffold containing both DCF and DMSO showed a tensile strength significantly higher when compared to the other PLA scaffolds containing only one of the two encapsulated molecules (Fig.10E, PLA + DCF (w DMSO) versus PLA (w DMSO), p=0.0034; PLA + DCF (w DMSO) versus PLA + DCF, p=0.0073). According to these results we suggest that the DCF encapsulation alters the PLA mechanical properties, but no direct correlations between the fiber morphology and the scaffold properties can be determined. On the other hand, DMSO encapsulation lowers E-modulus and tensile strength values. That finding can be correlated with the increase in the fiber size (Fig.7M) according to literature data [100, 101].
34
2.2.1.5. Contact angle measurements
Wettability of the scaffolds was determined using contact angle measurements. The analysis showed that the hydrophobicity of the scaffolds was not significantly affected by the presence of DCF and/or DMSO (Fig.10F). No significant changes were observed in the contact angle values for all the scaffolds characterized in this work (Fig.10F, PLA w DMSO: 132±2°; PLA + DCF: 129±3°; PLA + DCF w DMSO: 131±3°) when compared to pure PLA (131±7°, [88]). The measurements suggest that all the scaffolds remained hydrophobic (Fig.10E).
Fig.10. Analysis of the mechanical/physical properties of the electrospun scaffolds. A-C.
Representative stress-strain curves of: a DMSO-containing PLA (PLA (w DMSO)) scaffold (A), a DCF-loaded PLA (PLA + DCF) scaffold (B) and a DMSO-containing DCF-loaded PLA (PLA + DCF (w DMSO)) scaffold (C). D.Comparison of the elastic modulus (E-modulus) among the PLA (w DMSO), PLA + DCF and PLA + DCF (w DMSO) scaffolds. E. Comparison of the ultimate tensile strength among the PLA (w DMSO), PLA + DCF and PLA + DCF (w DMSO) scaffolds. F. Contact angle values, after water drop deposition, of the PLA (w DMSO), PLA + DCF and PLA + DCF (w DMSO) scaffolds.
35
2.2.1.6. In vitro cytotoxicity
The biocompatibility of the modified scaffolds was assessed with a MTS assay [102] using a standardized protocol and HDFs as cells, as previously described [88]. Accordingly, we determined that the use of DMSO did not affect PLA scaffold biocompatibility (cell proliferation: PLA (w DMSO) = 102±7%). On the other hand, the DCF containing scaffolds showed a severe cytotoxicity towards HDFs (cell proliferation: PLA + DCF = 12±1%; PLA + DCF (w DMSO) = 13±2%, p≤0.01 in both cases when compared to the NC). Thus, we assessed the scaffolds cytotoxic effects as a result of the DCF release, while the DMSO concentration in the extracts was probably too low to determine cytotoxic effects [103-105]. The results of the MTS assay are reported in the supplementary materials (Fig.S4).
2.2.2. MPM and FLIM analysis
MPM and FLIM analyses were performed to analyze endogenous NAD(P)H in HDFs and to detect metabolic changes and cytotoxic effects in the target cells due to the incubation together with the drug-loaded scaffolds. In order to demonstrate that the observed cytotoxicity would be due to DCF and not to the presence of the scaffold itself limiting, for example, the oxygen exchange, the measurements were carried out either in presence or in absence of a pure PLA scaffold by using as control HDFs on glass. Besides, the treated cells were analyzed also after the removal of the scaffold. In all cases, no significant differences after 24 hours
incubation time in the α1(%) and τs values could be found between the compared samples
(Fig.S5). Once assessed that the presence of the scaffold did not affect the FLIM measurements, we decided to investigate the supposed DCF cytotoxicity towards HDFs after its release from PLA scaffolds. The DCF-loaded scaffolds used by the FLIM analysis were all electrospun without DMSO, in order to limit the variables and to ascribe the potential cytotoxicity only to DCF. The in vitro system described in this thesis ensured us to have a
36
controlled drug release over 24 hours. Two different time points, 6 and 24 hours, were chosen. The first one represented the reaching of a maximum in the drug release profile (Fig.7N), while the second one represents the incubation time used for the MTS assay. The control (CTRL) was also measured after 6 and 24 hours (times refer to the incubation time after having changed the culture medium, 24 hours after cell seeding). However, since no
significant differences in the α1 and τs values could be found in the CTRL for the two
different time points, only the values obtained after 6 hours incubation were analyzed. Besides the FLIM analysis, MPM images were acquired to monitor cell morphology. Cell morphology appeared altered in the treated cells already after 6 hours (Fig.11B) when compared to the control (Fig.11A). However, cell showing the normal elongated fibroblasts shape could still be imaged after the first 6 hours DCF exposure (Fig.11B). After 24 hours cell morphology appeared completely different from the one of the control. In particular, cells that showed a nuclear and cytoplasmic condensation were assessed as apoptotic (Fig.11C), while cells showing both swelling and vacuolation of the cytoplasm were considered to undergo necrosis (Fig.11D), as previously described by Seidenari et al. [28]. According to the FLIM analysis
already after 6 hours a significant increase in the τ1 values (Fig.11E, τ1 CTRL: 0.63±0.02 ns
versus τ1 DCF/6h: 0.72±0.02 ns, p=0.003) as well as a significant decrease in the α1% values
could be detected for the DCF-exposed cells, when compared with the control (Fig.11F, α1%
CTRL: 73.3±0.9% versus α1% DCF/6h: 63.9±1.1%, p=0.002). After 24 hours incubation a
significant increase in the τ1 values could still be found for the treated sample when compared
with the control (Fig.11E, τ1 CTRL: 0.63±0.02 ns versus τ1 DCF/24h: 0.74±0.02 ns,
p=0.0025). On the other side, the difference in the τ1 values after 24 hours was not significant
when compared to the ones obtained after 6 hours (Fig.11E, τ1 DCF/6h: 0.72±0.02 ns versus
τ1 DCF/24h: 0.74±0.02 ns, p=0.47). The α1% values of the samples after 24 hours incubation
37
73.3±0.9% versus α1% DCF/24h: 62.1±1.2%, p=0.0016) and 6 hours exposed cells (Fig.11F,
α1% DCF/6h: 63.9±1.1% versus α1% DCF/24h: 62.1±1.2%, p=0.0084).
Fig.11. MPM imaging (A-D) and FLIM analysis (E, F) of HDFs exposed to a DCF-loaded
PLA scaffold. A-D Untreated HDFs (A); DCF-treated HDFs after 6h incubation time (B); DCF-treated HDFs assessed as apoptotic (C) and necrotic (D) after 24h incubation time. Scale
bar equals 20 µm. E. Comparison of the τ1 values among control (CTRL) and DCF-treated
samples after 6 and 24h. F. Comparison of the α1 (%) values among CTRL and DCF-treated
samples after 6 and 24h. G. Comparison of the nucleus diameter values among normal untreated fibroblasts (CTRL) and DCF-treated cells assessed either as apoptotic or necrotic.
According to these morphological changes, we were also able to determine changes in the nucleus diameter [28] of the fibroblasts after the 24 hours DCF exposure (Fig.11G). In particular, cells assessed as apoptotic showed a significant decrease in the nucleus diameter when compared to the untreated samples (Fig.11G, DCF/apoptotic: 7.8±1.7 µm versus CTRL: 13.1±2.2 µm, p=0.007). On the other hand, necrotic cells had an increase in the nucleus diameter (Fig.11G, DCF/necrotic: 18.7±1.4 µm versus CTRL, p=0.008) due to a significant cytoplasmatic swelling.
38
2.2.3. ImageStream® analysis
DCF induced cell death was proved with ImageStream® since it is considered a reliable method [92]. In particular, Annexin V was used as a marker for apoptosis (blue staining) and 7-AAD for necrosis (red staining, Fig.12A). It was also possible to distinguish between early and late apoptotic cells, since the first ones could be only stained with Annexin V (Fig.12A) while the second with both Annexin V and 7-AAD (Fig.12A). According to the ImageStream® analysis both apoptotic and necrotic events occurred, but while about 40% (39.4±4.7%, Fig.12B) of the cells did undergo necrosis already after 6 hours DCF exposure, only obout 10% of them were either early (4.6±0.7%, Fig. 18C) or late apoptotic (6.8±0.4%, Fig.12D), after 6 hours DCF exposure. After 24 hours about 50% of the cells were instead either early (21.1±3.8%, Fig. 18C) or late apoptotic (28.2±2.3%, Fig.12D). This observation agrees with previous works that show how necrotic events generally occur earlier than apoptotic ones after cell exposure to toxic hazards [106, 107]. However, we believe that the real percentage of dead cells in the DCF treated samples would be greater, since we only took into account the cells that were still adherent, which are the same analyzed by FLIM. Finally, about 20% of dead cells could be found already in the control (20.8±2.2% and 25.1 ±2.3% after 6 and 24 hours, respectively, Fig.12B) mainly because of being out of the incubator during the FLIM measurements as well as by preparing the samples for the ImageStream® analysis. Besides, also the chosen cell harvesting method could affect the results of the analysis leading to an overestimation of the necrotic cells [108]. Nevertheless, the percentage of the apoptotic (either early or late) and of the total dead cells was significant higher in the treated samples when compared to the control, both after 6 (Fig.12B, DCF treated: 50.8±5.3% versus CTRL: 20.8±2.2%, p=0.008) and 24 hours (Fig.12B, DCF treated: 56.7±5.6% versus CTRL: 25.1 ±2.3%, p=0.007).
39
Fig.12. ImageStream® analysis of HDFs exposed to a DCF-loaded PLA scaffold. A. Staining
with Annexin V (blue) and 7-AAD (red) allowed us to distinguish among healthy (blue-; red-), necrotic (blue-; red+), early (blue+; red-) and late (blue+; red+) apoptotic cells. B-D. Data analysis of the cells after staining and counting (CTRL: green stripes; DCF treated: red dots): total percentage of dead cells (B); early (C) and late (D) apoptotic cells percentage.
2.2.4. MPM and FLIM real time analysis
Since we could find a strong significant change in both α1 (%) and τ1 values, as well as in the
cell morphology of HDFs, already after 6 hours incubation together with a DCF-loaded scaffold, we decided to analyze the treated cells over the first 6 hours exposure too. Using a IBIDI® heating system we analyzed always the same cells with MPM and we could image the morphological change due to the induced cell death (Fig.13 A-L).