Journal of Physics: Conference Series
PAPER • OPEN ACCESS
Influence of the convective coefficient on the determination of thermal
transmittance through outdoor infrared thermography
To cite this article: I Nardi et al 2020 J. Phys.: Conf. Ser. 1599 012016
37th UIT Heat Transfer Conference
Journal of Physics: Conference Series 1599 (2020) 012016
IOP Publishing doi:10.1088/1742-6596/1599/1/012016
Influence of the convective coefficient on the determination of
thermal transmittance through outdoor infrared
thermography
I Nardi1, T de Rubeis2,D Paoletti2 and D Ambrosini2
1 ENEA Casaccia Research Center, via Anguillarese, 301 – I 00123 S.M. di Galeria, Rome, Italy
2 University of L’Aquila, DIIIE Dept., P.le Pontieri, 1 – I 67100 L’Aquila, Italy Corresponding author e-mail: [email protected]
Abstract. Several studies and correlations for the convective heat transfer coefficient (CHTC) are available in literature and in handbooks, depending on type of convection, wind speed range or on the test rigs from which they are derived.
The importance of accurate evaluation of CHTC, especially at the building façades, has been highlighted in the recent years, due to the need for reliable measurement of buildings’ heat transfer capability. This study aims at underlining the importance of proper CHTC values for the determination of the building envelope thermal transmittance (U-value) via infrared thermography (IRT). To this scope, firstly an overview on convective heat transfer coefficient is given; then, some CHTC models, chosen from literature, are analyzed at different wind speed classes. Subsequently, such models are employed in two formulas proposed in literature for the U-value measurement via IRT, by using data from previous experimental campaign carried out in controlled environment. Results were compared, and significant deviations were found: one of the employed approaches and formulation is less sensitive to the correlation adopted for the convection expression, amongst those considered and in the wind speed range analyzed. This constitutes an advantage, since one of the weak points of the IRT method is the convection expression itself.
1. Introduction
The need for accurate evaluation of building energy losses has become crucial for reliable energy plan at urban, regional and national scale. The heat loss through the envelope, identified by the thermal transmittance value (U-value), is driven by the three heat exchange mechanisms: convection (due to the air mass flowing near the walls that face the indoor and the outdoor environments); conduction (from surface to surface, and due to materials capability of conducing heat); radiation (that accounts for the thermal radiation flux in the long-wave band) [1,2].
Methods and techniques for reliable measurement of conductive heat flux losses through the building envelope are available [3], and also the radiative contribution is easily retrievable [4].
The main issues concern the evaluation of the convective contribution, for which the knowledge of the convective heat transfer coefficient hc (CHTC) is needed. Regarding the latter, researchers agree that its evaluation in crucial for reliable U-value measurement, and many studies (performed either in laboratory or in situ) have been carried out up to now [5-7].
The evaluation of CHTC is a complex matter, since it depends on: (i) type of fluid; (ii) type of convection (either free or forced); (iii) type of regime (either laminar or turbulent); (iv) surface layout or displacement (vertical, horizontal, sloped) and shape (flat, cylindrical, etc).
For this reason, several ways to express the hc are available, both in literature and in handbooks, varying for the limits of applicability, the governing hypothesis, and the set up employed for the evaluation [1, 8-11]. Many expressions for the convective heat transfer coefficient for building evaluation purposes simply refer to windward and leeward facades [12]. This approach aims at being as much general as possible, depending on the wind direction. The challenge, however, is to customize
37th UIT Heat Transfer Conference
Journal of Physics: Conference Series 1599 (2020) 012016
IOP Publishing doi:10.1088/1742-6596/1599/1/012016
expressions depending on the shape factor of the structure, which influences the wind flow across the surfaces, as done in [13].
The importance of proper expressions or ways to evaluate the convective heat transfer coefficient occurring at building envelope has been highlighted in several works dealing with the U-value assessment [14]. Particularly, researches that employ the infrared thermography (IRT) for the thermal transmittance evaluation claim the need for accurate correlation for the convective contribution. Such issue, well known by those who employ IRT, is increased when outdoor thermographic campaigns are carried out.
Hence, the aim of this work is the investigation of the influence: (i) of different hypotheses on air speed and (ii) of different expressions for the convective heat transfer coefficient; on thermal transmittance evaluated by IRT outdoor thermography.
In this view, the paper is structured as follows: section 2 describes the outdoor IRT approaches and the methodology followed, section 3 is devoted to the analysis of the convective coefficient correlations adopted, whose influence on thermal transmittance assessment is studied in section 4. Finally, conclusions are drawn in section 5: results show that, depending on the adopted CHTC correlation and on the outdoor IRT approach followed, final thermal transmittance can vary by far from expected values.
2. IRT technique for the U-value assessment
In the last decade, a novel methodology for the U-values assessment has been proposed in literature, based on infrared thermography. This method is mainly referred to as IRT (Infrared Thermography) or ITT (Infrared Thermography Technique).
Many studies have been published on this topic; given a recent review [14], it is possible to identify two main approaches to the technique: performing IRT from inside the structure [15-17], or from the outside [14, 18-20].
According to the IRT method, the indoor and outdoor air temperatures and wall temperature, whether from the inner or from the outer side, are retrieved by employing an infrared camera, that is a device that converts the infrared radiant energy emitted from the target object into an image whose color variation /hues are related to the target apparent temperature distribution. Such temperatures, together with other quantities like wind speed or convective coefficient, wall emissivity and so on, are employed in correlations (formulas) that express the wall’s thermal transmittance.
To resolve the debate of the best feasibility between indoor and outdoor measurement campaign is still not possible.
On one hand, performing measurements from indoor ensures quite stable environmental conditions (i.e. air temperature, air speed, reflected temperature) but entails the need for entering the building to be measured with possible bother for the occupants. On the other hand, outdoor IRT has the advantage of performing measurements without entering the structure, but boundary conditions might influence the measurements, and, therefore, the final result.
Whilst in the first approach air movements are reduced, due to the IR camera placement inside the room to be checked, in the second approach acquisitions are taken from the outside, therefore convection might play a key role in the evaluation of the thermal transmittance.
However, those [18-21] who perform outdoor IRT have obtained results under certain environmental conditions or by imposing some practical hypothesis, like for instance the absence of convective movements or negligible wind speed in proximity of the investigated wall.
In [14, 18-20] Equation 1 is employed; the heat balance of the wall is expressed by the sum of the radiative and convective exchange from the wall to the outdoor air. The latter is expressed by a Jürges’ equation simplification. Being (Ts) the wall/surface temperature, (Tae) and (Tai) the outdoor and indoor air temperature, respectively, (v) the wind speed, (ε) the wall emissivity and (σ) the Stephan-Boltzmann constant, the equation is:
= ( − ) + 3.8054 ( − )
37th UIT Heat Transfer Conference
Journal of Physics: Conference Series 1599 (2020) 012016
IOP Publishing doi:10.1088/1742-6596/1599/1/012016
In the approach followed by Dall’O’ et al [21], and expressed by Equation 2, the thermal transmittance is evaluated as:
=ℎ ( − )
− with ℎ = 5.8 + 3.8054 (2)
Starting from the analysis of the correlations proposed in Albatici [20] and Dall’O’ [21], two main concerns are evident: (i) the differences in the way the heat balance of the wall is expressed; (ii) the difference in the way the convective contribution is accounted. It is worth mentioning that Equation 2 employs a Jürge correlation for h, while Equation 1 uses its simplification.
2.1. Methodology
The twofold aim of this work is: (i) assessing the influence of different hypotheses on convection in the outdoor IRT approach; (ii) assess the sensibility of Equation 1 and Equation 2 to the convection expression. In other words, one of the scopes is to understand how the thermal transmittance evaluated by using the Jürge’s correlation in Equation 1 and Equation 2 can vary when other expressions for CHTC are employed. These expressions can be structured similarly to Jürge’s correlation (linear correlations), or can be more complex (exponential correlations). These aims become relevant especially when low air speed are considered [21].
The kickstart of the research has been a reviewer comment on a previously published paper [19], asking to detail the possible influence of convection on results. Therefore, in this contribution such issue has been addressed. Hence, this work widens previous results and outcomes [19].
Particularly, in [19] four approaches were followed, adapting two indoor IRT procedures to outdoor consideration. In the present work, only the two outdoor methodologies (proposed by Albatici [20] and Dall’O’ [21]) are considered.
A preliminary analysis of the dependence of convective coefficient on wind speed is given, taking into account some relevant correlations for CHTC proposed in literature.
Then, the correlations are employed respectively in Equation 1 and 2 by substituting the convective term. The final assessment is carried out considering low air speed (less than 0.4 m/s), since the set up employed in [19] allowed to have negligible wind speed at wall surface, being the specimen placed inside a facility that acted as outdoor environment. Therefore, being the conditions at surface level controlled, air speed has been considered negligible [19]. This hypothesis has been supported by a simple proof: under an aluminum foil, that was placed on the wall exposed to air at lower temperature, a slight heat plume rose. This was due to the heating of the air between the foil and the wall. Given the low temperature increase (assessed by infrared thermography) and the vertical layout of the plume, it is reasonable to hypothesize that the air speed in proximity of the wall was negligible.
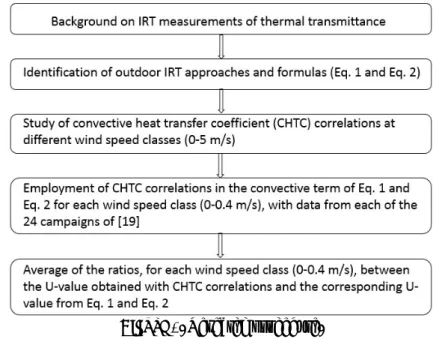
The procedure followed to assess the impact of the convection expression on the final U-value is detailed below.
1. Each correlation of Table 1 was evaluated for the air speeds considered (0 m/s to 0.4 m/s with a step of 0.1 m/s);
2. Convective contributions evaluated in Step 1 were employed in Equation 1 and Equation 2, for obtaining, with “modified” equations, the U-value;
3. “Modified” Equation 1 and Equation 2 were used for the 24 campaigns of [19];
4. The U-value has been arithmetically averaged on the 24 campaigns, for each air speed class, and each correlation;
5. The obtained U-values have been divided by the corresponding U-values calculated in [19]; 6. The ratios obtained in Step 5 have been plot.
37th UIT Heat Transfer Conference
Journal of Physics: Conference Series 1599 (2020) 012016
IOP Publishing doi:10.1088/1742-6596/1599/1/012016
Figure 1. Research procedure. 3. Convective coefficient expressions
Several works in literature concern the way to express convective coefficient; however, there is a paper [22] that aims at collecting the more relevant, grouped as linear or power law expressions of the wind speed, and as expressions involving the Reynolds number.
In the present work, it has been decided to employ only the expressions of the first group, therefore the general expression of the convective coefficient is (Equation 3):
ℎ = + ∗ ^ (3)
Where (a), (b) and (n) are constants and (v) is the air speed (expressed in m/s).
This, in order to have easy and manageable expressions of the CHTC, to be used in Equation 1 and Equation 2. However, there are literature examples where expressions of the second group are employed in indoor IRT [17].
The chosen correlations, named by a progressive ID, together with the coefficients a, b and n, are listed in Table 1.
37th UIT Heat Transfer Conference
Journal of Physics: Conference Series 1599 (2020) 012016
IOP Publishing doi:10.1088/1742-6596/1599/1/012016
Table 1. Values for the CHTC correlations to be used in Equation 3 (h= a +b*v^n).
Ref ID a b n Ref ID a b n [23] C1 0.000 2.860 0.617 [41] C29 7.820 3.500 1.000 [24] C2 6.220 0.486 1.000 [40] C30 5.800 3.950 1.000 [23] C3 0.000 2.380 0.890 [42] C31 -0.685 11.800 0.500 [25] C4 0.036 2.200 1.000 [43] C32 5.820 4.020 1.000 [26] C5 5.000 1.000 1.000 [44] C33 5.820 4.070 1.000 [27] C6 5.100 1.700 1.000 [45] C34 6.420 3.960 1.000 [27] C7 5.100 1.700 1.010 [46] C35 5.800 4.100 1.000 [28] C8 4.930 1.770 1.000 [43] C36 6.050 4.080 1.000 [24] C9 6.220 2.000 1.000 [39] C37 0.000 7.520 0.784 [29] C10 5.500 2.200 1.000 [38] C38 0.000 7.600 0.780 [30] C11 0.000 6.600 0.600 [41] C39 8.900 3.710 1.000 [31] C12 7.000 2.100 1.000 [47] C40 6.200 4.300 1.000 [32] C13 2.800 3.000 1.000 [48] C41 0.000 5.700 1.000 [28] C14 8.910 2.000 1.000 [49] C42 0.000 14.820 0.420 [33] C15 4.500 2.900 1.000 [50] C43 7.550 4.350 1.000 [20] C16 0.000 3.805 1.000 [28] C44 0.000 16.150 0.397 [34] C17 8.300 2.200 1.000 [51] C45 10.030 5.000 1.000 [12] C18 5.800 2.900 1.000 [28] C46 0.000 16.210 0.452 [35] C19 0.000 6.970 0.666 [49] C47 0.000 15.000 0.530 [34] C20 0.000 9.400 0.500 [41] C48 10.700 4.960 1.000 [36] C21 8.550 2.560 1.000 [52] C49 5.700 6.000 1.000 [37] C22 4.214 3.575 1.000 [28] C50 0.000 16.250 0.503 [34] C23 6.500 3.300 1.000 [48] C51 11.400 5.700 1.000 [38] C24 5.700 3.800 1.000 [23] C52 6.470 7.000 1.000 [39] C25 0.000 7.110 0.775 [51] C53 12.200 7.000 1.000 [21] C26 5.800 3.805 1.000 [53] C54 0.000 18.650 0.605 [40] C27 0.000 7.130 0.780 [48] C55 23.000 5.700 1.000 [38] C28 0.000 7.200 0.780 [45] C56 4.470 10.210 1.000 [12] C57 8.700 9.400 1.000
As first step, the dispersion of the convective coefficient, calculated according to different expressions and at different wind speed classes ranging between 0 m/s and 5 m/s, has been evaluated. Results are shown in Figure 2, where the CHTC are plotted on the x-axis, according to the expressions proposed in the works labelled in the y-axis. Dots of different colours refer to the wind speed classes (step of 0.5 m/s). Results of the evaluation of the Jürge’s equation simplifications adopted in Equation 1 and 2 are also plotted (red labels on y-axis). Finally, a red dotted line marks the value of 25 W/(m2K), that is the value that standard ISO 6946 [54] suggests for external convective heat transfer coefficient when information on the boundary conditions on a plane surface (like walls) are missing, whilst an orange dashed line marks the higher value obtained for wind speed of 0.5 m/s.
The analysis of Figure 2 allows to state the following: (i) some expressions (C1, C2 and C3) provide similar CHTC values (lower than 10 W/(m2K)) by varying the wind speed; (ii) the large majority of the correlations (from C4 to C43) provide CHTC values comprised between 10 W/(m2K) and 30 W/(m2K) for wind speed 5 m/s; (iii) some correlations provide CHTC values spanning up to 56
37th UIT Heat Transfer Conference
Journal of Physics: Conference Series 1599 (2020) 012016
IOP Publishing doi:10.1088/1742-6596/1599/1/012016
W/(m2K) for wind speed up to 5 m/s; (iv) half of the considered correlations provide CHTC values lower than 25 W/(m2K) for wind speed up to 5 m/s; (v) for wind speed between 0 m/s and 1 m/s, all the correlations provide CHTC value lower than 18.8 W/(m2K), except for C55 that provides value up to 28.7 W/(m2K).
Figure 2. CHTC comparison for wind speed ranging between 0 m/s and 5 m/s. 4. Convective coefficient influence on thermal transmittance
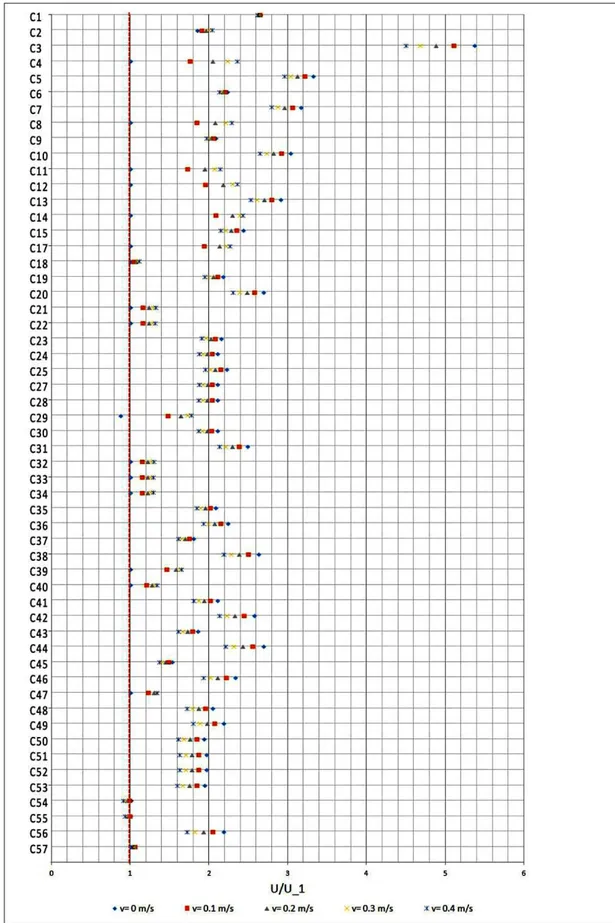
Given the fact that in the experimental set up employed in [19] the air speed in proximity of the wall was negligible, the focus of the research is now the reduced wind speed range 0 m/s – 0.4 m/s. In fact, low wind speed is expected in case of controlled environment set up, like the one of [19]. Therefore, it is reasonable to reduce the wind speed range to 0-0.4 m/s. Finally, for results display, it has been chosen to plot the average of the ratios between the final U-value (once calculated according to Equation 1 - namely U1 - and once according to Equation 2 – namely U2), obtained with data of the 24 experimental campaigns of [19], and the U-value obtained with the original equations.
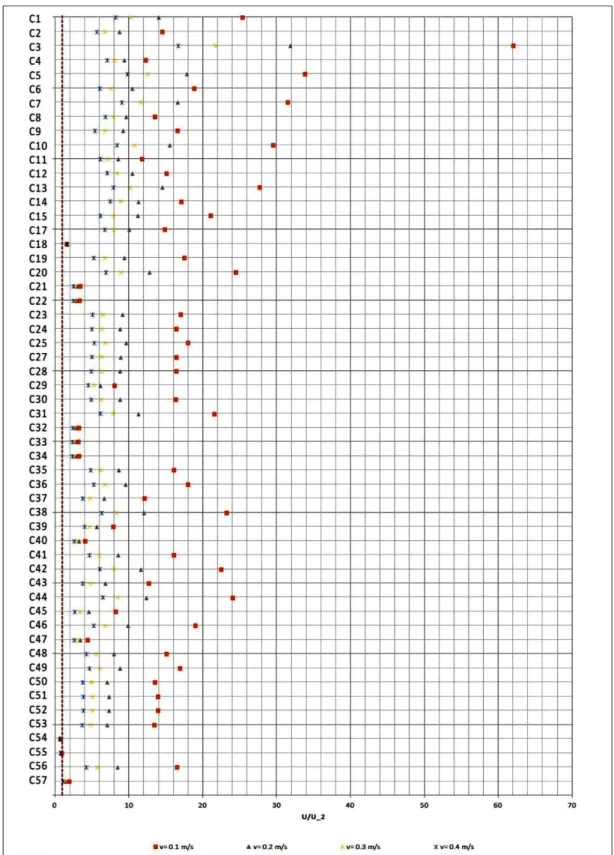
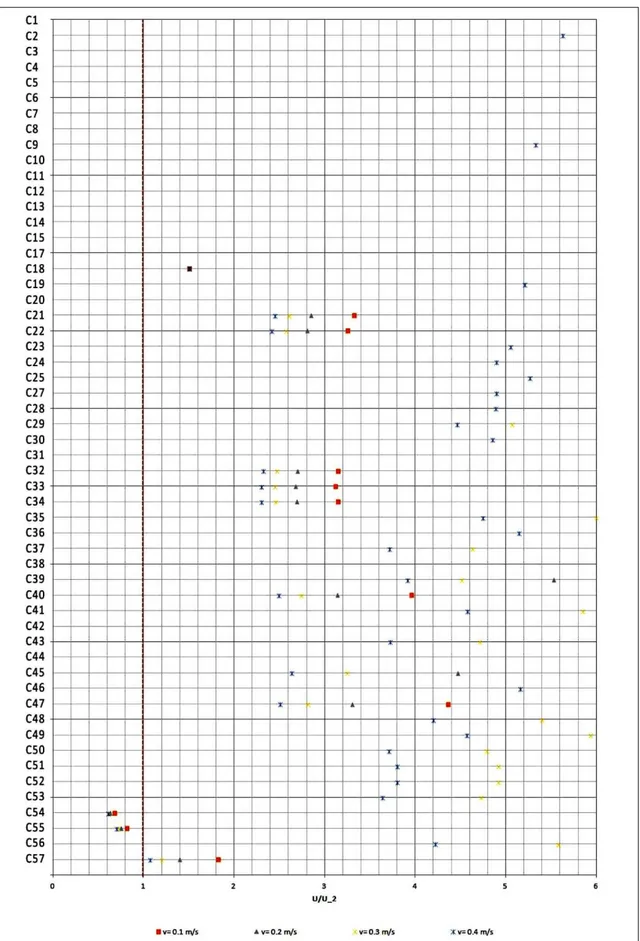
Therefore, each dot represents, at its specific wind speed, the ratio between the U-value (calculated by substituting in the convective term the given correlation), and the original value (obtained with the equations 1 and 2), averaged on the 24 campaigns. This has been done for values obtained via Equation 1 (therefore, we have the ratio U/U1) and via Equation 2 (therefore, we have the ratio U/U2). Results are shown respectively in Figure 3 and Figure 4, whilst Figure 5 proposes details of results of
37th UIT Heat Transfer Conference
Journal of Physics: Conference Series 1599 (2020) 012016
IOP Publishing doi:10.1088/1742-6596/1599/1/012016
Figure 4 focusing in the range of ratio 0-6. The red dashed line in Figures 3 to 5 marks the ratio equal to 1, when the U-value calculated with the CHTC correlation equals the one proposed by the original equation. Therefore, the dots’ scattering, and their distance from the red line, represents the deviation from the original condition (i.e. ratio equal to 1).
From the results analysis, the following outcomes can be drawn:
Correlations that provide CHTC values quite near when the wind speed spans from 0 m/s to 5 m/s (upper part of Figure 2) give the higher U/U1 and U/U2 ratios; this means that such correlations worst represent the convective phenomena at low wind speed.
Correlations (like C48, C49, C50, C51, C53, C54 and C57) that provide higher CHTC values with wind speed up to 0.5 m/s, are those who provide lower U-value ratios considering Equation1;
Figure 3 shows that the considered correlations provide U-values that can be up to 5.5 times the expected ones (see C3) when Equation1 is considered. Instead, considering Equation 2, such ratio can be up to 62. Therefore, the correlation C3 should not be preferred for the convective expression;
Considering Equation 1, several correlations provide results that fit the expected one (C21, C22, C32, C33, C34, C40, C42) in the considered wind speed range. Most of all, the correlations C54, C55 and C57 almost perfectly match the expected one;
Considering Equation 2, results of Figure 5 show that the correlations C54, C55 and C57 are those who provide results near the expected one;
Results of Figure 3 are less scattered than their corresponding of Figure 4; this implies that Equation 1 is less sensitive to the correlation adopted for the convection expression, amongst those considered and in the wind speed range analyzed. This constitutes an advantage, since one of the weak points of the IRT method is the convection expression itself.
37th UIT Heat Transfer Conference
Journal of Physics: Conference Series 1599 (2020) 012016
IOP Publishing doi:10.1088/1742-6596/1599/1/012016
37th UIT Heat Transfer Conference
Journal of Physics: Conference Series 1599 (2020) 012016
IOP Publishing doi:10.1088/1742-6596/1599/1/012016
37th UIT Heat Transfer Conference
Journal of Physics: Conference Series 1599 (2020) 012016
IOP Publishing doi:10.1088/1742-6596/1599/1/012016
37th UIT Heat Transfer Conference
Journal of Physics: Conference Series 1599 (2020) 012016
IOP Publishing doi:10.1088/1742-6596/1599/1/012016
5. Conclusions
The twofold aim of this work is to assess the influence of convective correlation to be adopted in outdoor IRT measurement of thermal transmittance.
From the comparison of CHCT values at different wind speed classes (ranging from = m/s to 5 m/s), it results that some expressions provide similar CHTC values (lower than 10 W/(m2K) by varying the wind speed, but the large majority of analysed correlations provide CHTC values comprised between 10 W/(m2K) and 30 W/(m2K); half of the considered correlations provide CHTC values lower than 25 W/(m2K) for wind speed up to 5 m/s.
After this preliminary comparison amongst CHTC correlations, it is reasonable to consider the reduced wind speed range 0-0.4 m/s, such as the low wind speed in proximity of buildings’ façade during IRT survey (as also recommended by common practice).
In this case, the ratios between the final U-value with, in turn, the CHTC correlations, and the U-value obtained with the original equations (U1 from Eq.1 and U2 from Eq.2 ), have been compared.
The following outcomes can be pointed out:
Correlations that provide CHTC values quite near when the wind speed spans from 0 m/s to 5 m/s worst represent the convective phenomena at low wind speed.
Correlations providing higher CHTC values with wind speed up to 0.5 m/s (like C48, C49, C50, C51, C53, C54 and C57), give lower U-value ratios considering Equation1;
Correlation C3 should not be preferred for the convective expression (very high U/U1 and U/U2 ratios);
From the Equation point of view, it is possible to state that the approach and formulation proposed by Albatici [20] is less sensitive to the correlation adopted for the convection expression, amongst those considered and in the wind speed range analyzed. This constitutes an advantage, since one of the weak points of the IRT method is the convection expression itself.
References
[1] Lewandowski W M, Ryms M and Denda H 2018 Quantitative study of free convective heat losses from thermodynamic partitions using Thermal Imaging Energy Build. 167 370–83 [2] Ohlsson K E A, Östin R, Grundberg S and Olofsson T 2016 Dynamic model for measurement
of convective heat transfer coefficient at external building surfacesJ. Build. Eng. 7 239–45 [3] Genova E and Fatta G 2018 The thermal performances of historic masonry: In-situ
measurements of thermal conductance on calcarenite stone walls in Palermo Energy Build. 168 363-73
[4] Vollmer M and Möllmann K-P, Infrared Thermal Imaging: Fundamentals, Research and Applications, second edition Wiley VCH
[5] Yang W, Zhu X and Liu J 2017 Annual experimental research on convective heat transfer coefficient of exterior surface of building external wall Energy Build. 155 207-14
[6] Evangelisti L, Guattari C, Gori P, de Lieto Vollaro R and Asdrubali F 2016 Int. Commun. Heat Mass Transf. 78 214–23
[7] Evangelisti L, Guattari C, Gori P and Bianchi F 2017 Experimental investigation of the influence of convective and radiative heat transfers on thermal transmittance measurements Energy Build. 151 429–38
[8] Gramazio P, Vitali L, Fustinoni D and Niro A 2017 New data processing of local heat transfer coefficient inside a rectangular channel J Phys Conf Ser 923 pp 012052
[9] Fustinoni D, Gramazio P, Vitali L and Niro A 2017 New experimental results on local heat transfer inside a rectangular channel with rib-roughened surfaces J Phys Conf Ser 796 pp 012015
37th UIT Heat Transfer Conference
Journal of Physics: Conference Series 1599 (2020) 012016
IOP Publishing doi:10.1088/1742-6596/1599/1/012016
for convective heat transfer measurements Opt Laser Technol. 32 593-610
[11] Carlomagno G and Cardone G 2010 Infrared thermography for convective heat transfer measurements Exp Fluids 49 1187-1218
[12] Ito N, Kimura K and Oka J 1972 Field experiment study on the convective heat transfer coefficient on exterior surface of a building ASHRAE Trans. 78 184–191
[13] Montazeri H and Blocken B 2017 New generalized expressions for forced convective heat transfer coefficients at building facades and roofs Build. Environ. 119 153-68
[14] Nardi I, Lucchi E, de Rubeis T and Ambrosini D 2018 Quantification of heat energy losses through the building envelope: A state-of-the-art analysis with critical and comprehensive review on infrared thermography Build. Environ. 146 190–205
[15] Kato S, Kuroki K and Hagihara S 2007 Method of in-situ measurement of thermal insulation performance of building elements using infrared camera IAQVEC 2007
[16] Fokaides P and Kalogirou S 2011 Application of infrared thermography for the determination of the overall heat transfer coefficient (U-Value) in building envelopes Appl Energ 88 4358-65 [17] Tejedor B, Casals M, Gangolells M and Roca X 2017 Quantitative internal infrared
thermography for determining in-situ thermal behaviour of façades Energy Build. 151 187-97 [18] Nardi I, Sfarra S and Ambrosini D 2014 Quantitative thermography for the estimation of the
U-value: state of the art and a case study J Phys Conf Ser 547 pp 1
[19] Nardi I, Paoletti D, Ambrosini D, de Rubeis T and Sfarra S 2016 U-value assessment by infrared thermography: A comparison of different calculation methods in a Guarded Hot Box Energy Build. 122 211-21
[20] Albatici R and Tonelli A M 2010 Infrared thermovision technique for the assessment of thermal transmittance value of opaque building elements on site Energy Build. 42 2177–83
[21] Dall’O’ G, Sarto L and Panza A 2013 Infrared Screening of Residential Buildings for Energy Audit Purposes: Results of a Field Test Energies 6 3859–78
[22] Palyvos J A 2008 A survey of wind convection coefficient correlations for building envelope energy systems’ modeling A survey of wind convection coefficient correlations for building envelope energy systems’ modeling Appl. Therm. Eng. 28 801–8
[23] Yazdanian M and Klems J H 1994, Measurement of the exterior convective film coefficient for windows in low-rise buildings ASHRAE Trans.100 (1) 1087–109
[24] Kimura K 1977 Scientific basis of air conditioning Applied Science Publishers Ltd., London, England
[25] Thomaidis G, Palyvos J A and Koumoutsos N G 1982 The influence of the wind on the efficiency of the flat-plate solar collector Proc. 1st National Conference on “Soft Energies” (Salonica, Greece), HEX, pp.1–15
[26] Jayamaha S E J, Wijeysundera N E and Chou S K 1996 Measurement of the heat transfer coefficient for walls Build. Environ. 31 399–407
[27] Sharples S, 1984 Full-scale measurements of convective energy losses from exterior building surfaces Build. Environ. 19 31–39
[28] Loveday D L and Taki A H 1996 Convective heat transfer coefficients at a plane surface on a full-scale building façade Int. J. Heat Mass Transfer 39 1729–42
[29] K. Furushima K, Y. Nawata Y and Sadatomi M, 2006 prediction of photovoltaic (PV) power output considering weather effects Proc. of the SOLAR 2006 – Renewable Energy, Key to Climate Recovery ( Denver, Colorado, USA)
[30] Mitchell J W 1971 Base heat transfer in two-dimensional subsonic fully separated flows Trans. ASME J. Heat Transfer 342–348
[31] Schott T, 1985 Operation temperatures of PV modules Proc. of the 6th E.C. PV Solar Energy Conference ( London, UK) 392–6
[32] Watmuff J H, Charters W W S and Proctor D 1977 Solar and wind induced external coefficients for solar collectors Comples. Int. Rev. d’Hellio Tech . 2 56
[33] Lunde P J 1980, Solar Thermal Engineering, John Wiley & Sons, New York, USA, page 17 [34] Sharples S and Charlesworth P S 1998 Full-scale measurements of wind-induced convective
37th UIT Heat Transfer Conference
Journal of Physics: Conference Series 1599 (2020) 012016
IOP Publishing doi:10.1088/1742-6596/1599/1/012016
heat transfer from a roof-mounted flat plate solar collector Sol Energy 62 69–78
[35] Sogin H H 1964 A summary of experiments on local heat transfer from the rear of bluff obstacles to a low speed airstream Trans. ASME J. Heat Transfer 200–2
[36] Test F L, Lessmann R C and Johary A 1981 Heat transfer during wind flow over rectangular bodies in the natural environment Trans. ASME J.Heat Transfer 103 262–267
[37] Eicker U 2003, Solar Technologies for Buildings, John Wiley & Sons Ltd., Chichester, England, § 3.1.10.4
[38] McAdams W H 1954, Heat Transmission, third ed., McGraw-Hill, Kogakusha, Tokyo, Japan, p. 249
[39] Jürges W 1924, Der Wärmeübergang an einer ebenen Wand, Beiheft Nr 19 zum Gesundheits-Ingenieur 9 p. 105
[40] Nusselt Wand Jürges W 1922, Die Kühlung einer ebenen Wand durch einen Luftstrom Gesundheits Ingenieur 52 pp. 641–642
[41] Jennings B 1970, Environmental Engineering, International Textbook Company
[42] Onur N, Hewitt J C Jr. 1980 A study on wind effects on collector performance Proc. of the ASME Solar Energy Division (San Francisco, CA)
[43] Schaak A 1965, Industrial Heat Transfer, Chapman & Hall, London
[44] Nolay P 1987, Developpment d’une methode generale d’analyse des systemes photovoltaiques MS Thesis, Ecole des Mines, Sophia- Antipolis, France
[45] Hagishima A and Tanimoto J 2003 Field measurements for estimating the convective heat transfer coefficient at building surfaces Build. Environ. 38 873–81
[46] CIBS 1979, Chartered Institute of Building Services Guide Book A, Section A3, CIBS, London [47] Davies M G 2004, Build. Heat Transfer, John Wiley & Sons Ltd., Chichester, England, § 5.7 [48] Cole R J and Sturrock N S 1977 The convective heat exchange at the external surface of
buildings Build. Environ. 12 207–14
[49] Taki A H and Loveday D L 1996 External convection coefficients for framed rectangular elements on building facades Energ. Build. 24 147–54
[50] Nicol K 1977 The energy balance of an exterior window surface, Inuvik, N.W.T., Canada Build. Environ. 12 215–19
[51] Kumar S, Sharma V B, Kandpal T C and Mullick S C 1997 Wind induced heat losses from outer cover of solar collectors Renew. Energ. 10 613–16
[52] Sturrock N S 1971, Localized boundary layer heat transfer from external building surfaces Ph.D. Thesis, University of Liverpool
[53] ASHRAE Task Group 1975 Procedure for determining heating and cooling loads for
computerizing energy calculations. Algorithms for building heat transfer subroutines ASHRAE, New York 76–8
[54] International Standard ISO 6946, Building components and building elements – Thermal resistance and thermal transmittance 2007