Journal of Photochemistry & Photobiology, A: Chemistry 413 (2021) 113258
Available online 15 March 2021
1010-6030/© 2021 Elsevier B.V. All rights reserved.
Visible light photodegradation of dyes and paracetamol by direct
sensitization mechanism onto metallic MoO
2
nanocrystals
Alessandro Di Mauro
a, Marta Maria Natile
b, Anton Landstr¨om
c, Isabella Concina
c,
Matteo Ferroni
d,e, Vittorio Privitera
a, Giuliana Impellizzeri
a, Mauro Epifani
f,*
aCNR-IMM, Via S. Sofia 64, 95123 Catania, ItalybIstituto di Chimica della Materia Condensata e Tecnologie per l’Energia, Consiglio Nazionale delle Ricerche (ICMATE-CNR) and Dipartimento di Scienze Chimiche, Universit`a di Padova, Via F. Marzolo 1, 35131 Padova, Italy
cLuleå University of Technology, 971 87 Luleå, Sweden
dDepartment of Information Engineering, University of Brescia, Via Branze, Brescia, Italy eCNR-IMM, Via Gobetti, Bologna, Italy
fCNR-IMM, Via Monteroni c/o Campus Universitario, 73100 Lecce, Italy
A R T I C L E I N F O Keywords:
Photodegradation Dye sensitization
Direct sensitization mechanism Methylene blue
MoO2
Solvothermal synthesis
A B S T R A C T
MoO2 nanocrystals were prepared by solvothermal treatment of a Mo chloromethoxide at 250 ◦C in oleic acid.
The monoclinic MoO2 phase, with a mean crystallite size of 29 nm, formed through reduction of molybdenum
bronzes. The as-prepared MoO2 nanocrystals were free from organics, allowing their use in photodegradation
tests of organic pollutants (methylene blue, rhodamine B, paracetamol), without any preliminary purification treatment of the nanocrystals. It was found that MoO2 was an efficient adsorbent of methylene blue (43 mg g−1
for 1.5 × 10⁻⁴ M concentration) in the dark and an efficient photodegradation catalyst under visible light (all
methylene blue removed from the solution after 240 min). From the analysis of the combined photodegradation tests of rhodamine B and paracetamol, it was clarified that direct sensitization was responsible for photo-degradation. This finding was related to the work function value of metallic MoO2, placed at more negative
values if compared with other metallic materials.
1. Introduction
Molybdenum dioxide (MoO2) crystallizes in its most stable form in
the monoclinic crystallographic system [1] and features an interesting metallic electrical conductivity. It has long been known as a catalyst but it has triggered renewed interest due to its applications in batteries [2, 3], supercapacitors [4,5], water splitting [6–9] and SERS spectroscopy [10]. Very recently, MoO2 has showed very interesting
photo-degradation properties towards several common water pollutants. [4, 11]. Such a property is quite unexpected with respect to the electronic properties of MoO2. The latter have been investigated for long time as a
part of the general effort to understand the physical properties of tran-sition metal oxides. Briefly, MoO2 belongs to a class of oxides where the
intercation distance is such to allow electronic coupling of neighbouring Mo cations, which is manifested by splitting of their d orbitals. The or-bitals oriented along the c axis are split into two largely separated bands (t|| and t||*), among which the antibonding π* band (derived from O-Mo
bonding) is located. Of the two d electrons of Mo, one will fill the t|| band and the other will partially fill the π* band. Being the Fermi
level located into the π * band, the material displays metallic behavior.
This view was early proposed by Goodenough [12–14] and Rogers et al. [15] and further refined by cluster and tight binding calculations by Sasaki et al. [16] and Burdett [17]. Later on, full band structure DFT calculation was carried out [18,19], strongly substantiating the early models. Based on the picture by Goodenough, the optical absorption increase above 2.5 eV in MoO2 was mainly ascribed to excitation from
the top of the oxygen p band to the Fermi level in the 4d bands [20,21]. In Ref. [11] a cutoff filter at 420 nm was used for the photocatalytic studies. Therefore, if a standard view of the photocatalytic effect is assumed, based on photogenerated electron-hole couples in a semi-conductor, a very narrow region of visible light would be available for photodegradation. In the present work a peculiar synthesis of MoO2
nanoparticles is presented, capable of providing organics-free material without any purification. This property allowed planning the use of * Corresponding author.
E-mail address: [email protected] (M. Epifani).
Contents lists available at ScienceDirect
Journal of Photochemistry & Photobiology, A: Chemistry
journal homepage: www.elsevier.com/locate/jphotochemhttps://doi.org/10.1016/j.jphotochem.2021.113258
2.1. Synthesis of MoO2 nanocrystals
For preparing MoO2 nanoparticles, 2 mL of Mo chloromethoxide,
prepared as previously described [22], were dispersed in 10 mL of oleic acid (90 %, technical grade). The resulting opaque suspension was poured into a glass vial, which was inserted into a 45 mL autoclave, heated into an oven at a rate of 5 ◦C/min up to temperatures ranging
from 175 to 250 ◦C, and kept at such temperatures for 2 h. After cooling,
the product was recovered by addition of methanol and centrifugation, washed in acetone and finally dried at 90 ◦C. Dark blue powders were
obtained, very fine and free flowing.
2.2. Materials characterization
X-ray diffraction (XRD) patterns were recorded on a PANalytical Empyrean diffractometer. Cu K-α radiation was obtained with a Cu
anode operated at 45 kV/40 mA and a graphite monochromator. A programmable divergence slit was used to illuminate a 10 × 10 mm2
area of the sample surface. Rietveld refinement of the MoO2 pattern was
carried out with the MAUD software [23].
XPS spectra were taken with a Perkin Elmer PHI 5600 spectrometer. Both extended spectra (survey: 187.85 eV pass energy, 0.5 eV step, 0.025 s⋅step−1) and detailed spectra (Mo 3d, O 1s and C 1s: 23.5 eV pass
energy, 0.1 eV step, 0.2 s⋅step−1) were collected with a standard Al − Kα
source (1486.6 eV) working at 250 W.
Fourier Transform Infrared (FTIR) measurements were carried out by a Nicolet 6700 spectrometer in diffuse reflectance setup, after dispersing the sample powders in KBr.
The specific surface area and porosity of the nanostructured samples were measured by the Brunauer–Emmett–Teller (BET) method using N2
adsorption/desorption at 77 K with a Quantachrome NOVA 2200e series surface analyzer.
2.3. Adsorption and photodegradation experiments
The adsorption properties of MoO2 nanocrystals were evaluated
through the adsorption of MB dye in aqueous solution. In a typical experiment, 1 mg of MoO2sample was added to 2 mL of MB solution with
a starting concentration of 1.5 × 10⁻⁴ M. The test was run in parallel for
both materials. At regular time intervals, the solutions were collected and centrifuged at 4000 rpm for 5 min, so to separate the nanopowders. The variation of the MB concentration, during the adsorption experi-ment, was evaluated spectrophotometrically (using a PerkinElmer Lambda 45 UV–vis spectrophotometer) via the solution absorbance at 664 nm. In order to use the Lambert-Beer law, the solution was diluted before the analysis to have the value of absorbance of ~ 1 [24]. The dye adsorption on the beaker walls was also checked, as a reference, in the absence of MoO2. The photocatalytic activity of MoO2 under visible light
was evaluated by following the degradation of MB in aqueous solution, with the same protocol described before, by using an Oriel VeraSol TM Solar Simulator (Newport) with an irradiance of 12 mW/cm2. Solutions
of Rhodamine B (RhB) and paracetamol were also tested to investigate the dye sensitization mechanism. The RhB test was first carried out using
the full solar spectrum and then repeated by filtering off the 500− 600 nm range which contains the absorbance band of RhB. The measurements were performed with the same procedures described above for the MB photodegradation. The starting solution included paracetamol and RhB with a concentration of 1.5 × 10⁻⁵ M and
9.5 × 10⁻⁵ in deionized water, in order to have for both compounds an
absorbance of about 1. The degradation of paracetamol and of RhB was evaluated by following the absorbance peak at 243 nm and 546 nm, respectively, in the Lambert-Beer regime.
3. Results and discussion
3.1. Materials synthesis and growth pathways
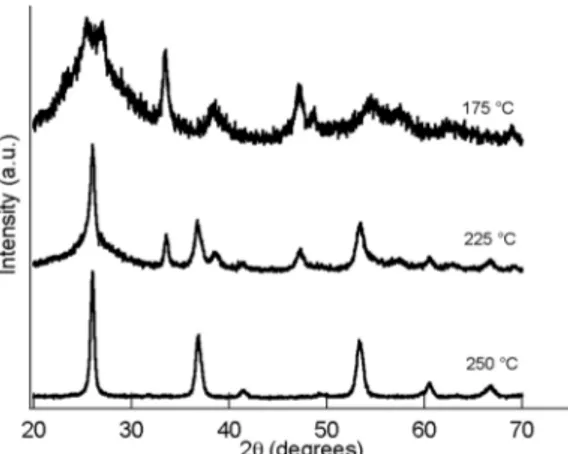
Fig. 1 reports the XRD patterns of samples obtained by heat- treatment for 2 h at different temperatures. It is clear that the final MoO2 phase developed through other crystalline phases which were
present already after treatment at 175 ◦C. Monoclinic MoO 2
(tugar-inovite), in particular, was observed after treatment at 225 ◦C, but it was
accompanied by residuals of the phase present at 175 ◦C, and conversion
was complete only by processing at 250 ◦C.
Inspection of the 175 ◦C pattern revealed that the related phase was
most probably a molybdenum bronze, as suggested by comparison with the patterns published in the past [25,26]. The phase could actually be a mixture of H0.34MoO3 (type I) and H0.93MoO3 (type II) bronzes, given
the similarity of their XRD reflections. This hypothesis was confirmed by the FTIR analysis shown in Fig. 5. In the following, the mixture of phases
Fig. 1. XRD patterns of the samples obtained by solvothermal treatment at the
indicated temperatures. All the reflections in the 250 ◦C pattern belong to the
MoO2 monoclinic phase.
Fig. 2. XRD patterns of the samples obtained by solvothermal treatment in the
will be referred to as MOB. The synthesis conditions were further explored by changing the solvent and the heating time. Dodecanol was chosen since in the case of WO3 it allowed preparing more unusual phase
and morphology [27]. The XRD results are shown in Fig. 2, and it can be seen that oleic acid was a necessary choice to establish the MoO2 phase.
Dodecanol resulted in a pattern whose weak reflections seemed related to those of MoO2, despite largely shifted, so it was not further
consid-ered. Moreover, heating at 250 ◦C in oleic acid for both 2 and 4 h
resulted in a mean MoO2 domain size of 29 nm, as obtained by Rietveld
refinement of the patterns (see Supporting Information) so 2 h was kept as a standard heating time in all the experiments.
For gaining more insight into the precursor evolution, another set of experiments was designed, where isothermal heating was carried out at 250 ◦C for several time intervals.
The related XRD patterns are presented in Fig. 3. It can be seen that, after 15 min, the MoO2 structure was developed but it was overlapped
with the MOB phase (same reflections of Fig. 1). The MOB phase pro-gressively decreased for longer heating times and disappeared after 2 h at 250 ◦C. After 1 h it seems that a residual reflection is present at
2θ~63◦. Hence the MOB phases appeared stable for at least 2 h at 175 ◦C
(Fig. 1). Moreover, they were also partially preserved at 250 ◦C, as seen
in Fig. 3, for kinetic reasons (the conversion to MoO2 is not so fast to
have the MOB immediately consumed as soon as the autoclave gets to 250 ◦C). Such MOB phase stability allowed hypothesizing that the
pre-cursor evolution started directly from the MOB formation, which then evolved to the finally stable MoO2. The exact formation temperature of
MOB of course cannot be predicted from the data of Fig. 1. It can also be observed that the MoO2 reflections in Fig. 3 shifted to lower angles as the
heating time increased. This effect was particularly evident for the en-velope at 2θ ~ 27◦. Such shift indicated an increase of the related crystal
planes distance in the MoO2 lattice. MoO2 formation by condensation of
neighboring Mo− OH bonds would result in lattice contraction. There-fore the MoO2 formation from the MOB phase must involve complex
reconstruction of the lattice upon loss of OH groups, favored by oleic acid. The direct formation of MOB phases was surprising since they have never been directly synthesized without reduction of Mo(VI) com-pounds, to the best of our knowledge.
The XPS spectra of the same sequency of samples of Fig. 1 were then acquired. Fig. 4 shows the XPS spectra of the Mo 3d core level. Only Mo (V) and Mo (VI) were detected in the samples prepared at lower tem-perature (175 and 225 ◦C). A thermal treatment at 250 ◦C was necessary
to observe also a contribution of Mo (IV) (Fig. 4 and Table 1). In this sample three different oxidation states of Mo were detected. These different oxidation states clearly reinforced the view that a molybdenum bronze constituted the 175 ◦C phase, so resulting in a mixture of
oxidation states higher than Mo (IV). Further reduction in the oleic acid environment resulted in MoO2.
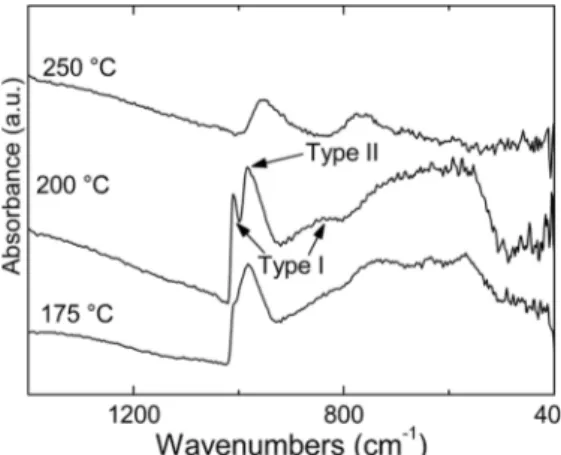
FTIR spectroscopy was used as a final tool for elucidating the nature of the MOB phase. The spectra sequency in Fig. 5 clearly shows, following previous works [25,28], that the MOB phase is actually a mixture of the type I and type II molybdenum bronzes. Expectedly, with
Fig. 3. XRD patterns of the samples obtained by solvothermal treatment at
250 ◦C for the indicated times. The stars indicate the reflections of the
molyb-denum bronze phase(s).
Fig. 4. Mo 3d XPS peaks of the samples prepared at the indicated temperatures.
The doublets characteristic of molybdenum in different oxidation states are reported in different colors: Mo(IV) - orange, Mo(V) - green and Mo(VI) – gray.
Fig. 5. FTIR spectra of the samples obtained by solvothermal treatment at the
indicated temperatures.
Table 1
Mo 3d XPS Peak Positions (Binding Energy, eV) of the samples in Fig. 4.
Mo(IV) Mo(V) Mo(VI)
3d5/2 3d3/2 3d5/2 3d3/2 3d5/2 3d3/2
175 ◦C – 231.8 234.9 233.0 236.1
225 ◦C – 231.7 234.8 233.0 236.1
increasing the treatment temperature the type I phase increases at the expense of type II, in agreement with the supposed reduction process (OH elimination) at the base of MoO2 formation. The increasing
ab-sorption towards lower frequencies is a further confirmation of the conductive nature of the bronzes. Likewise, an increasing absorption is observed for the MoO2 spectrum.
It can be further, importantly observed that there is no evidence of bonded oleate ligands, which can be easily detected by the carboxylate stretching modes, or of other organic residuals (see also the high fre-quency range of the spectra in the Supporting Information). Hence the as-prepared MoO2 nanoparticles were chemically pure soon after the
solvothermal treatment and the purification procedure. The reason for this result is not clear, but it is similar to the properties of WO3
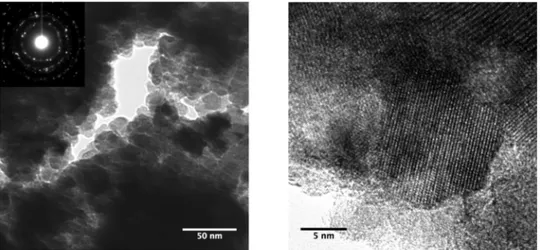
nano-crystals also prepared by chloroalkoxide processing in oleic acid [27]. Fig. 6 shows representative TEM images of the 250 ◦C sample.
Aggre-gation of the nanocrystals is clearly seen, and is closely related to the lack of surface ligands, as just discussed. On the other hand, nano-crystalline structures, with a size in close agreement with the XRD determination, can be observed, all featuring the MoO2 crystal structure.
Fig. S3 in Supporting Information also shows a SEM image of the 250 ◦C MoO
2 sample. It can be seen that the materials are very porous
and tend to form some spheroidal aggregates. The adsorption/desorp-tion isotherm, reported in the Supporting Informaadsorption/desorp-tion (Fig. S4), shows a Type IV behavior, typical of mesoporous materials, with a mean pore size of about 11 nm. The specific surface area of the sample, as deter-mined by BET method, was 30.4 m2/g.
3.2. Adsorption and photodegradation studies
The adsorption properties of MoO2 nanocrystals were investigated at
room temperature. The sample powders were immersed in an aqueous solution of MB for three hours, until the equilibrium was reached, so to evaluate the amount of adsorbed MB. At time t (min) the adsorption capacity, Qt (mg g−1), was calculated by the following equation [29]:
Qe=
(C0− Ct) ×V
W ((1))
where C0 (mg L−1) is the initial concentration of MB, Ct (mg L−1) is the concentration of MB at time t, V (L) is the solvent volume (i.e., deionized water), and W (g) is the mass of adsorbent used in the adsorption pro-cess. The results of this experiment are reported in Fig. 7.
After three hours the equilibrium between the MoO2 nanocrystals
and MB was reached and the adsorption capacity of the nanopowders was ~ 43 mg g−1. The maximum adsorption capacity (Q
max) was
calculated by using Eq. (1) where Ct is zero (i.e., all MB is adsorbed by the material). The value of Qmax resulted 103 mg g−1, and it is indicated
in Fig. 7 with a dashed line. This means that MoO2 is able to remove ~
40 % of MB from the solution.
When the equilibrium was reached, light was switched on in order to investigate the photodegradation properties of MoO2. This experiment
was managed under a solar simulator (the evolution of the optical ab-sorption spectra is reported in the Supporting Information, Fig. S5). Fig. 8 shows both the adsorption (in dark conditions, grey area) and the photocatalytic experiment (under solar simulator light, white area). The
Fig. 6. (Left) TEM bright-field image of the 250 ◦C MoO
2 sample and the corresponding electron diffraction pattern. (Right) High-Resolution TEM image of a MoO2
nanocrystal.
Fig. 7. MB adsorption capacity versus time for MoO2 (circles). Fig. 8. Adsorption (in the dark) and photocatalytic (under solar simulator)
data reported in the grey area have been already discussed above (Fig. 7).
MoO2 was able to degrade ~ 60 % of MB after 4 h of solar irradiation.
Therefore by combining the adsorption and the photocatalytic activity of MoO2 nanopowders it was possible to completely remove the MB dye
from the aqueous solution.
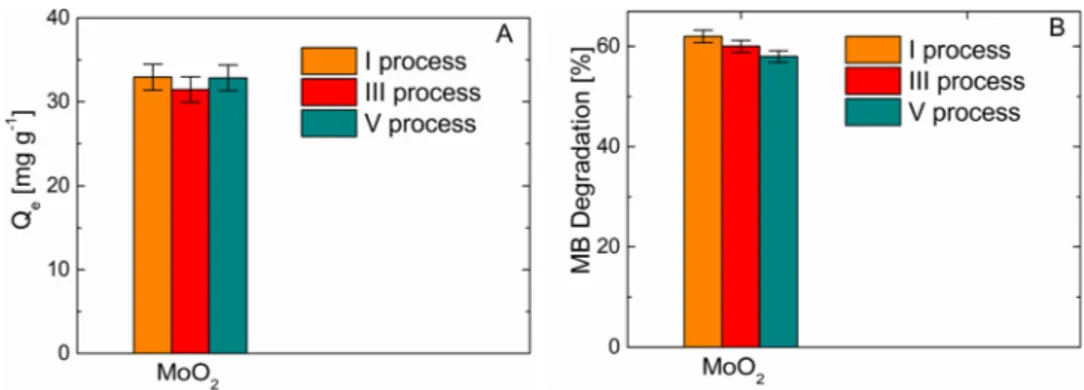
After the irradiation under visible light, the regeneration of the MoO2
nanopowders was tested by measuring the adsorption capacity for several cycles (up to 5 cycles). Fig. 9A shows the amount of adsorbed MB, calculated by Eq. (1) at equilibrium. MoO2 removed the same
amount of MB at least up to 5 runs of the adsorption/photocatalytic
process. Similarly, the percentage of photodegraded MB is the same for all runs with MoO2 (Fig. 9B). In order to investigate the mechanism of
photodegradation under visible light, the degradation of paracetamol, one of the most popular analgesic and antipyretic drugs, was investi-gated. Since paracetamol does not absorb in the visible region of the spectrum, any reduction in concentration can be attributed to photo-catalysis onto the MoO2 support [30]. No reduction in concentration was
recorded (Fig. S7). This result, in turn, suggested that the degradation of MB could be triggered by a dye sensitization process. To confirm the nature of the degradation process, measurements were performed using a mixture of RhB and paracetamol. A mixture with MB was not used
Fig. 9. Adsorption (A) and photocatalytic (B) recycling properties of MoO2 nanocrystals towards MB.
Fig. 10. (A) Degradation of RhB and paracetamol by visible light in a mixed solution of both contaminants. (B) Assessment of dye-sensitization using a filtered
spectrum (500-600 nm filtered).
Fig. 11. (A) Schematic illustration of MoO2 energy bands, together with the HOMO-LUMO levels of MB and RhB. For MoO2, the dark blue shaded area represents the
occupied states in the conduction band, while the upper light blue area shows the empty states; (B) The possible charge transfer between paracetamol and RhB is shown, circumventing the fact that paracetamol is not amenable to photoexcitation. The paracetamol LUMO is very high in energy and is not shown for clarity.
(Fig. 10B). The sequences of optical absorption spectra are reported in Fig. S8.
The mechanisms responsible for dye degradation are generally classified as direct and indirect [31,32]. In the indirect pathway, the dye can be oxidized by hydroxyl radicals triggered by holes photogenerated in a semiconducting catalyst. In the present case, however, the dye cannot count onto photogenerated holes in MoO2, since photoexcitation
in the latter does not occur through the bandgap. In direct degradation mode, the dye is excited by visible light from the ground state to a triplet excited state. In such state, electron injection into the catalyst conduc-tion band generates a dye caconduc-tion and negatively charged catalyst sup-port. The latter may give rise, as final step, to hydroxyl radicals which are responsible for final dye degradation.
As detailed in the introduction, interband absorption in MoO2 is
expected for energies higher than 2.5 eV but in the discussion of Fig. 10 it has already been noted that, upon filtering of the radiation above 500 nm, no photodegradation was observed. These considerations exclude indirect pathways for photodegradation. On the other hand, the states above the Fermi level in MoO2 are available for accepting
photoexcited electrons in the dyes, as illustrated in Fig. 11A. Data are reported for the work function of MoO2 [33] and the HOMO-LUMO
values of MB and RhB [34]. For paracetamol, results from DFT modeling were used [35]. It can be seen that injection of photogenerated electrons from MB and RhB to MoO2 is favorable. This process creates
the cation radicals at the base of the direct photodegradation mecha-nism. The overall process is made possible by the MoO2 work function,
which is at lower level than the typical values for many metals [36], and of course by favorable dye adsorption onto a transition metal like Mo. In Fig. 11B, from the position of the HOMO of paracetamol (which cannot be photoexcitated, due to the very large HOMO-LUMO separation) it can be seen that hole transfer from RhB to paracetamol can occur, so creating radicals for further degradation reactions. The fact that no degradation occurred when light was not absorbed by the RhB dye (Figs. 10 and S8) nicely fits into this explanation. It is to be noted that hole transfer from RhB to paracetamol could slow down the photo-degradation of RhB itself. Instead, comparison of Figs. S7 and 10 shows that RhB photodegradation is not perturbed by the presence of paracetamol.
Our model is necessarily approximate, due to possible fluctuations of the vacuum levels of the involved species and the fact that the HOMO- LUMO levels of paracetamol should be obtained at the real working temperature. Nevertheless, such fluctuations are not expected to sub-stantially affect the huge energy separations depicted in Fig. 11. Such kind of decomposition of synergistic pollutants has already been re-ported [34] but with a semiconducting support (TiO2). In the present
work, importantly, it is clarified that the metallic nature of MoO2,
together with its work function, is favorable to the photodegradation promotion. One could wonder whether other materials may perform a similar function. As noted above, many metals have smaller work function than MoO2. Moreover, metals with comparable values of the
work function must further display a satisfactory coordination chemistry toward the dyes, which is another advantage of a transition metal like Mo. Nevertheless, the concept of a metal photodegradation catalyst with designed work function and surface chemistry is a strong indication
MB from the aqueous solution; ii) RhB removal was possible up to 84 % of the starting concentration and, in its presence, removal of paraceta-mol up to 71 %; iii) the analysis of these results brought by the most
important conclusion: the photodegradation activity cannot be explained
by indirect sensitization mechanisms, simply because MoO2 is not a
semiconductor, and the decisive factor was the position of the MoO2
work function. This result paves the way for potential use of metallic photodegradation catalysts by appropriate control of the work function. In the cycling experiments carried out in the present work, MoO2 did not
present any stability issue. However, possible oxidation problems in long term operation should be considered in any practical imple-mentation of the material.
CRediT authorship contribution statement
Alessandro Di Mauro: Investigation, Visualization, Writing - review & editing. Marta Maria Natile: Investigation, Visualization, Writing - review & editing. Anton Landstr¨om: Investigation, Visualization, Writing - review & editing. Isabella Concina: Investigation, Visualiza-tion, Writing - review & editing. Matteo Ferroni: InvestigaVisualiza-tion, Visu-alization, Writing - review & editing. Vittorio Privitera: Investigation, Visualization, Writing - review & editing. Giuliana Impellizzeri: Investigation, Visualization, Writing - review & editing. Mauro Epifani: Conceptualization, Investigation, Visualization, Writing - original draft, Writing - review & editing.
Declaration of Competing Interest
The authors report no declarations of interest. Acknowledgements
This work was partially funded by the European Regional Develop-ment Funds (FESR) INTERREG V – A Italia Malta - Micro WatTS C1-1.1- 70 (CUP: B61G18000070009). We thank Sudipto Kumar Pal and Anto-nio Licciulli (University of Salento) for the BET measurements. MMN acknowledges the MIUR-PON TARANTO (ARS01_00637) for partial funding. I.C. acknowledges Carl Trygger Foundation (project “Water remediation through semiconductor-supported photocatalysis - War-Cat”, Project No. CTS 19:70) and Kempe foundation (project: Purifica-tion platforms for the treatment of pharmaceutical wastes) for partial funding.
Appendix A. Supplementary data
Supplementary material related to this article can be found, in the online version, at doi:https://doi.org/10.1016/j.jphotochem.2021. 113258.
References
[1] B.G. Brandt, A.C. Skapski, Acta Chem. Scand. 21 (1947–1973) (1967) 661–672. [2] H.T.T. Pham, C. Jo, J. Lee, Y. Kwon, RSC Adv. 6 (2016) 17574–17582. [3] Y.F. Zhao, Y.X. Zhang, Z.Y. Yang, Y.M. Yan, K.N. Sun, Sci. Technol. Adv. Mat. 14
[4] E. Zhou, C.G. Wang, Q.Q. Zhao, Z.P. Li, M.H. Shao, X.L. Deng, X.J. Liu, X.J. Xu, Ceram. Int. 42 (2016) 2198–2203.
[5] H.S. Kim, J.B. Cook, S.H. Tolbert, B. Dunn, J. Electrochem. Soc. 162 (2015) A5083–A5090.
[6] J.Y. Shi, Y. Kuwahara, M.C. Wen, M. Navlani-Garcia, K. Mori, T.C. An, H. Yamashita, Chem. - Asian J. 11 (2016) 2377–2381.
[7] Y.S. Jin, H.T. Wang, J.J. Li, X. Yue, Y.J. Han, P.K. Shen, Y. Cui, Adv. Mater. 28 (2016) 3785–3790.
[8] H. Du, X. Xie, Q. Zhu, L. Lin, Y.F. Jiang, Z.K. Yang, X. Zhou, A.W. Xu, Nanoscale 7 (2015) 5752–5759.
[9] Z.X. Yan, J.M. Xie, J.J. Jing, M.M. Zhang, W. Wei, S.B. Yin, Int. J. Hydrogen Energy 37 (2012) 15948–15955.
[10] Q.Q. Zhang, X.S. Li, Q. Ma, Q. Zhang, H. Bai, W.C. Yi, J.Y. Liu, J. Han, G.C. Xi, Nat. Commun. 8 (2017).
[11] S. Gu, M. Qin, H. Zhang, J. Ma, H. Wu, X. Qu, CrystEngComm 19 (2017) 6516–6526.
[12] J.B. Goodenough, Prog. Solid State Chem. 5 (1971) 145–399.
[13] J.B. Goodenough, Magnetism and the Chemical Bond. Interscience Monographs on Chemistry, Inorganic Chemistry Section, Interscience Division, John Wiley & Sons, Inc., New York & London, 1963.
[14] J.B. Goodenough, Phys. Rev. 117 (1960) 1442–1451.
[15] D.B. Rogers, R.D. Shannon, A.W. Sleight, J.L. Gillson, Inorg. Chem. 8 (1969) 841–849.
[16] T.A. Sasaki, T. Soga, H. Adachi, Phys. Status Solidi B 113 (1982) 647–655. [17] J.K. Burdett, Inorg. Chem. 24 (1985) 2244–2253.
[18] D. Parker, J.C. Idrobo, C. Cantoni, A.S. Sefat, Phys. Rev. B 90 (2014). [19] V. Eyert, R. Horny, K.H. Hock, S. Horn, J. Phys. Condens. Matter 12 (2000)
4923–4946.
[20] M.A.K.L. Dissanayake, L.L. Chase, Phys. Rev. B 18 (1978) 6872–6879.
[21] L.L. Chase, Phys. Rev. B 10 (1974) 2226–2231.
[22] M. Epifani, P. Imperatori, L. Mirenghi, M. Schioppa, P. Siciliano, Chem. Mater. 16 (2004) 5495–5501.
[23] L. Lutterotti, S. Matthies, H.R. Wenk, MAUD (Material Analysis Using Diffraction): A User Friendly Java Program for Rietveld Texture Analysis and More. Twelfth International Conference on Textures of Materials. (ICOTOM-12), National Research Council of Canada, Ottawa, Montreal, Canada, 1999, pp. 1599–1604. [24] IUPAC, Compendium of chemical terminology. The "Gold Book", 2nd ed., Blackwell
Scientific Publications, Oxford, 1997.
[25] N. Sotani, K. Eda, M. Sadamatu, S. Takagi, Bull. Chem. Soc. Jpn. 62 (1989) 903–907.
[26] J.J. Birtill, P.G. Dickens, Mater. Res. Bull. 13 (1978) 311–316.
[27] M. Epifani, E. Comini, R. Diaz, T. Andreu, A. Genc, J. Arbiol, P. Siciliano, G. Faglia, J.R. Morante, ACS Appl. Mater. Interfaces 6 (2014) 16808–16816.
[28] K. Eda, J. Solid State Chem. 83 (1989) 292–303.
[29] A. Bonilla-Petriciolet, D.I. Mendoza-Castillo, H.E. Reynel-´Avila (Eds.), Adsorption Processes for Water Treatment and Purification, Springer International Publishing, 2017.
[30] N. Villota, J.M. Lomas, L.M. Camarero, J. Photochem. Photobiol. A 329 (2016) 113–119.
[31] A. Ajmal, I. Majeed, R.N. Malik, H. Idriss, M.A. Nadeem, RSC Adv. 4 (2014) 37003–37026.
[32] Y.-H. Chiu, T.-F.M. Chang, C.-Y. Chen, M. Sone, Y.-J. Hsu, Catalysts 9 (2019). [33] M.T. Greiner, M.G. Helander, W.-M. Tang, Z.-B. Wang, J. Qiu, Z.-H. Lu, Nat. Mater.
11 (2012) 76–81.
[34] Z. Zhang, Y. Yu, P. Wang, ACS Appl. Mater. Interfaces 4 (2012) 990–996. [35] H. Ghasempour, M. Dehestani, S.M.A. Hosseini, Struct. Chem. 31 (2020)
1403–1417, https://doi.org/10.1007/s11224-020-01499-8.