DOI 10.1007/s00531-016-1349-5 ORIGINAL PAPER
Multidisciplinary approach to constrain kinematics of fault zones
at shallow depths: a case study from the Cameros–Demanda
thrust (North Spain)
A. M. Casas‑Sainz1 · T. Román‑Berdiel1 · B. Oliva‑Urcia2 · C. García‑Lasanta1 · J. J. Villalaín3 · L. Aldega4 · S. Corrado5 · C. Caricchi5 · C. Invernizzi6 · M. C. Osácar1
Received: 18 January 2016 / Accepted: 1 June 2016 © Springer-Verlag Berlin Heidelberg 2016
deformation, thus confirming that the protolith for most of the fault rocks is the footwall of the main thrust. Kinematic indicators (foliation, S/C structures, and slickenside stria-tions) indicate altogether a dominant NNW movement of the hanging wall in the western zone and NE in the eastern zone of the thrust, thus implying strain partitioning between different branches of the main thrust. The study of AMS in fault rocks (nearly 400 samples of fault gouge, breccia, and microbreccia) indicates that the strike of magnetic foliation is oblique to the transport direction and that the magnetic lineation parallelizes the projection of the transport direc-tion onto the kmax/kint plane in sites with strong shear defor-mation. Paleomagnetism applied to fault rocks indicates the existence of remagnetizations linked to thrusting, in spite of the shallow depth for deformation, and a strong defor-mation or scattering of the magnetic remanence vectors in the fault zone. The application of the described techniques
Abstract Thrusting at shallow depths often precludes
analysis by means of structural indicators effective in other geological contexts (e.g., mylonites, sheath folds, shear bands). In this paper, a combination of techniques (includ-ing structural analysis, magnetic methods, as anisotropy of magnetic susceptibility and paleomagnetism, and paleo-thermometry) is used to define thrusting conditions, defor-mation, and transport directions in the Cameros–Demanda thrust (North Spain). Three outcrops were analyzed along this intraplate, large-scale major structure having 150 km of outcropping length, 30 km of maximum horizontal dis-placement, and 5 km of vertical throw. Results obtained by means of the different techniques are compared with data derived from cross sections and stratigraphic analy-sis. Mixed-layer illite–smectite and vitrinite reflectance indicating deep diagenetic conditions and mature stage of hydrocarbon generation suggests shallow depths during
* T. Román-Berdiel [email protected] A. M. Casas-Sainz [email protected] B. Oliva-Urcia [email protected] C. García-Lasanta [email protected] J. J. Villalaín [email protected] L. Aldega [email protected] S. Corrado [email protected] C. Caricchi [email protected] C. Invernizzi [email protected] M. C. Osácar [email protected]
1 Departamento de Ciencias de la Tierra, Universidad de
Zaragoza, Pedro Cerbuna 12, 50009 Saragossa, Spain
2 Departamento de Geología y Geoquímica, Universidad
Autónoma de Madrid, Madrid, Spain
3 Laboratorio de Paleomagnetismo, Departamento de Física,
Universidad de Burgos, Burgos, Spain
4 Dipartimento di Scienze della Terra, Sapienza Università di
Roma, Rome, Italy
5 Dipartimento di Scienze, Università Roma Tre, Rome, Italy 6 Scuola di Scienze e Tecnologie, Sezione Geologia, Università
and consistency of results indicate that the proposed multi-disciplinary approach is useful when dealing with thrusts at shallow crustal levels.
Keywords Intraplate thrusting · Fault rock ·
Cameros–Demanda thrust · Transport direction · Magnetic techniques · Paleothermometry
Introduction
Intraplate thrusts are responsible for the uplift of large areas of the continental crust and the re-arrangement of continen-tal segments through significant horizoncontinen-tal displacements (e.g., Smithson et al. 1978; Erslev 1986; Steidtmann and Middleton 1991; Avouac et al. 1993; Zheng et al. 1998; Kley and Voigt 2008; Fernández-Lozano et al. 2011; Cou-bal et al. 2014; Seillé et al. 2015 and references therein). The accurate determination of transport directions and dis-placements of intraplate thrusts is a major issue in plate tectonics reconstruction, especially when displacements are relevant in relation to plate size, as it occurs in Iberia (see De Vicente 2004; Fernández-Lozano 2012 and references therein). Important points when dealing with intraplate thrusts are the total displacement and the depth at which deformation took place, but other equally crucial issues are their transport direction and deformations associated with fault rocks in the thrust zone (Ramsay 1981; Ramsay et al. 1983; Lister and Snoke 1984; Grasemann et al. 1999; Bigi 2006; Alsop 2009; Calamita et al. 2012, among others).
Because of its spectacular outcrop conditions, the Ibe-rian Chain (N Spain) has been the subject of several works dealing with the kinematics of thrusts (Guimerà et al. 1995, 2004; Capote et al. 2002; Simón and Liesa 2011 and refer-ences therein). As some of these authors point out, apparent simple structures can show a complex kinematic history, conditioned by geometry of faults inherited from previ-ous stages or syn-tectonic sedimentation (see also Barrier et al. 2002). As a consequence, several transport directions can be inferred from macro- and mesostructural indicators, related in turn with the complex compressional history of intraplate structures (Capote et al. 2002; De Vicente 2004; Liesa and Simón 2009).
Understanding the kinematics of thrusting involves the knowledge of thermal conditions and mechanical behav-ior of fault rocks associated with thrusting, together with the depth of thrusting and determination of the rock prov-enance (see, e.g., Yonkee et al. 1989; Fauconnier et al. 2014). In this sense, clay minerals and other paleother-mometers as fluid inclusions and vitrinite reflectance have been proved as useful techniques for studying fault rocks (Vrolijk and Van der Pluijm 1999; Schleicher et al. 2012; Trincal et al. 2014). Reactions in clay minerals and organic
matter are irreversible under normal diagenetic and anchi-zonal conditions, so that exhumed sequences generally retain indices and fabrics indicative of their maximum maturity and burial (Caricchi et al. 2015). Therefore, they can provide information on fluid circulation, water/rock ratio, and frictional heating (Balsamo et al. 2014). Mag-netic methods and specifically anisotropy of magMag-netic sus-ceptibility (AMS) and paleomagnetism have been applied to the study of fault rocks with different degrees of success (Hirono et al. 2006; Solum and van der Pluijm 2009; Mer-tainen and Karell 2012; Pomella 2014; Moreno et al. 2014). The quality of the obtained results is strongly dependent on the magnetic properties of materials, the type of fault rocks, and the number of samples used for determining the average magnetic foliation and lineation. In shear zones, the resultant maximum axis of the magnetic susceptibility ellipsoid is assumed to be parallel to the transport direction on C planes (see Parés and Van der Pluijm 2002), although case studies also indicate (1) intermediate orientations at the bisector between S and C planes (Aranguren et al. 1996) and (2) opposite geometrical relationships, with kmax perpendicular to the transport direction and, consequently, parallel to the intersection lineation between C and S planes (Oliva-Urcia et al. 2009; Ono et al. 2010). Because of these ambiguous relationships, it is extremely important to determine in each particular case the type of geometrical relationship between AMS and kinematic indicators both at the outcrop and microscopic scales (Debacker et al. 2004, 2010; Haerinck et al. 2015).
In this work, several techniques (AMS, paleomagnetism, X-ray diffraction of clay minerals, and organic matter opti-cal analyses) are applied to the study of a major thrust zone in the Iberian plate: the Cameros–Demanda thrust. This particular structure was responsible for the relative hori-zontal movement of about 30 km between the Ebro basin (the foreland basin to the Pyrenees) and the inner part of the Iberian plate, and for a vertical displacement of more than 5 km, creating a major sedimentary continental trough fed by the hanging wall of the thrust during Cenozoic times (Casas and Faccenna 2001). In spite of its dimensions, the structure of the Cameros–Demanda thrust is relatively simple, having slight dip changes and lacking vertical-axis rotations (Villalaín et al. 2003; Casas et al. 2009). The com-plete sedimentary record at its footwall also permits dating and characterizing the stages of tectonic activity (Muñoz-Jiménez and Casas-Sainz 1997). Furthermore, because of the good exposures of fault rocks linked to thrusting, the Cameros–Demanda thrust provides an ideal context for get-ting insights into intraplate thrust evolution. Results regard-ing boundary conditions of the shear zone (depth, tempera-ture, transport direction) are compared and complemented with data inferred from classical geological techniques (geological mapping and cross sections, and relationships
with syn-tectonic sediments) to finally obtain a reliable pic-ture of thrusting conditions at the outcropping level.
Geological setting
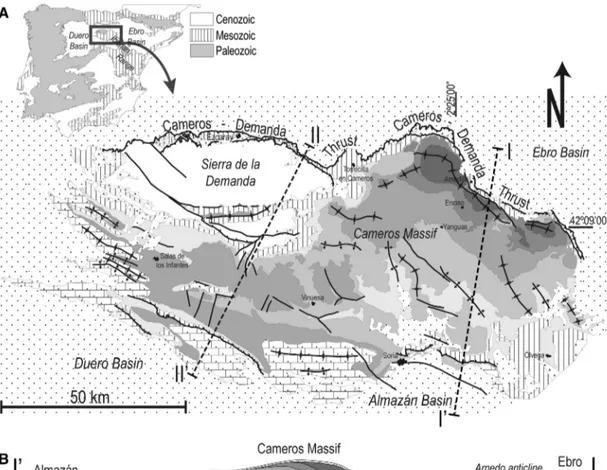
The Cameros–Demanda thrust is one of the most outstand-ing geological structures of the Iberian plate. Its longitu-dinal development is about 150 km along an E–W direc-tion and accommodated 30 km of horizontal displacement and 5 km of vertical throw during Late Eocene–Miocene times (Casas-Sainz 1992; Mas et al. 1993; Guimerà et al. 1995; Muñoz-Jiménez and Casas-Sainz 1997). In its east-ern segments, it results from the inversion of a normal fault bounding the Mesozoic Cameros Basin and an underlying shortcut thrust, whereas to the West the alpine thrust reacti-vated Variscan or Late Variscan structures in the Paleozoic basement (Sierra de la Demanda, Fig. 1). In this western sector (Fig. 1), the cartographic trace of the thrust shows an arcuate shape, with several along-strike changes, from ENE–WSW to E–W (Fig. 1), and NW–SE at the Cameros– Demanda transition area. At the thrust front, two surfaces, branching at depth, can be recognized: the northernmost one superposes Triassic and Jurassic rocks on the Cenozoic at the footwall and the southern one puts Paleozoic rocks on the Mesozoic series.
In the eastern sector (Cameros Massif, Fig. 1), the Cam-eros–Demanda thrust shows three segments with NE–SW, E–W, and NW–SE strikes. Each portion is related to dif-ferent dips of the thrust surface, shallower in the NE–SW segment (12°) and steeper (30°) in the NW–SE segment (Casas-Sainz and Simón-Gómez 1992). The overall geom-etry of the NE–SW segment is a continuous hanging wall flat of Upper Triassic gypsum and shales and Lower Juras-sic limestones thrusting over a footwall ramp of horizon-tal Cenozoic conglomerates and sandstones. In the central sector, striking E–W, there are important outcrops of Upper Triassic shales and gypsum in the hanging wall of the main thrust, and local ramps related to inversion of extensional features inherited from the basinal stage (Casas-Sainz and Gil-Imaz 1998). Finally, in the easternmost sector, the Cameros–Demanda thrust shows two well-defined NW–SE segments, separated by an E–W-striking zone linked to a blind thrust at 1000–1500 m depth resulting from a short-cut during inversion through the Paleozoic basement. In the two NW–SE-striking segments, geometries are varied, showing hanging-wall flats, hanging-wall ramp anticlines, or ramps in both walls, related to the inversion of the nor-mal faults bounding the Mesozoic Cameros Basin.
The kinematics of the Cameros thrust has been discussed in several papers (Guimerà et al. 1995; Casas-Sainz 1992, 1993; Casas-Sainz and Simón-Gómez 1992; Cortés Gra-cia and Casas-Sainz 1997). A dominant top-to-the-north
movement is reported, but details about its kinematics are controversial, because of the divergence between the geo-metrical relationships inferred from the map view of the thrust and the kinematic indicators found in different parts of the thrust surface (see, e.g., Guimerà et al. 1995 and references therein). In this paper, from the application of physicochemical innovative techniques, we present a set of data that strive to shed new light to settle this controversy.
Methods
The three areas sampled for the application of the mag-netic and paleothermometric techniques are located along the thrust front and show good exposures of the Cam-eros–Demanda thrust surface and the rocks at its footwall (Fig. 2): (1) Matute area, located in the NW–SE-striking segment in the Sierra de la Demanda sector; (2) Panzares area, in the NE–SW-striking segment and hanging wall flat in the Cameros Massif sector; and (3) Préjano area, in the E–W segment where the outcropping thrust is the inverted normal fault responsible for the formation of the Cameros basin during the Mesozoic. Although most data come from locality (1), because its outcrop conditions allow sampling in different levels and a strict control of the structure of the hanging wall and the footwall, the different rock types, intensity of deformation, and structure found in these three localities are an added value for the understanding of the structure and kinematics of the Cameros–Demanda thrust as a whole.
Structural analysis
Common techniques for determining the transport direction of thrusts are derived from geometrical features, according to (1) the shape of thrusts in map view and the application of the bow and arrow rule (Elliot 1976), or (2) the cross-cutting relationships in the hanging wall and the footwall (Alonso 1987; Pérez-Estaún et al. 1988). In particular tec-tonic contexts, as for example, basin inversion, the geom-etry of thrust surfaces can be controlled by other factors, such as faults inherited from the extensional stage or base-ment faults (i.e., De Graciansky et al. 1989), that alter the application of simple geometrical rules. Other kinematic indicators rely upon outcrop-scale shear criteria (Ramsay 1967; Ramsay and Huber 1987) or the microscopic studies of shear zones (Law 1998 in Snoke et al. eds.).
Geometrical relationships between thrust surfaces and the pre- and syn-tectonic sedimentary units at their hanging walls and footwalls were determined by means of detailed geological mapping and cross sections (Figs. 1, 2). System-atic measurements of bedding were also taken at the hang-ing wall of the thrust cropphang-ing out in the Préjano area and
Fig. 1 Location of the Cameros–Demanda thrust within the Iberian
Chain (modified from García-Lasanta et al. 2013) (a), and cross sec-tions showing the overall structure of the thrust in the eastern (Cam-eros Massif, modified from Mata et al. 2001) (b), and western (Sierra
de la Demanda) (c) areas. In the western area, the structure is defined by a basement thrusting and uplift, whereas to the east, it results from the inversion of the early cretaceous extensional basin and a shortcut thrust in the lower branch
at the intermediate slice of Mesozoic rocks in the Matute area. Analysis of shear zones included orientation of folia-tion and S/C structures at the outcrop scale and micro-scopic study of oriented thin sections obtained from speci-mens sampled for AMS studies.
Paleothermometry
Clay minerals in shales and sandstones undergo dia-genetic and very low-grade metamorphic reactions in response to sedimentary and/or tectonic burial. One of the parameters generally used to provide information on thermal evolution of sedimentary successions is the vari-ation in composition and stacking order of mixed-layered minerals. In particular, mixed-layer illite–smectite (I–S) is widely used in petroleum exploration as a geothermome-ter and, thus, as indicators of the thermal evolution of sed-imentary sequences (Aldega et al. 2007, 2011; Bigi et al. 2009; Corrado et al. 2010; Pollastro 1990). The identified changes comply with the following scheme of progressive
thermal evolution that has been correlated to the stages of hydrocarbon generation: di-smectite—disordered mixed layers (R0)—ordered mixed layers (R1 and R3)—illite— dioctahedral K-mica (muscovite). XRD analyses were performed with a Scintag X1 X-ray system (CuKα radi-ation) at 40 kV and 45 mA. Randomly oriented whole-rock powders were run in the 2°–70° 2θ interval with a step size of 0.05° 2θ and a counting time of 3 s per step. Oriented air-dried and ethylene–glycol solvated samples were scanned from 1° to 48° 2θ and from 1° to 30° 2θ, respectively, with a step size of 0.05° 2θ and a count time of 4 s per step. The illite and chlorite content in mixed-layer I–S and C–S was determined according to Moore and Reynolds (1997) using the delta two-theta method after decomposing the composite peaks between 9°–10° 2θ and 16°–17° 2θ for I–S and between 10°–12.3° 2θ and 25°–26° 2θ for C–S. The I–S ordering type (Reichweite parameter, R; Jagodzinski 1949) was determined by the position of the I001-S001 reflection between 5 and 8.5° 2θ (Moore and Reynolds 1997).
Fig. 2 Geological sketch of the Cameros Massif and the Cameros–Demanda thrust, with the location of the three studied sectors and cross
Vitrinite derives from the thermal degradation of lignin and cellulose, and can be found in kerogens rich in high plant fragments and in coals (Stach et al. 1982). As the maturity increases, a progressive ordering takes place in the vitrinite molecular structure, which determines an increas-ing reflection capacity of incident light. Vitrinite reflectance strictly depends on the thermal evolution of the hosting sediments and is correlated to the stages of hydrocarbon generation, coal rank, and other thermal parameters in sedi-mentary environments (Durand 1980). Vitrinite reflectance becomes anisotropic from maturity levels in the oil win-dow (about 1 %) and increases with increasing maturity. Thus, in organic diagenesis and catagenesis, random reflec-tance (Ro%) is generally used, whereas from metagenesis onward, Rmax is generally preferred to describe levels of coalification. Specimens for vitrinite reflectance were pre-pared according to standardized procedures described in Bustin et al. (1990). Picked kerogen particles were cold set into epoxy resin blocks and polished using carborun-dum papers and isopropanol as lubricant. After washing the sample in order to remove debris, three alumina powders of decreasing grain size (1, 0.3, 0.01 µm) were used to polish the samples. Random reflectance was measured under oil immersion (ne 1.518, at 23 °C), with a Zeiss Axioskop 40 A pol microscope-photometer system and calibrated against standards of certified reflectance. On each sample, meas-urements were taken on vitrinite or bitumen unaltered frag-ments. Mean vitrinite (Ro%) and bitumen (Rb%) reflectance values were calculated from the arithmetic mean of these measurements. Rb values have been converted into vitrin-ite reflectance equivalent values (Roeq%) according to Jacob and Hiltmann (1985).
Magnetic techniques: RT‑AMS, LT‑AMS, AARM, and paleomagnetism
Sampling for AMS and paleomagnetic analyses was done with a gas-powered drill machine in hard rocks and an elec-tric drill in marls, shales, fault gouge, and microbreccia. Most sites are located in fault rocks whose protoliths are Cenozoic rocks belonging to the footwall of the main thrust since rocks in the hanging wall (mainly marine Jurassic limestones) do not show internal deformation at the out-crop scale. Samples were collected from 23 sites distrib-uted in the three sampled areas: 13 sites at the Matute area (named as FCA in Table 3), 7 sites at the Panzares area (PA in Table 3), and 3 sites at the Préjano area (PRE in Table 3). A total of 395 standard specimens (2.5 cm in diameter, 2.1 cm in height) were obtained from the three sampled areas.
The specimens were measured for their AMS at room temperature (RT-AMS) with a KLY-3S susceptibility meter (AGICO, Czech Republic), a bridge at low magnetic field
(300 A/m, 875 Hz) at the University of Zaragoza. These measurements provide the orientations and magnitudes of the kmin ≥ kint ≥ kmax axes of the AMS ellipsoid, hence help to define the fabric that is characterized by the magnetic lineation (kmax) and the magnetic foliation (plane perpen-dicular to kmin). Relationship between these axes (normal-ized by means of Jelinek’s method 1977, Table 1) provides (Jelinek 1981) (1) the corrected anisotropy degree, P′, giving the intensity of the preferred orientation of miner-als, and (2) the shape parameter, T, which varies between
T = −1 (prolate ellipsoids) and T = +1 (oblate ellipsoids):
where µ1, µ2, and µ3 represent ln(kmax), ln(kint), and ln(kmin), respectively, and µm = (µ1 + µ2 + µ3)/3. The average direc-tional and scalar value for each site was calculated using Jelinek (1978) statistics with Anisoft 4.2 (Chadima and Jelinek 2009).
In order to characterize the mineralogy of the suscepti-bility carriers, temperature-dependent magnetic susceptibil-ity (k–T) curves were performed from ≈50 mg rock pow-ders coming from 9 specimens covering the whole range of susceptibility values. A decreasing hyperbolic shape of the initial part of the heating curves is typical for paramagnetic minerals while a straight and slight positive slope indicates the presence of ferromagnetic phases (Hrouda et al. 1997). The presence of ferromagnetic phases is also marked by a sharp decrease in susceptibility at high temperature due to the Curie or Néel transition from ferromagnetic to para-magnetic behavior. In this study, the peak method and the 1/k method (Lattard et al. 2006; Petrovsky and Kapicka 2006) were used to determine the Curie or Néel tempera-tures. In addition, cooling runs are used to check the revers-ibility of the heating curves and therefore the stability of the magnetic phases. These experiments are performed using the KLY-3 kappabridge combined with a CS-3 fur-nace (temperature range between 40 and 700 °C, AGICO), according to heating rates around 13°/min, under argon atmosphere in order to reduce mineral oxidations. The raw data, corrected for the empty furnace, were processed using Cureval 8.0 software (Chadima and Hrouda 2009).
AMS at low temperature (LT-AMS) was also used to elucidate the respective contributions of both principal magnetic carriers (ferromagnetic s.l. and paramagnetic) of the magnetic fabric, by means of both the magnetic suscep-tibility value and the orientation of the three magnetic axes. Low temperatures enhance the magnetic susceptibility of paramagnetic minerals, as established by the Curie–Weiss law (k = C/T − Tc), where k is the paramagnetic suscepti-bility, C is the Curie constant, T is the absolute temperature,
P′=exp 2 (µ1−µm)2+(µ2−µm)2+(µ3−µm)2 , T =2µ2−µ1−µ3 µ1−µ3 ,
and Tc is the Curie temperature (Ritcher and van der Pluijm 1994; Dunlop and Özdemir 1997; Parés and Van der Pluijm 2002). Assuming an ideal paramagnetic phase with a para-magnetic Curie temperature (Tc) around 0 K, its expected magnetic susceptibility at low temperature (77 K) would be approximately 3.8 times higher than at room temperature (i.e., the ratio of temperatures, 292/77, Ritcher and van der Pluijm 1994; Lüneburg et al. 1999). The presence of fer-romagnetic s.l. minerals (which have Tc different than 0 K) decreases this ratio (Oliva-Urcia et al. 2010a). The LT-AMS measurements were taken on 40 standard specimens from 7 sites, with the same apparatus and software used at room temperature. The sites were selected depending on their bulk susceptibility value, the orientation of kmax, and the scattering of the axes of the magnetic ellipsoid at room temperature. The analyzed specimens were immersed for 30–40 min in a Dewar filled with liquid nitrogen before measurement (in order to acquire a homogeneous tempera-ture of −195 °C/77 K), and again for 10 more min between each of the three spinner positions required by the measure-ment procedure. This technique gives reproducible results (Hirt and Gehring 1991; Lüneburg et al. 1999; Oliva-Urcia et al. 2010a, b).
When the magnetic fabric results from the contribution of ferro- and paramagnetic phases, AARM (anisotropy of the anhysteretic remanent magnetization) is useful to sepa-rate the ferromagnetic s.l. subfabric (Martín-Hernández and Ferré 2007). In our case, AARM was applied to three sites with 5–7 specimens per site representative of the three studied areas. It was applied using the AF system of the 2G-cryogenic magnetometer at the University of Burgos. Specimens were subjected to an AF demagnetizing peak field of 90 mT while a 0.05 mT direct field was applied. This procedure was performed in nine different axes for every specimen, measuring the remanent magnetization for every position in the 2G-cryogenic magnetometer. After each measurement, the specimen was demagnetized along three orthogonal directions with an AF peak field of 100 mT. The computation of the AARM ellipsoid, which enables identification of the low coercivity ferrimagnetic subfabric, is done using the University of Burgos’ modified version of the MS Excel provided by the Institute for Rock Magnetism, University of Minneapolis. Averages for each site were performed with Stereonet 9.2.0 (Allmendinger et al. 2013; Cardozo and Allmendinger 2013).
Since processes linked to thrusting are liable to produce remagnetizations, paleomagnetic analyses in fault rocks can a priori give clues about (1) the age of remagnetiza-tion (by means of the paleomagnetic direcremagnetiza-tion resulting from the acquisition of remagnetization), (2) the intensity of deformation (since ferromagnetic particles can be reori-ented by internal deformation of the whole-rock volume after magnetization acquisition, see, e.g., Kligfield et al.
Table
1
X-ray dif
fraction mineralogical assemblages of f
ault rocks
FCA, Matute; P
A, P
anzares; CP
, Préjano; Qtz, quartz; Cal, calcite; Dol, dolomite; Kfs, K-feldspar; Ph
y, ph
yllosilicates; Plg, palygorskite; Kln, kaolinite; Chl, chlorite; I–S, mix
ed-layer illite–
smectite; C–S, mix
ed-layer chlorite–smectite;
I, illite;
R
, stacking order; %I in I–S, illite content in mix
ed-layer illite–smectite; %C in C–S, chlorite content in mix
ed-layer chlorite–smectite
Sample
Latitude
Longitude
Rock type
Mineralogy of the whole rock (wt%)
X-ray quantitati
ve analysis of the
<2
µm
grain size fraction (wt%)
R %I in I–S %C in C–S Qtz Cal Dol Kfs Phy Plg I I–S C–S Kln Chl FCA1A N42°16 ′59.6 ″ W2°48 ′37.5 ″ Microconglomerate 3 60 – – 37 – 59 38 3 – – 0/3 30/85 80 FCA1B N42°16 ′59.6 ″ W2°48 ′37.5 ″ Microconglomerate 1 76 – – 23 – 70 25 2 – 3 0/3 30/85 90 PA 1 N42°17 ′10.5 ″ W2°33 ′52.6 ″ Microconglomerate 17 43 2 1 37 57 32 1 – 6 4 3 85 – PA 3 N42°17 ′10.5 ″ W2°33 ′52.6 ″ Calcarenite 3 52 – 1 44 – 92 2 – 3 3 3 82 – PA 6 N42°17 ′10.5 ″ W2°33 ′52.6 ″ Microconglomerate 27 32 1 1 39 64 27 1 – 3 5 3 86 – CP1B N42°10 ′27.6 ″ W2°11 ′9.2 ″ Sandstones 56 – – 5 39 – 50 10 12 22 6 3 85 80 CP1H N42°10 ′27.6 ″ W2°11 ′9.2 ″ Shale 43 – – 3 54 – 59 10 7 20 4 3 85 80
1983; Cogné and Perroud 1985; Lowrie et al. 1986; Bor-radaile 1997; Oliva-Urcia et al. 2010c), and (3) other pro-cesses underwent by fault zones such as horizontal- or vertical-axes rotations (by means of deviations of the paleo-magnetic vector, especially azimuth, with respect to reason-able directions). Furthermore, paleomagnetism also allows to obtain information about the magnetic mineralogy and probable magnetic carriers of the AMS. In order to acquire paleomagnetic data, 86 specimens from 11 different sites (7–8 specimens per site) in the three studied areas were chosen to be thermally demagnetized from room tempera-ture to 685 °C at temperatempera-ture steps between 50 and 10 °C. A TD48 ASC furnace and a 2G cryogenic magnetometer at the paleomagnetic laboratory of the University of Bur-gos were used to stepwise demagnetize the specimens and to measure their remanence, respectively. Lithology of specimens is variable and corresponds mainly to brecciated conglomerates with reddish matrix, and grayish siltstones and limestones. Characteristic components following the principal component analyses (PCA, Kirschvink 1980) and demagnetization circles (Bailey and Halls 1978) were cal-culated using Remasoft 3.0 software (Chadima and Hrouda 2006). When possible, site averages were obtained using Fisher (1953) statistics by means of Stereonet 9.2.0 (All-mendinger et al. 2013; Cardozo and Allmendinger 2013).
Results
Structural features. Kinematic indicators
In the Matute area, the Cameros–Demanda thrust shows a slice of Mesozoic rocks (Upper Triassic to Lower Creta-ceous) between the Paleozoic ones in the hanging wall and the shallow-dipping Cenozoic deposits of the Ebro Basin that show a footwall ramp geometry (Fig. 2 cross section of Matute sector). Overturned beds (younging northward), within this horse, show at least two hectometric-scale folds, defining an antiformal syncline and a synformal anticline. Mean fold axis is parallel (or slightly oblique) to the dip direction of the thrust surfaces (Fig. 3b), indicating fold-ing consistent with dextral-reverse shear between the two NW–SE-striking thrust surfaces (Cortés Gracia and Casas-Sainz 1997). Syn-tectonic sedimentary deposits cut by the thrust correspond to R3 and R4 units of Muñoz-Jiménez and Casas-Sainz (1997), Oligocene–Miocene in age, that allow to assign a minimum displacement of 2000 m and probable maximum depths of 500 m for thrusting in these rocks (Fig. 2 cross section of Matute sector).
At the contact with the lower thrust surface, overturned beds of Jurassic limestones in the hanging wall become parallel to the main thrust (Fig. 3b, c). In the footwall, the Cenozoic conglomerates show up to three secondary,
synthetic, shallow-dipping fault surfaces, with a spacing of several meters (Fig. 3b). Between these faults, conglom-erates are strongly deformed showing pressure solution cleavage associated with S/C structures. Strike of cleavage planes ranges between E–W and NW–SE with an average WNW–ESE, dipping 60°S (Fig. 3b). Orientations of C and thrust planes are more irregular and generally show shal-lower dips. Intersection lineations between S and C planes show a mean plunge of 20°W. Striations on fault surfaces show a maximum about 170 and are sub-horizontal, more or less perpendicular to the intersection lineation between S and C planes (Fig. 3b).
At the microscopic scale, pressure solution cleavage can be clearly distinguished, having different degrees of development according to the distance to the main thrust (Fig. 6a–c). Cleavage surfaces are clearly developed in the sandy to clayey matrix, concentrate on opaque minerals (probably Fe oxides), and show a sigmoidal shape at the intersection with C planes and surrounding the limestone clasts.
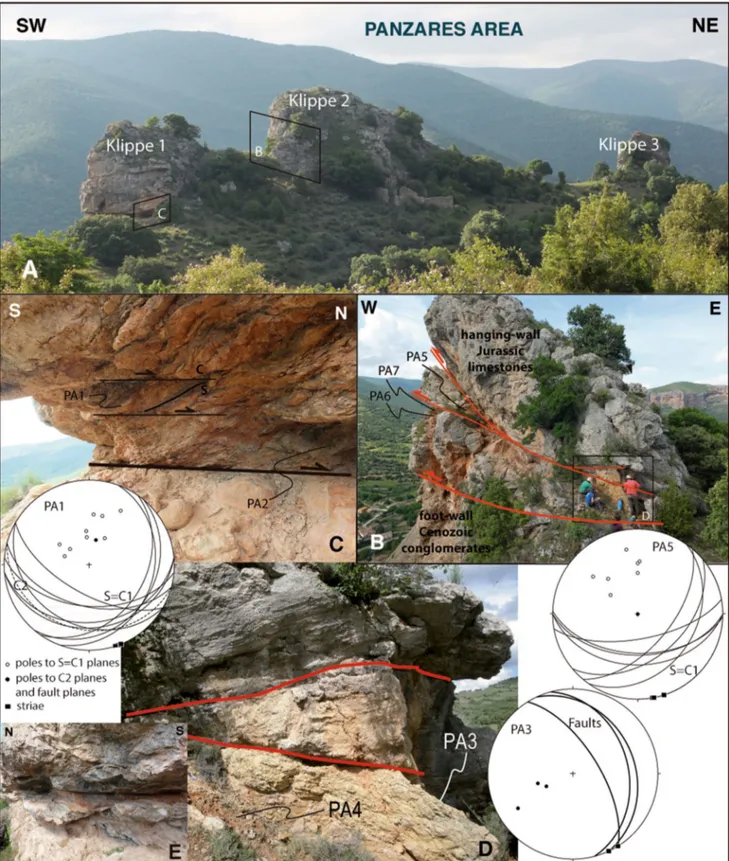
In the Panzares area, the marine Jurassic limestones belonging to the hanging wall of the Cameros thrust are preserved in three klippen overlying the horizontal Ceno-zoic conglomerates of unit R3 (Upper Oligocene, Muñoz-Jiménez and Casas-Sainz 1997; Figs. 2, 4a–c) with flats in both walls. The main thrust surface is practically horizontal (Fig. 4b–d), and secondary thrusts affecting the hanging wall show dips up to 30° toward the SW and NE (Fig. 4b, e). According to our cross section (Fig. 2 cross section of Panzares sector), the minimum horizontal displacement is about 0.5 km, and the maximum depth for the development of structures is about 600 m. S/C structures develop in a clayey level located at the thrust surface (Fig. 4c): Slaty cleavage planes show NE–SW to E–W strike and interme-diate dips to the South; shear planes are sub-horizontal or show shallow dips and highly variable intersection line-ations (Fig. 4c PA1). Several generations of C planes can be observed in thin section, some of them consisting of net surfaces concentrating phyllosilicates and probable Fe oxides and the younger ones involving thicker bands and cataclasis along the shear surfaces (Fig. 6e). The geometri-cal arrangement of different generations of C planes indi-cates that the dominant shear direction probably changed
Fig. 3 Photographs showing the studied sites at the Matute
sec-tor. a Cameros–Demanda thrust at Matute; overall view showing the north-verging folds of Jurassic limestones in the hanging wall and the horizontal Cenozoic sequence in the footwall. b Close-up view of the Cameros–Demanda thrust in the same site, showing three minor thrust surfaces in the Cenozoic brecciated conglomerates of the foot-wall and stereoplots of structural data at the same sector (lower hemi-sphere equal area projection). Stereoplot is done with R.W. Allmend-inger’s Stereonet program (Allmendinger et al. 2013; Cardozo and Allmendinger 2013). c Calcareous breccia just below the main thrust surface
Fig. 4 Photographs showing the studied sites at the Panzares
sec-tor. a Cameros–Demanda thrust in the Panzares area; overall view showing three klippen. b Close-up view of the Cameros–Demanda thrust in the same site, showing the second klippe of Lower Jurassic limestones. c S/C structures in the fault zone of the first klippe. d,
e Close-up view of the thrust plane in the second klippe. Stereoplot
of structural data at the same sector (lower hemisphere, equal area projection). Stereoplot is done with R.W. Allmendinger’s Stereonet program (Allmendinger et al. 2013; Cardozo and Allmendinger 2013)
its plunge during the deformation process, from steeply plunging to the SE (corresponding to C1 planes in Fig. 6e) to shallowly plunging in the same direction (corresponding to C2 planes in Fig. 6e). During this second stage, C1 sur-faces were probably re-activated as foliation planes (identi-fied in outcrop as S surfaces), thus preserving their original structure within the microlithons. Within the conglomer-ates, pressure solution structures and shear bands are also present (Fig. 6f). In outcrop and thin section, S/C structures and striae on C planes are consistent with an average move-ment of the hanging wall toward the NNW (Fig. 4c).
In the Préjano area, the outcropping thrust surface cor-responds to the inverted Mesozoic fault bounding the Cam-eros basin toward the north. During the Cenozoic inversion, a shortcut formed in its footwall and the total shortening is distributed between two thrusts (Muñoz-Jiménez and Casas-Sainz 1997): a blind lower thrust with a horizontal displacement of about 15 km, and an upper thrust (crop-ping out in the Préjano area) with a minimum displacement of 2 km and a hanging wall flat-footwall ramp geometry (Fig. 5a). In the hanging wall, a complete marine Jurassic series crops out, and in the footwall an overturned sequence of Albian sandstones and coal measures (Fig. 5a, b), over-lain by Cenozoic conglomerates, and sandstones (units R2 and R5, separated by an unconformity) can be seen (Fig. 2 cross section of Préjano sector). Thrusting involves the coal-bearing Albian deposits, having shear zones and slickenside striations (Fig. 5c, d). Fault rocks are marls and sandstones located in the footwall of the thrust. Thin-section observations indicate gouge and microbreccia with clear foliation, which is defined by changes in color prob-ably related to different coal content, and incipient, rela-tively short C surfaces that cannot be distinguished at the outcrop scale (Fig. 6d). The transport direction of the thrust can be estimated from the (highly variable) slickenside stri-ations on the fault plane (Fig. 5d) and the fold axis obtained from the normal (hanging wall) and overturned (footwall) beds. Both markers point to a NE-directed movement of the hanging wall.
Paleothermal results: mixed‑layer I–S analyses
X-ray diffraction analyses of whole-rock samples and <2 µm grain size fraction are shown in Table 1. Sam-ples are from S/C structures in Cenozoic conglomerates near the fault surface in the Matute (FCA samples) or in Panzares (PA samples) area and from Albian sandstones and shales at the footwall of the thrust in the Préjano area (note that samples from this area are noted as CP in Table 1).
In the Matute area, fault rocks are mainly composed of calcite (mean 68 %), phyllosilicates (30 %), and minor amounts of quartz (2 %). In the <2 µm grain size fraction,
among the phyllosilicates group, illite and mixed-layer illite–smectite are the major minerals with subordinate amounts of mixed-layer chlorite–smectite (C–S). Mixed-layer I–S corresponds to long range ordered I–S with an illite content of 85 % and high expandable I–S with an illite content of 30 % (Fig. 7a). The coexistence of two popu-lations of mixed-layer I–S together with the presence of mixed-layer C–S suggests the superposition of reactions typical of low grade on preexisting higher-grade mineral assemblages. These retrograde reactions have been well documented in a variety of geological settings as fluid-mediated processes occurring under diagenetic conditions (Nieto et al. 2005).
In the Panzares area, Cenozoic conglomerates are mainly characterized by calcite, phyllosilicates, and quartz, whereas dolomite and k-feldspar occur as minor phases (<2 %; Table 1). X-ray patterns of the <2 µm grain size fraction show an illite- or palygorskite-rich composition and small amounts of kaolinite (mean 4 %), chlorite (4 %), and mixed-layer I–S (1 %; Fig. 7b). Palygorskite forms as a result of the interaction along faults of Si- and Mg-rich alkali oxidized fluids with fragmental minerals such as chlorite at temperatures between 50 and 150 °C (Haines and Van der Pluijm 2012) or generally <200 °C (Jones and Galan 1988). Mixed-layer I–S displays R3 stacking order and an illite content between 82 and 86 %, indicating deep diagenetic conditions.
In the Préjano area, both shales and sandstones at the footwall of the thrust show a mineralogical composition made of quartz, phyllosilicates, and k-feldspar. The <2 µm grain size fraction is mostly characterized by an illite-rich composition (50–59 %) and subordinate amounts of kaolin-ite (20–22 %), mixed-layer I–S (10 %) and C–S (7–12 %), and chlorite (4–6 %; Table 1; Fig. 7c). Temperature-dependent clay minerals are R3 mixed-layer I–S with an illite content of 85 %, indicating deep diagenetic conditions and shallow burial depths.
Paleothermal results: vitrinite reflectance analyses
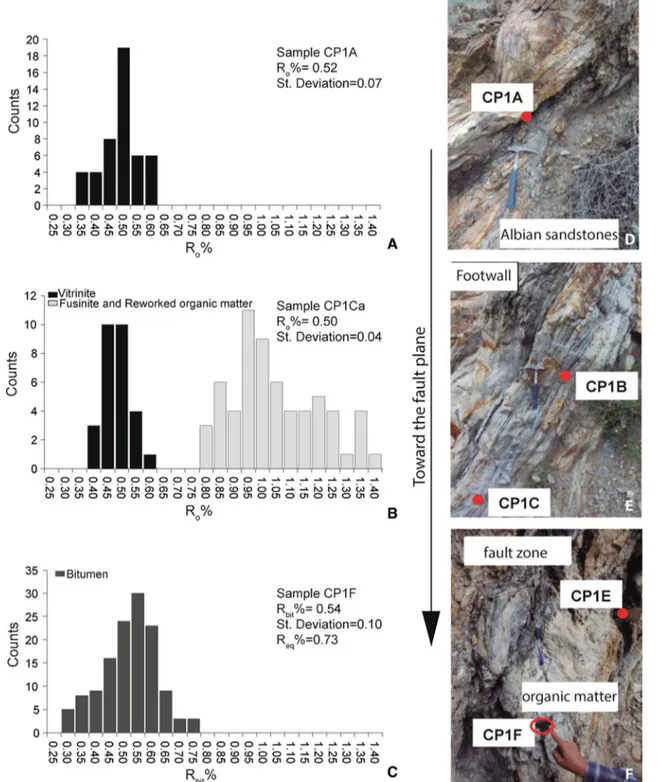
Results of optical analyses on organic matter dispersed in sediments are summarized in Table 2. In the Préjano area, samples were collected at the thrust footwall, mainly from sandstone layers. Charcoal preserved in thin laminas (CP1A) and organic fragments dispersed in silty and clayey beds (CP1Ca) were collected a few meters from the thrust surface, whereas bitumen (CP1E, CP1F) was sampled closer to it (Figs. 2, 8).
Microscopic analyses highlight that samples are char-acterized by abundant, well-preserved organic fragments. Sample CP1C shows fragments belonging to the hum-inite–vitrinite group and subordinately to the fusinite group. Moreover, pyrite is locally present, either finely
dispersed or in small globular aggregates, associated with both groups of macerals. Histogram for CP1A coal sam-ple is characterized by unimodal distribution with a mean value of 0.52 ± 0.07 (Fig. 8a). Sample CP1Ca shows a bimodal distribution: vitrinite group macerals with mean values of 0.50 ± 0.04, and fusinite macerals and reworked materials whose mean reflectance was not taken into account (Fig. 8b). Bitumen samples (CP1E, CP1F) suggest a unimodal distribution of reflectance with mean values of 0.52 ± 0.11 and 0.54 ± 0.10, respectively (Fig. 8c), corre-sponding to equivalent reflectance values of 0.72 and 0.73 using Jacob and Hiltmann’s equation (1985). These values of reflectance indicate temperatures of about 83–84 and 109–110 °C, respectively.
Reflectance data indicate diagenetic conditions in the footwall of the Cameros thrust. Furthermore, a slight increase in thermal maturity moving toward the fault sur-face is detected from the early mature stage (about 0.5 % on coal and dispersed organic matter) to the mature stage of hydrocarbon generation (about 0.7 % on bitumen).
Magnetic methods: magnetic mineralogy
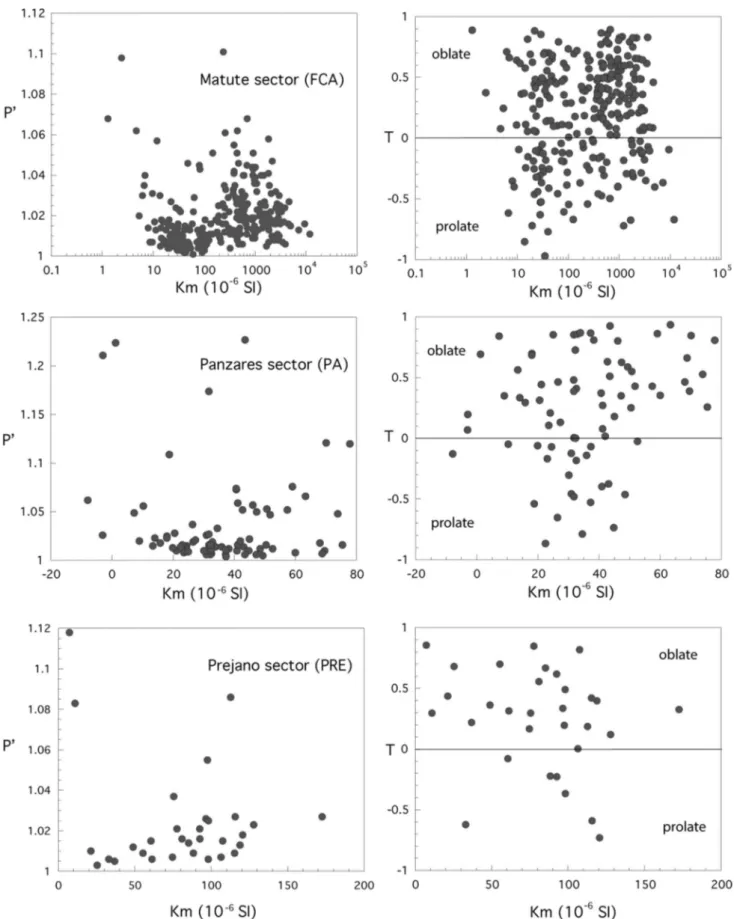
The sampled rocks show a large range of bulk magnetic susceptibility values, from negative (8 out of 395 speci-mens, in the Matute and Panzares sectors) to very high values in the Matute sector, reaching 11788 × 10−6 SI (specimen FCA15-9b, Fig. 9). At the Panzares and Préjano sectors, all specimens show bulk magnetic susceptibil-ity values lower than 80 and 180 × 10−6 SI, respectively (Fig. 9). At the Matute sector, the high values of suscepti-bility are present in the three levels of fault breccia devel-oped in the Cenozoic conglomerates (Table 3).
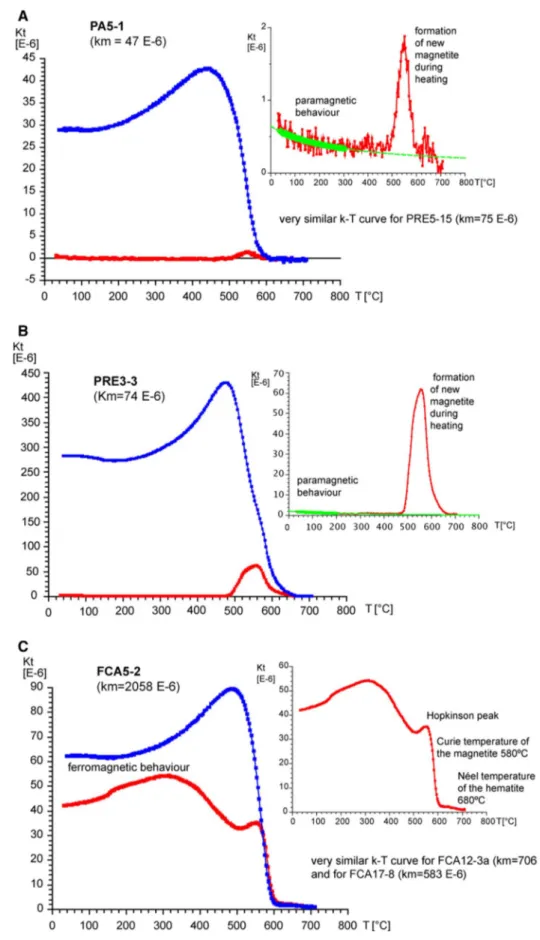
Thermomagnetic (k–T) curves can be grouped into two types: (1) In the 6 measured specimens having low mag-netic susceptibility values (Km < 100 × 10−6 SI, Fig. 10a, b), k–T curves show a decreasing heating curve beginning with a hyperbolic shape, indicating that the paramagnetic fraction (probably due to phyllosilicates) controls the sus-ceptibility at room temperature. These curves show an abrupt increase in susceptibility from 450–550 °C and then a sudden drop. The conspicuous increase in susceptibility of the cooling curve in this temperature interval points to
the neoformation of magnetite at high temperatures. (2) In the 3 specimens having high values (Fig. 10c), k–T curves beginning by a slight positive slope are typical for the pres-ence of ferromagnetic phases. This is also evidpres-enced by sharp decreases in susceptibility at the Curie or Néel tem-perature characteristic of each mineral. Curves FCA17-8, FCA12-3a, and FCA5-2 (Fig. 10c) show a progressive decrease in susceptibility above 325 °C. The increase observed above 500 °C is probably a Hopkinson peak, in the vicinity of the Curie temperature of magnetite at 580 °C. A final decay of susceptibility at 680 °C points to the Néel temperature of hematite. These data suggest that magnetite and to a lesser degree hematite are the main fer-romagnetic minerals in the Matute sector, in samples hav-ing high magnetic susceptibility (Fig. 10c).
AMS results: directional features of RT‑AMS
As a whole, the magnetic foliation is better clustered than the magnetic lineation, consistently with the predominance of oblate ellipsoids (Fig. 11a, b). In the Matute area, the maximum of magnetic foliation (005, 32) indicates a main WNW–ESE strike with steep dips. The maximum of mag-netic lineation is well defined (140, 48), in spite of scat-tering of data, because of the high amount of collected specimens. In a closer look, magnetic fabrics vary depend-ing on the location of the sites with respect to the thrust surface, relatively constant in the deformed Cenozoic con-glomerates of the footwall, with intermediate-plunging, SE-oriented magnetic lineation and kmin axes oblique to the thrust plane (sites FCA3 to FCA5 and FCA10 to FCA17, Fig. 12a; Table 4), and more variable in the calcareous breccia of the shear zone just below the main thrust surface. Here, magnetic lineation shows shallow plunges and varies in orientation from NE–SW to N–S and E–W (sites FCA6, FCA8, and FCA9, respectively, Fig. 12a; Table 4). This variability also involves the magnetic foliation that changes between sites from NE–SW to NW–SE strikes. Results of magnetic fabrics in the Jurassic limestones of the hanging wall are poor, with high scattering (sites FCA2 and FCA7, Fig. 12a), although relatively consistent with the directions obtained in the footwall.
In the Panzares area, the magnetic foliation shows E–W to NE–SW strikes and variable dips. Variability in the strike of magnetic foliation is partly due to its shallow dips. Shal-low plunging magnetic lineations dominate (except in site PA5, Fig. 12b) varying from the strike to the dip directions of the magnetic foliation. Magnetic lineation trends E–W in sites PA1 and PA6; NE–SW in sites PA4 and PA7; and N–S in sites PA2, PA3, and PA5 (Fig. 12b; Table 4). In gen-eral, it is distributed along a girdle shallowly dipping to the South.
Fig. 5 Photographs showing the studied sites at the Préjano sector. a
Cameros–Demanda thrust in the Préjano area, showing the Jurassic limestones in the hanging wall and the Albian sandstones and shales in the footwall. b, c Close-up view of the thrust in the same area showing the location of sites and deformed coal seams in the proxim-ity of the thrust surface. d Stereoplot of structural data at the same sector (lower hemisphere equal area projection). Stereoplot is done with R. W. Allmendinger’s Stereonet program (Allmendinger et al. 2013; Cardozo and Allmendinger 2013)
Finally, in the Préjano area, where a lower number of specimens were analyzed, a NW–SE strike with very vari-able dips dominates for the tectonic foliation (Figs. 11b,
12c) and an average sub-horizontal plunge and NW–SE trend for the better grouped magnetic lineation (Figs. 11b, 12c).
Fig. 6 Photographs of thin sections representative of the fault rocks in the three studied areas showing different aspects of the S/C structures. A–c are referring to the Matute area. d Préjano area. e, f Panzares area. Width of photographs 2 cm
LT‑AMS and AARM
AMS measurements at low temperature indicate that the bulk susceptibility does not increase in specimens having high bulk susceptibility values at room temperature (sites FCA15, FCA5, Table 5; Fig. 13), confirming that ferro-magnetic phases are the dominant ferro-magnetic carriers. For the other sites, the increase in susceptibility at low tem-perature with respect to room temtem-perature corresponds to a factor between 1.25 and 2.84 (Table 5). Such ratios lower than 3.8 and above 1 may be related to either a partial
contribution of ferromagnetic phases to the susceptibility or to a paramagnetic phase with a paramagnetic Curie tem-perature above 0 K (chlorite and micas can have Tc around 30–35 K). Despite the lower increase in the bulk suscepti-bility at low temperature, the magnetic axes of all measured sites remain rather unchanged in orientation at low and room temperatures (Fig. 13; Table 5) except for FCA8.
The test of AARM in representative sites of the three studied areas (FCA15, PA1, and PRE5) indicates that the contribution of the ferromagnetic fabric shows orientations and position of axes similar to the RT-AMS in the Matute and Panzares sites, although no clear pattern can be defined in PRE5 (Préjano site), where results are strongly scattered at the specimen level (Fig. 13).
Paleomagnetic results
The intensity of the natural remanent magnetization (NRM) is low in Préjano and Panzares areas (between 0.1 and 1 × 10 mA/m) and higher in Matute outcrops (0.5–20 A/m). A strong heterogeneity is observed for both the mag-netic properties and directions of components (between and within sites). Nevertheless, four components have been distinguished in the different sites and specimens consid-ering their unblocking temperature spectrum: low unblock-ing temperature component (named LT) between 150 and 350 °C; intermediate unblocking temperature (IT) between 350 and 580 °C, probably carried by magnetite; and a high-temperature component (HT) with maximum unblocking temperatures higher than 600 °C, probably carried by hem-atite. In addition, a systematic sharp drop observed at tem-peratures below 150 °C is observed (examples in Fig. 14a, b). This component (named G) is probably due to goethite. Figure 14 shows different examples of thermal demagneti-zation of representative samples in which two or three of the described components can be identified.
Tectonic correction was not applied in most sites because bedding is not recognizable within fault rocks, and no consistent directions or polarities were obtained con-sidering the bedding attitude of the footwall units, either (N135E, 30 NE for the Matute sites, 6°–10° to the NW in the Panzares sites and SW-dipping overturned beds in the
Fig. 7 Selected X-ray diffraction patterns of the <2 µm grain size
fraction: a sample FCA1B in the Matute area, b sample PA6 in the Panzares area; c sample CP1H in the Préjano area
Table 2 Organic matter and bitumen maturity in the Préjano area
CP, Préjano; DOM, dispersed organic matter; Ro%, vitrinite reflectance; Rbit%, bitumen reflectance; Req%, reflectance equivalent calculated from
Jacob and Hiltmann’s equation (1985)
Sample Latitude Longitude Lithology Type Ro% St. dev Rbit% St. dev Req% Counts
CP1A N42°10′27.6″ W42°11′9.2″ Sandstone Coal 0.52 0.07 57
CP1C N42°10′27.6″ W42°11′9.2″ Sandstone DOM 0.50 0.04 92
CP1E N42°10′27.6″ W42°11′9.2″ Sandstone Bitumen 0.52 0.11 0.72 130
Préjano site). When component G is calculated, it exhibits reasonably good clustering at the site scale and between different sites (Fig. 15a). The other identified compo-nents show mostly scattered distributions, as for example
component IT in site PA3 (i.e., Fig. 15b), although some remarkable exceptions have been found in sites FCA8, FCA10, PA5, and PA7 (Fig. 15c–f) and will be interpreted in the next section.
Fig. 8 a–c Representative histograms of distribution of organic matter and bitumen reflectance data. d–f Photographs showing the location of
Fig. 9 Corrected anisotropy degree (P′) versus the bulk magnetic susceptibility (Km), and shape parameter (T) versus the bulk magnetic suscep-tibility (Km) for the total measured samples in the three studied sectors
Interpretation and discussion
Both vitrinite reflectance and mixed-layer illite–smectite data are consistent with the shallow depth of the fault sur-face (500–600 m) during the process of thrusting, and the provenance of the fault rocks from the footwall (Cenozoic deposits) of the main thrust. However, clay mineralogy also indicates some contribution from deeper levels that could be exhumed during the process of thrusting, since the ramp of the footwall is more than 10 km long in cross sec-tion and cuts across a sedimentary pile 4–5 km thick (see Figs. 1, 2). The maximum depth to the thrust (600 m, see “Structural features. Kinematic indicators” section and Fig. 2) can be calculated from the top of deposition during the Cenozoic. However, temperatures probably exceed the ones corresponding to the maturity of organic matter dur-ing sedimentation of the Albian sandstones in this area (see reconstruction in Muñoz et al. 1997) according to a normal geothermal gradient (25 °C/km depth). These values are much lower than those obtained within the Cameros basin
during the rifting stage and only comparable with its south-ern margin (Omodeo-Salé et al. 2015). In this sense, fric-tional heating along the thrust surface must be invoked to explain the temperatures obtained. Consistently, in spite of the intensity of deformation, pressure solution is the main deformation mechanism especially in calcareous clasts. Phyllosilicate neo-formation can to some extent explain slaty cleavage in two of the shear zones (Matute and Pré-jano), although XRD is also consistent with re-orientation of inherited grains according to the shear direction.
AMS results indicate that both para- and ferromagnetic minerals are the carriers of AMS. Low-temperature meas-urements of AMS and AARM are consistent with directions obtained at room temperature in two out of the three stud-ied sites, thus suggesting that the ferro- and para-magnetic fabrics are largely coincident, at least considering axes ori-entations. The relationship between directional AMS data and transport direction of thrusts must be interpreted cau-tiously, as pointed out in previous applications of AMS to fault rocks (Solum and van der Pluijm 2009; Pomella 2014;
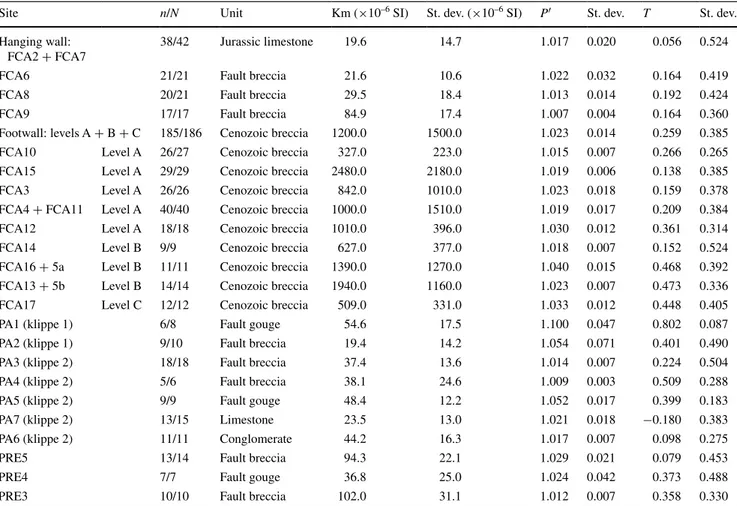
Table 3 Summary of magnetic scalar data
n/N: number of specimens considered/number of specimens analyzed at each site (N–n specimens were not considered due to their very high P′ value); Km: magnitude of the magnetic susceptibility (in 10−6 SI); P′: anisotropy degree; T: shape parameter; e: standard error; FCA, Matute;
PA, Panzares; PRE, Préjano
Site n/N Unit Km (×10–6 SI) St. dev. (×10–6 SI) P′ St. dev. T St. dev.
Hanging wall: FCA2 + FCA7
38/42 Jurassic limestone 19.6 14.7 1.017 0.020 0.056 0.524
FCA6 21/21 Fault breccia 21.6 10.6 1.022 0.032 0.164 0.419
FCA8 20/21 Fault breccia 29.5 18.4 1.013 0.014 0.192 0.424
FCA9 17/17 Fault breccia 84.9 17.4 1.007 0.004 0.164 0.360
Footwall: levels A + B + C 185/186 Cenozoic breccia 1200.0 1500.0 1.023 0.014 0.259 0.385
FCA10 Level A 26/27 Cenozoic breccia 327.0 223.0 1.015 0.007 0.266 0.265
FCA15 Level A 29/29 Cenozoic breccia 2480.0 2180.0 1.019 0.006 0.138 0.385
FCA3 Level A 26/26 Cenozoic breccia 842.0 1010.0 1.023 0.018 0.159 0.378
FCA4 + FCA11 Level A 40/40 Cenozoic breccia 1000.0 1510.0 1.019 0.017 0.209 0.384
FCA12 Level A 18/18 Cenozoic breccia 1010.0 396.0 1.030 0.012 0.361 0.314
FCA14 Level B 9/9 Cenozoic breccia 627.0 377.0 1.018 0.007 0.152 0.524
FCA16 + 5a Level B 11/11 Cenozoic breccia 1390.0 1270.0 1.040 0.015 0.468 0.392
FCA13 + 5b Level B 14/14 Cenozoic breccia 1940.0 1160.0 1.023 0.007 0.473 0.336
FCA17 Level C 12/12 Cenozoic breccia 509.0 331.0 1.033 0.012 0.448 0.405
PA1 (klippe 1) 6/8 Fault gouge 54.6 17.5 1.100 0.047 0.802 0.087
PA2 (klippe 1) 9/10 Fault breccia 19.4 14.2 1.054 0.071 0.401 0.490
PA3 (klippe 2) 18/18 Fault breccia 37.4 13.6 1.014 0.007 0.224 0.504
PA4 (klippe 2) 5/6 Fault breccia 38.1 24.6 1.009 0.003 0.509 0.288
PA5 (klippe 2) 9/9 Fault gouge 48.4 12.2 1.052 0.017 0.399 0.183
PA7 (klippe 2) 13/15 Limestone 23.5 13.0 1.021 0.018 −0.180 0.383
PA6 (klippe 2) 11/11 Conglomerate 44.2 16.3 1.017 0.007 0.098 0.275
PRE5 13/14 Fault breccia 94.3 22.1 1.029 0.021 0.079 0.453
PRE4 7/7 Fault gouge 36.8 25.0 1.024 0.042 0.373 0.488
Fig. 10 Temperature-dependent
magnetic susceptibility (k–T) curves for samples a PA5-1 (Panzares sector), b PRE3-3 (Préjano sector), and c FCA5-2 (Matute sector)
Moreno et al. 2014). In the three sites studied in this work, the magnetic foliation is consistent with the foliation at the outcrop scale (although higher dips for the magnetic folia-tion are generally observed), consistently with thin secfolia-tions showing different sets of C planes in the Panzares area. This difference is probably due to the difficulty of separat-ing S and C planes in outcrop observations, what would bias S populations toward shallower dips.
In the Matute area (FCA sites), the average strike of the magnetic foliation is WNW–ESE, although, as we described in previous sections, in different levels (at dif-ferent distances from the main thrust, Fig. 12a) of the brecciated unit, this strike changes between NE–SW and WNW–ESE, maintaining in all cases a southward dip. If the transport direction is assumed to be perpendicular to the intersection lineation between S and C planes, it shows an average NNW–SSE trend (clear in sites located several meters below the main thrust surface), coinciding
with slickenside striations, and shows variations to NW– SE and NE–SW in sites located closer to the thrust. The Jurassic limestones in the hanging wall show in average similar results, but higher scattering, probably due to the magnetic mineralogy and the low degree of deformation. Accordingly, the trend of the mean of magnetic lineations in the footwall (breccia levels A, B, C) is parallel to the transport direction inferred from these kinematic indicators (Figs. 3, 12a). However, its plunge is higher than the one corresponding to the shear direction, because the magnetic lineation is contained within the foliation plane and, inter-estingly, its projection onto the C or thrust planes measured in the field parallelizes the transport direction (Fig. 16). This poses a different interpretation for magnetic lineation with respect to previous works, where it is considered to be contained within the shear plane (Parés et al. 1999) or else at intermediate orientations between the C and S planes (Aranguren et al. 1996) or at the intersection between both
Fig. 11 a Polar plot for the total of measured samples of the shape parameter (T) versus the corrected anisotropy degree (P′) for the three areas.
Fig. 12 AMS results in the
sites of the Matute sector (a), Panzares sector (b), and Préjano sector (c). Lower hemi-sphere equal area projection
Table 4 Summary of magnetic directional data
kmax, kint, kmin mean (trend/plunge) considering the Jelinek statistic, Conf. angles: confidence angles. Sites are arranged in the table sorted by
sec-tors and by their position in the cross sections. FCA, Matute; PA, Panzares; PRE, Préjano
Site kmax dec/inc Conf. angles kint dec/inc Conf. angles kmin dec/inc Conf. angles
Hanging wall: FCA2 + FCA7 167/46 59/53 261/3 67/53 354/43 67/57
FCA6 045/7 39/21 141/41 37/18 308/48 26/18 FCA8 174/34 46/19 286/28 47/22 045/43 28/16 FCA9 275/32 41/22 168/24 41/18 048/48 28/14 Footwall: levels A + B + C 141/51 48/18 267/25 48/25 011/27 25/18 FCA10 Level A 187/68 57/20 087/4 60/38 355/21 49/14 FCA15 Level A 159/50 21/17 275/20 21/16 019/33 17/16 FCA3 Level A 160/52 37/19 288/26 36/26 031/26 27/20
FCA4 + FCA11 Level A 116/33 39/24 258/51 40/33 013/18 36/26
FCA12 Level A 135/49 15/8 264/28 14/8 010/26 12/7
FCA14 Level B 153/45 21/12 277/29 21/13 026/31 14/12
FCA16 + FCA5a Level B 116/36 29/11 242/39 29/14 001/30 14/11
FCA13 + FCA5b Level B 143/61 35/12 264/16 35/15 001/23 16/12
FCA17 Level C 145/56 17/12 272/22 30/17 012/24 30/10 PA1 (klippe 1) 092/0 32/10 182/43 32/10 001/46 11/8 PA2 (klippe 1) 180/26 33/14 272/4 32/14 010/64 19/18 PA3 (klippe 2) 180/24 45/21 082/18 45/25 318/59 29/19 PA4 (klippe 2) 032/19 42/11 139/41 41/10 284/43 15/12 PA5 (klippe 2) 189/47 10/6 074/22 13/9 327/35 13/7 PA7 (klippe 2) 054/31 30/23 317/12 67/24 209/56 67/16 PA6 (klippe 2) 091/12 37/14 188/30 39/25 341/57 30/15 PRE5 158/4 45/30 321/85 48/23 068/11 36/29 PRE4 153/40 30/7 344/49 32/20 246/5 25/2 PRE3 280/7 31/12 189/13 30/23 039/74 23/14
Table 5 Summary of magnetic directional and scalar data for sites analyzed at room (palin text) and low temperatures (italic)
n number of analyzed samples, kmax, kint, kmin mean (trend/plunge) considering the Jelinek statistic, Conf. angles confidence angles, Km
magni-tude of the magnetic susceptibility (in 10−6 SI), Km-LT/Km-RT ratio of magnetic susceptibility at low temperature and at room temperature, P′
anisotropy degree, T shape parameter. FCA, Matute; PA, Panzares; PRE, Préjano
Site n kmax dec/inc Conf. ang. kint dec/inc Conf. ang. kmin dec/inc Conf. ang. Km 10−6 SI Km-LT/Km-RT Pj T
FCA8-RT 8 159/18 23/6 267/42 24/8 052/42 15/8 33.2 1.25 1.017 0.260 FCA8-LT 8 244/34 46/14 026/49 46/21 140/20 24/13 41.6 1.008 −0.166 FCA9-RT 6 258/34 24/21 159/13 25/11 052/52 23/12 95.9 1.62 1.007 0.192 FCA9-LT 6 297/20 36/9 192/34 35/26 052/49 27/11 156.0 1.012 0.414 FCA15-RT 6 163/62 38/18 283/15 38/13 020/23 20/13 1540.0 0.96 1.018 0.276 FCA15-LT 6 140/55 26/12 279/28 23/13 019/19 26/17 1480.0 1.019 0.124 FCA5-RT 4 2390.0 0.92 1.024 0.099 FCA5-LT 4 2190.0 1.026 0.313 PA3-RT 6 168/17 82/11 077/06 82/7 327/72 12/4 39.2 1.42 1.014 0.477 PA3-LT 6 128/21 54/5 220/05 54/6 322/68 14/4 55.8 1.014 0.109 PA5-RT 6 192/45 11/8 071/27 14/9 322/32 10/10 49.4 1.52 1.049 0.340 PA5-LT 6 187/49 12/6 065/25 14/9 319/30 13/9 74.9 1.042 0.482 PRE5-RT 4 89.5 2.84 1.034 0.126 PRE5-LT 4 254.0 1.031 0.353
sets (Solum and van der Pluijm 2009). Probably, the shal-low depths and the particular conditions of deformation in the Cameros–Demanda thrust are responsible for the non-migration of the magnetic lineation from the S to the C planes in the shear band. In this sense, the possibility of calculating the shear direction by means of AMS even in sites where orientations of foliation planes are not evident,
or cannot be reliably measured, widens its field of applica-tion as a kinematic indicator.
In the Panzares area (PA sites), magnetic foliation shows shallower dips and stronger scattering, in accordance with foliation (S) and shear (C) plane attitudes measured in the outcrops. However, individual sites show good clusters of
kmin, and the reason for variations between sites is their
Fig. 13 Lower hemisphere equal area projection of AARM results
(white symbols), AMS results at room temperature (black symbols), and AMS results at low temperature (gray symbols). Diagrams of
magnetic susceptibility at room temperature (Km-RT) versus mag-netic susceptibility at low temperature (Km-LT)
Fig. 14 Orthogonal, thermal
demagnetization diagrams showing the orientation of the remanent magnetization at heating steps. Black (white) represents horizontal (verti-cal) projection of the vector. Components distinguished considering the unblocking temperature spectrum: G, unblocking temperature below 150 °C; LT, 150°–350 °C; IT, 350°–580 °C; HT, maximum unblocking temperatures higher than 600 °C. The decay of the NRM is also represented. FCA, Matute; PA, Panzares
Fig. 15 Lower hemisphere
equal area projection of the characteristic components cal-culated for different sites. Black (white) represents lower (upper) hemisphere. a Characteristic component G (unblocking temperature below 150 °C) for different sites. b Characteristic component IT (unblocking temperature between 350 and 580 °C) for PA3. c Characteris-tic component LT (unblocking temperature between 150 and 350 °C) for FCA10. d Charac-teristic component IT for PA7. e Characteristic component IT for PA5. f Characteristic component IT for FCA8. g Characteris-tic components IT or LT for different sites. h Theoretical model for the deflection of a paleomagnetic vector originally oriented according to the Ceno-zoic magnetic field after apply-ing simple shear deformation according to the transport direc-tion of the Cameros thrust in the Panzares and Matute areas. The fields of compatibility for the initially normal and reverse field directions are shown. See text for further explanation
location in the different klippen, as confirmed by changes in the orientation of cleavage between sites. A dominant E–W strike and a slight deviation toward the NNW of its poles (Fig. 16) can be defined. Lineations are scattered within the foliation planes, showing, in individual sites, a trend (1) perpendicular to the slickenside striations (locally paral-lel to the intersection lineation between C1 and C2 planes, PA1, PA4, PA6, PA7), (2) parallel to the transport direction (considering this as the perpendicular to the average C1/C2 intersection, PA5), or (3) both orientations (PA2, PA3). The different generations of C planes observed in thin sections can also account for deflecting magnetic lineation orienta-tion toward the intersecorienta-tion lineaorienta-tion (see Debacker et al. 2009; Haerinck et al. 2015) versus the elongation or trans-port direction within the shear zone. No lithological control seems to exist on this difference because both features are found in argillaceous fault gouge and fault breccia.
In the Préjano area, magnetic foliation shows an aver-age NW–SE strike (parallel to the main thrust) and variable dips to the south, from horizontal to vertical. It is parallel to foliation planes (subvertical, see Fig. 5c), the shear planes, or intermediate between them. The magnetic lineation is scattered within a girdle parallel to the main thrust, with a maximum parallel to its strike.
In summary, the results concerning AMS in the Cam-eros–Demanda thrust indicate that magnetic lineation can neatly define the transport direction of thrusts (Matute area) or can be scattered approaching the intersection line-ation between shear and foliline-ation planes (Préjano area). At an intermediate situation, in the Panzares area, the magnetic lineation shows moderate dispersion and two main populations (parallel and perpendicular to the trans-port direction). Ambiguities in the interpretation increase when the number of data (i.e., PA sites) does not allow to produce robust clusters, although the intensity of shear deformation (see interpretation of paleomagnetic data below) and lithology probably are controlling factors. In our case, the increase in the ferromagnetic contribution (higher in the Matute sites with respect to the other two) to susceptibility improves the meaning of magnetic line-ation as an indicator of the transport direction (an inter-pretation that can also be derived from Oliva-Urcia et al. 2009). Magnetic foliation is usually better clustered than lineation but does not allow to directly infer the transport direction unless the S/C intersection lineation is extrapo-lated to magnetic data (i.e., this intersection lineation can-not be considered horizontal by default). Acan-nother interest-ing point is that the shallow P–T conditions in the studied cases (consistent with the occurrence of these structures in modern units within the filling of the Rioja Trough, Muñoz-Jiménez and Casas-Sainz 1997) for the develop-ment of magnetic fabrics indicate that deep diagenesis or
wholesale fluid circulation is not necessary to modify the magnetic fabric, provided that deformation is strong and that microbreccia or fault gouges are formed.
An interesting question that arises at this point is the time span during which deformation, and thus magnetic fabrics, developed, and consequently the representativity of AMS data with respect to the whole movement history of the thrust. It must be said that the same question applies to struc-tural data, especially structures developed along surfaces (i.e., slickenside striations) and non-penetrative at the scale of volumes of rocks. Kinematic indicators (here including AMS) may have different temporal meaning according to the provenance of fault rocks (Fig. 17) and the occurrence of syn-tectonic sedimentation in the footwall of the thrust: 1. When fault rocks are derived from the hanging wall of
the thrust, in most cases the recorded deformation aver-ages all the displacement directions during the thrust movement, especially if deformation is homogeneous. Even in the case of heterogeneous deformation, if it var-ies gradually within the shear zone (from top to bottom or vice versa), it will presumably record, with different intensity, this average transport direction.
2. A different scenario appears when heterogeneous defor-mation and strain partitioning occurs within the shear zone. In this case, the different segments active during different intervals will record different transport direc-tions, whose vectorial sum should equal the average transport direction.
3. When fault rocks are derived from the footwall of the main thrust but only involve the pre-tectonic sedimen-tary sequence, the spatial–chronological relationships within the fault zone are similar, although the geometry of the shear zone can vary depending on the rheology of the sedimentary pile in the case of upward-decreasing shortening (hanging-wall anticline, see Fig. 17). The Préjano area could be assimilated to this case because the erosion level is below the syn-tectonic sediments exposed in the Arnedo anticline. In this case, the fault rocks would be recording an averaged transport direc-tion for the thrust.
Geometry and deformation record in the shear band change dramatically when deformation is measured in the syn-tectonic sediments occurring in the footwall. We have considered here two possible geometries with two different kinematics each:
Fig. 16 Synthetic stereographic projection and conceptual sketch
showing the orientation of the kinematic indicators observed in the outcrops for the three studied areas. The orientation of the axes of the magnetic ellipsoid is also shown. See text for further explanation