ScienceDirect
Energy Procedia 00 (2016) 000–000
www.elsevier.com/locate/procedia
1876-6102 © 2016 The Authors. Published by Elsevier Ltd.
Peer-review under responsibility of Riga Technical University, Institute of Energy Systems and Environment.
International Scientific Conference “Environmental and Climate Technologies – CONECT 2016”
Optimal Arrangement of Photovoltaic Panels
Coupled with Electrochemical Storages
Antonio Carbonari
a*, Massimiliano Scarpa
a aUniversità IUAV di Venezia, Dorsoduro 2206, Venice – 30123, Italy
Abstract
The ideal orientation of PV panels is a widely debated topic. However, the relevant decrease in photovoltaic (PV) system costs and their consequent rapid spread are moving the attention from the achievement of the maximum areal electricity generation to a PV generation profile in agreement with building energy needs. In fact, national subsidies are going to promote electricity self-consumption in PV systems, in order to avoid imbalances in the grid, already relevant at the present market status, i.e. with a still low share of PV in national yearly electricity generation. For all of these reasons, in the next years PV systems will not be designed just to generate the amount of electricity as high as possible, but even to limit electricity exportation from the building perspective. Thus, orientations and PV configurations with lower electricity generation might be preferred, if they allow the user to achieve a higher degree of electricity self-consumption. Of course, in the achievement of this aim, the PV systems will be supported by electrochemical storages as well. This paper shows the analysis of various configurations of PV systems supported by electrochemical storages, aiming at the increase of electricity self-consumption, considering two Italian climates: Venice, in the northeast (Latitude: 45° 26’ N), and Trapani, in southern Italy (Latitude: 38° 01’ N). As regards the detailed simulation of the PV system, the analysis took advantage of program Ener_Lux, whereas the building energy system was simulated via EnergyPlus.
© 2016 The Authors. Published by Elsevier Ltd.
Peer-review under responsibility of Riga Technical University, Institute of Energy Systems and Environment.
Keywords: Photovoltaics; Zero Energy Buildings; Electrochemical storage;
1. Introduction
For each site and climate, the ideal combination of photovoltaic (PV) panels’ azimuth and tilt angles can be defined, so that the power generation throughout the year is maximized. However, in many contemporary projects of
*
Corresponding author: Antonio Carbonari Tel.: +39-0412571303; fax: +39-0415223627. E-mail address: [email protected]
sustainable buildings [1, 2] the surface occupied by the photovoltaic cells is composed of subsurfaces with different orientations and slopes.
In the case of re-use of existing buildings, the reason for this choice generally consists in the need for the exploitation of all the available roof surface, whereas new buildings may host PV panels in different azimuth and tilt angles in order to generate electricity with continuity during the day, by taking advantage of surfaces facing the sun in different periods of the day, thus with greater match with the demand time profile. In the latter case, the final purpose would consist in the maximization of the building’s autarchy degree, even if at the cost of larger PV panel surface and hence of higher installation costs.
The question that arises is the following one: at what extent all of these different solutions are less convenient when compared with a system in which all the PV cells are disposed in accordance with the “ideal” arrangement? This work tries to answer this question by comparing different configurations of the PV system by means of computer simulations. At first, the ideal PV panels arrangement was defined for two Italian sites: Venice, in the northeast (Latitude: 45° 26’ N, 2345 Heating Degree Days), and Trapani, in southern Italy (Latitude: 38° 01’ N, 810 Heating Degree Days). The consequent PV generation was compared with the ones characterizing other configurations, derived from actual projects. Then a case study was considered, consisting in a residential building typical of the Italian suburbs. Two possible orientations of the building’s main axis and the consequent possible PV panels arrangements were considered and compared from different points of view: electricity generation and life cycle assessment (LCA), with special reference to primary energy.
This study is performed by referring to weather data of monthly average days in Venice and Trapani. The intensity of the solar radiation impinging on the panels and the consequent electricity generation were calculated by software Ener_Lux [3], whereas the energy needs from the building plant system were simulated by software Energy
Plus [4].
2. PV panels optimal arrangement
As a first step, a series of possible PV panels arrangement options was compared to identify the optimal one. The considered PV panels are in monocrystalline silicon with reference efficiency equal to 18%. Simulations results are resumed in Fig. 1, showing the annual specific electricity generation [kWh/(m2∙year)] of a panel array facing south with different slopes, compared with the ones from a PV panel array with the same total surface split into two orientations, such as: South-East and South-West (SE+SW) and East and West (E+W), with various slopes.
Fig. 1. Annual specific electricity generation [kWh/(m2∙year)] of PV panels array as a function of orientation and slope, in Venice (VE) and Trapani (TP).
Figure 1 shows that in both the climates the optimal slope for a PV panel facing South is thirty degrees (30°), but the overall curve profile is almost flat for slope values between 20° and 40°. In correspondence with the slope of 30°, the yearly electric generation is around 14% higher than with the horizontal arrangement (13.7% in Venice,
14.5% in Trapani), whereas it is over 50% higher when compared with the vertical arrangement (53% in Venice, 63% in Trapani).
For these reasons, in the next evaluations, the south orientation and the optimal slope of 30° were taken as the reference arrangement in both the climates. Moreover, it is interesting to point out that the inclination of 30° is the typical slope of the most of the pitched roofs in Italy.
Also in the case of PV panels array split into orientations SE+SW, the maximum value in annual electricity generation takes place at a tilt equal to 30° in both the climates, and with 10% advantage over the horizontal arrangement. For higher tilt values the annual electric generation decreases, and in the vertical arrangement, it is around 50% lower than the maximum in both the sites (48.4% in Venice, 52.5% in Trapani).
On the other hand, there is no optimal slope for the array split into orientations E+W. Starting from the horizontal arrangement, the yearly electric generation decreases as the slope increases, down to a minimum around 60% lower in correspondence with the vertical arrangement (and 82-86% lower than in the reference arrangement) in both the sites. In the case of a slope equal to 30°, the electricity generation would be reduced by about 19% when compared with the reference case (South, 30°).
Moreover, in both the sites, the following characteristics of the PV electricity generation daily profile were identified along the year (see Fig. 2).
Figure 2: Daily specific PV electricity generation [W/m2] of a PV panels array as a function of its orientation and slope,(a) in a typical winter day (January, 21st) and (b) in a typical summer day (July, 21st) in Venice.
In the winter period, the daily PV electricity generation for the south orientation is maximum in correspondence with a slope around 60° in both the climates (Fig. 2/a), but it is close to the value achieved by the reference arrangement. In winter, the array split into the orientations SE+SW achieves similar PV electricity generation at slopes between 30° and 50°.
In summer, for the south orientation, the PV electricity generation achieves the maximum value at slopes of about 10° in Trapani and 13° in Venice, with no relevant difference among the arrangements with slopes lower than 30° (Fig. 2/b). Over this slope value, for any orientation, the yield decreases down to a minimum value at the vertical arrangement, because of the reduced generation in the mid of the day.
During the cooling period (from April to October), the daily PV electricity generation of the array split into orientations E+W decreases as the slope increases (particularly over 40°), but its profile becomes flat along the day, so probably closer to the hypothetical profile of the energy demand. In particular, slope values around 50° provide relevant electricity generation in the morning and evening without reducing significantly the PV electricity generation in the middle of the day. At tilt equal to 50°, the daily generation (in July) is reduced by only 14% compared with the reference orientation, whereas the yearly yield is reduced by 30%.
3. The case-study
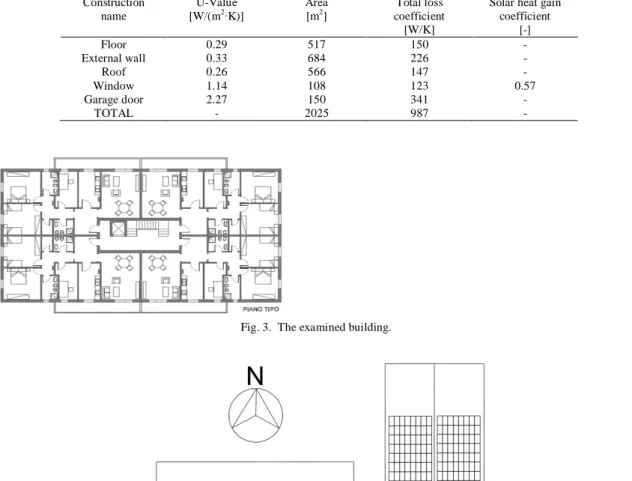
The apartment building considered as a case study in the simulations is typical in Italian suburbs (Fig. 3). It consists in a three-floor apartment building: the ground floor is committed to garages and warehouses, whereas the two upper floors host apartments (in total, 8 apartments). The building’s structure is composed by reinforced concrete, the walls are in hollow bricks, with external insulation. The covered area is 517 m2, the heated volume is 2715 m3 and the envelope U-values are summarized in Table 1. Its roof is composed of two slopes at 30°. This kind of building is usually placed with any orientation of its main axis. Typical occupation heat gains and infiltration air flow rates were considered in the simulations.
Table 1. Summary of the main characteristics and dimensions of the building constructions of the simulated building. Construction
name
U-Value
[W/(m2∙K)] Area [m2] coefficient Total loss
[W/K]
Solar heat gain coefficient [-] Floor 0.29 517 150 - External wall 0.33 684 226 - Roof 0.26 566 147 - Window 1.14 108 123 0.57 Garage door 2.27 150 341 - TOTAL - 2025 987 -
Fig. 3. The examined building.
Fig. 4. The two considered orientations and possible arrangements of the PV panels on the roof.
The building’s electricity demand for electric appliances and lighting, as well as for the HVAC system, has been quantified by means of dynamic energy simulations using software Energy Plus.
Two reference situations have been compared: building’s major axis aligned along the East-West direction (E-W) and building’s major axis aligned along direction North-South (N-S). It was assumed that the PV panels can be placed on all roof slopes excluding the one facing North, and occupying at most the 70% of the available area, as shown in Fig. 4.
The same panels area for both the orientations was assumed (that is 180 m²), consequently, in Venice, the annual electric generation is 15.82% higher with the E-W orientation, as well as the specific generation (150.49 kWh∙m
-2
∙year-1, instead of 126.68 kWh∙m-2∙year-1), whereas in Trapani the advantage of the E-W orientation is 16.36% (191.97 kWh∙m-2∙year-1 versus 150.56 kWh∙m-2∙year-1).
From these results a brief life cycle assessment can be performed, assuming the embodied energy of the PV system (including PV panels, supports and inverters) equal to 1025.5 kWh/m2. Conservatively, the highest value indicated by IEA [5] and University of Michigan [6] was assumed. The consequent primary energy pay back times are the following ones: in Venice, 8.1 years for orientation N-S and 6.82 years for orientation E-W; in Trapani, 6.39 years for orientation N-S and 5.34 years for orientation E-W.
In absence of electric storage, the coverage allowed by self-consumption in case of building’s electricity demand for electric appliances and lighting (e.u.) and building’s total electricity demand including HVAC (a.e.u.) are resumed in Fig. 6 and Table 2.
Fig. 5. (a) Amount of instantaneous self-consumption for electric appliances and lighting versus building’s electric balance [GWh/year], (b) the same comparison including self-consumption for HVAC.
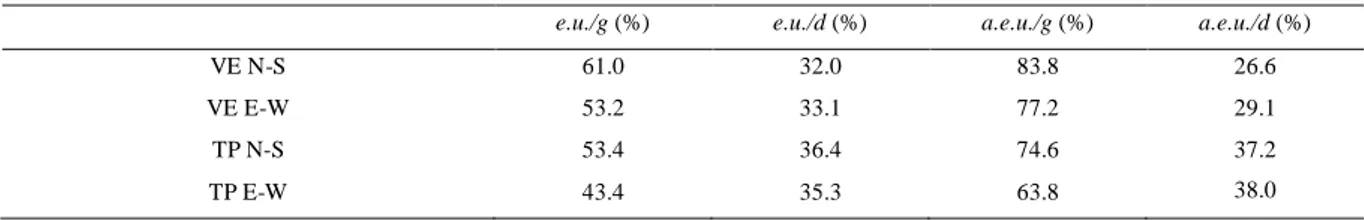
Table 2. Self-consumption for electric uses as electric appliances and lighting (e.u.), and for all electric uses including HVAC (a.e.u), as a percentage of generation (e.g.: e.u./g) and as a percentage of the demand (e.g.: e.u /d).
e.u./g (%) e.u./d (%) a.e.u./g (%) a.e.u./d (%)
VE N-S 61.0 32.0 83.8 26.6
VE E-W 53.2 33.1 77.2 29.1
TP N-S 53.4 36.4 74.6 37.2
TP E-W 43.4 35.3 63.8 38.0
To quantify the PV panels area to be installed, the following criteria is frequently adopted: this area should be large enough to obtain the coverage of the overall yearly building’s energy consumption. But in this case-study this is a criterion difficult to apply in Venice. When considering the electricity demand for electric appliances and lighting, with the N-S orientation this purpose could be reached covering 96% of the available roof area (242 m2 on 252.2 m2). To cover the electricity demand for HVAC too, 158.5 % of the available roof area would be necessary.
With the orientation E-W of the building main axis, because of the higher specific generation, an area 15.92% lower (203.5 m2) would be necessary, but still not available on the south slope of the roof (126.1 m2). To cover also the electricity demand for HVAC, 266.2% of the available area would be necessary.
In Trapani, it is easier to satisfy this criterion. Considering the electricity demand for electric appliances and lighting, the surface request is 185.84 m2, that is 73.5% of the available area on both the slopes, with the N-S orientation, and 155.17 m2 (123% of the available area) on the south slope, with the other orientation. Here, with the N-S orientation, it is possible to satisfy the above-mentioned criterion for total electricity demand including HVAC by using entirely the available area on both the slopes. Furthermore, in both the locations, the available surface area of the roof would not be enough if we decide to weigh the energy exported less than imported.
As mentioned above, the difference in annual specific electric generation between the two orientations is lower than 10% in favor of the E-W orientation. However, by analyzing the behavior of the system along the year, it is
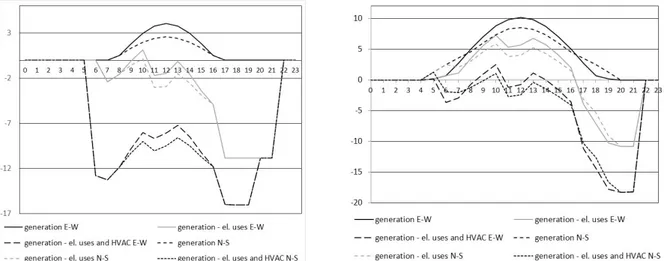
possible to make a few remarks regarding the time profiles of the electricity generation and that of “residual demand” on typical days, with reference to the chosen orientations (E-W and N-S). The residual demand is here defined as the electric demand decreased by the instantaneous self-consumption of PV generated electricity. In particular: “generation - el. uses E-W” is the residual demand for electric appliances and lighting related to the E-W orientation, “generation - el. uses and HVAC E-W” is the residual demand for electric appliances, lighting and HVAC related to the same orientation, and so on. Without a storage system, when the values of these quantities are positive they represent electricity exported to the national electricity grid, otherwise they represent imported electricity.
The following notes are possible:
During the winter, the daily generation with N-S orientation is always lower than with orientation E-W (Fig. 6/a), During the summer, the daily generation with N-S orientation is almost equal to orientation E-W, but the hourly generation is larger in the morning and evening (Fig. 6/b). This way it is closer to the time profile of electric demand and reduces the amount of imported electricity.
Fig. 6. Venice, comparison between two PV plants with the same area but with different orientation of building main axis: north-south (N-S) and east-west (E-W). Time profile of PV generation and residual demand [kW] (a) in a typical winter day (January, 21st), and (b) in a typical
summer day (July, 21st).
As a consequence, the instantaneous self-consumptions of E-W orientation is higher in the heating period and lower in the cooling period. Thus, orientation N-S achieves yearly self-consumption for electric uses by only 3.4% lower (for electric uses and HVAC 4% lower), despite of the yearly electricity yield lower by 15.82% (export 29.9% - 40.3% lower and import only 1.7% - 3.5% higher).
4. Possible role of an electric storage
In all the previous considerations, the complete exchange of electricity between the building and the national electric grid was considered, thus assuming no electric storage system was available in the building. In this situation, as shown before in Table 2, the electricity self-consumed by the building for electric appliances and lighting is always less than 54% of the generated electricity, whereas, when the consumption for the electric HVAC is included, this fraction can raise up to the 83.8% in Venice.
In Italy, the tariff policy of the national electricity grid manager encourages the self-consumption of the PV electricity, in order to prevent problems in network balancing, related to the discontinuity and unpredictability of all renewable energy sources. For this reason, it is interesting to explore the influence implied by an electric storage system supporting the PV system. In this analysis, a storage system consisting of a lithium-ion battery park is considered.
It is assumed that the embodied energy of this kind of battery is 1500 kWh for each kWh of nominal energy storage available [7, 8]. The following procedure was used to size the storage system: the battery nominal capacity
was progressively increased up to the value beyond which further capacity increases did not involve significant reductions in the amount of electricity imported from the national electricity grid. It was found that for this capacity the embodied energy in the storage system was fairly small when compared with the primary energy related to the avoided imports (from 1/4 to 1/5).
The following figure 7 shows, as an example, the coverage of the monthly energy demand for appliances and lighting as well as exported electricity in presence ofthe storage system. The figure refers to orientation E-W in Venice. The positive values show the uses of the generated electricity, whereas the negative ones refer to imported electricity. Figure 8 shows the yearly values of the same quantities in the different sites and orientations.
Fig. 7. Venice E-W orientation, uses of generated electricity and imports during the year [kWh/month], without storage (a) and with storage (b).
Fig. 8. Yearly uses of generated electricity (sum of positive values) and imports (negative values) [GWh/year] without storage (left) and with storage (right) in the different cases.
Table 3 summarizes the main data about electricity self-consumption. It is possible to remark that the use of storage system allows to increase significantly (in some cases to double) the degree of self-consumption of the building, therefore its self-sufficiency. The storage primary energy ratio (SR) may be defined as the ratio of the primary energy corresponding to stored energy to the embodied energy of storage system (kWh/kWh).
Table 3. In the first four columns: self-consumption for electric uses as electric appliances and lighting as a percentage of the annual demand without storage (e.u.) and with storage (e.u. st.), of storage (cap.st.) and storage ratio (SR). In the following four columns: the same quantities but
inclusive of self-consumption for HVAC (a.e.u.) e.u. (%) e.u. st. (%) cap. st (kWh) SR (-) a.e.u. (%) a.e.u. st. (%) cap. st (kWh) SR (-) VE N-S 32.0 49.3 35.2 3.0 26.6 31.0 30.0 1.5 VE E-W 33.1 57.9 41.0 3.7 29.2 36.4 34.7 2.1
TP N-S 36.4 63.3 41.6 3.9 37.2 47.9 41.6 2.1
TP E-W 35.3 74.5 44.5 5.2 38.0 56.4 44.5 3.3
Considering energy demand for HVAC too, the instantaneous self-consumption ratio decreases in Venice and increases in Trapani, whereas the total self-consumption (comprehensive of used storage) decrease in all the cases but more sensibly in Venice because of the higher energy demand for HVAC; in both the sites the storage capacity is about the same as in the previous case.
5. Conclusion
In general, buildings having greater surface exposed according to the ideal arrangement will provide the higher yearly electricity yield, thus, in the case-study, orientation E-W of the building’s main axis is slightly more convenient than the N-S orientation in terms of annual electric generation and consequent payback time of the plant. However, the latter orientation may show advantages in terms of a better adherence of the time profile of electricity generation to the demand.
An electric storage system can contribute significantly to improve the independence of the plant from the external network. To improve the evaluation of the real energy payback of the system, it would be necessary to evaluate even the avoided exports. Because of their operating expenses, the latter should be associated to lower primary energy counterpart.
References
[1] Project Profiles Solar Decathlon Europe 2014. Solar Decathlon Europe 2014. Available: http://www.solardecathlon2014.fr/ftp/docs/ SDE 2014_Projects_Profiles.pdf.
[2] AAVV, (2013). Il Muse di Renzo Piano. Abitare [OnLine Magazine], Available: http://www.abitare.it/it/architettura/2013/07/26/il-muse-di-renzo-piano/?refresh_ce-cp.
[3] Carbonari, A., (2012). Thermal and Luminous Comfort in Classrooms: A computer method to evaluate different solar control devices and its operating logics. Proceedings of PLEA 2012 - The 28rd Conference, Opportunities, Limits & Needs Towards an environmentally responsible architecture, Lima, Perù, 7-9 November 2012.
[4] Crawley, D.B., K.L. Lawrie, F.C. Winkelmann, C.O. Pedersen, (2001). EnergyPlus: new capabilities in a whole-building energy simulation program, 7th International IBPSA Conference,
[5] Fthenakis, V., H.C. Kim, R. Frischknecht, M. Raugei, P.Sinha, and M. Stucki, (2011). Life cycle inventories and life cycle assessment of photovoltaic systems. Int. Energy Agency, p. 63.
[6] Pacca, S., D. Sivaraman, and G. a Keoleian, (2006). Life Cycle Assessment of the 33 kW Photovoltaic System on the Dana Building at the University of Michigan: Thin Film Laminates, Multi-crystalline Modules, and Balance of System Components. Rep. No. CSS05-09. Center for Sustainable Systems – University of Michigan.
[7] Majeau-Bettez, G., T.R. Hawkins, and A.H. Strømman, (2011). Life cycle environmental assessment of lithium-ion and nickel metal hydride batteries for plug-in hybrid and battery electric vehicles. Environmental Science & Technology, vol. 45(10), pp. 4548–54.
[8] Ager Wick Ellingsen, L., G. Majeau-Bettez, B. Singh, A. Kumar Srivastava, L.O. Valøen, and A.H. Strømman, (2014). Life Cycle Assessment of a Lithium-Ion Battery Vehicle Pack. Journal of Industrial Ecology. vol. 18 (1), pp. 113-124.
![Fig. 1. Annual specific electricity generation [kWh/(m 2 ∙year)] of PV panels array as a function of orientation and slope, in Venice (VE) and Trapani (TP)](https://thumb-eu.123doks.com/thumbv2/123dokorg/5492007.62902/2.799.251.564.658.882/annual-specific-electricity-generation-function-orientation-venice-trapani.webp)
![Figure 2: Daily specific PV electricity generation [W/m 2 ] of a PV panels array as a function of its orientation and slope,(a) in a typical winter day (January, 21st) and (b) in a typical summer day (July, 21st) in Venice](https://thumb-eu.123doks.com/thumbv2/123dokorg/5492007.62902/3.799.54.737.409.648/figure-specific-electricity-generation-function-orientation-january-typical.webp)
![Fig. 8. Yearly uses of generated electricity (sum of positive values) and imports (negative values) [GWh/year] without storage (left) and with storage (right) in the different cases.](https://thumb-eu.123doks.com/thumbv2/123dokorg/5492007.62902/7.799.51.737.522.716/yearly-generated-electricity-positive-imports-negative-storage-different.webp)
