nanomaterials
ISSN 2079-4991 www.mdpi.com/journal/nanomaterials Article
Synthesis, Characterization and Gas Sensing Properties of
Ag@α-Fe
2O
3Core–Shell Nanocomposites
Ali Mirzaei 1, Kamal Janghorban 1, Babak Hashemi 1, Anna Bonavita 2, Maryam Bonyani 1,2,
Salvatore Gianluca Leonardi 2 and Giovanni Neri 2,*
1 Department of Materials Science and Engineering, Shiraz University, 71946-85115 Shiraz, Iran;
E-Mails: [email protected] (A.M.); [email protected] (K.J.); [email protected] (B.H.); [email protected] (M.B.)
2 Department of Electronic Engineering, Chemistry and Industrial Engineering,
University of Messina, C.da di Dio, 98166 Messina, Italy; E-Mails: [email protected] (A.B.); [email protected] (S.G.L.)
* Author to whom correspondence should be addressed; E-Mail: [email protected]; Tel.: +39-90-397-7297; Fax: +39-90-397-7464.
Academic Editor: Thomas Nann
Received: 25 March 2015 / Accepted: 29 April 2015 / Published: 5 May 2015
Abstract: Ag@α-Fe2O3 nanocomposite having a core–shell structure was synthesized by a
two-step reduction-sol gel approach, including Ag nanoparticles synthesis by sodium borohydride as the reducing agent in a first step and the subsequent mixing with a Fe+3 sol
for α-Fe2O3 coating. The synthesized Ag@α-Fe2O3 nanocomposite has been characterized
by various techniques, such as SEM, TEM and UV-Vis spectroscopy. The electrical and gas sensing properties of the synthesized composite towards low concentrations of ethanol have been evaluated. The Ag@α-Fe2O3 nanocomposite showed better sensing
characteristics than the pure α-Fe2O3. The peculiar hierarchical nano-architecture and the
chemical and electronic sensitization effect of Ag nanoparticles in Ag@α-Fe2O3 sensors
were postulated to play a key role in modulating gas-sensing properties in comparison to pristine α-Fe2O3 sensors.
1. Introduction
Due to peculiar properties originated from their individual phases, composite materials are of special interest. Among different structures of composites, recently a lot of interest in core–shell nanocomposites, in which a core is coated with a shell, has arisen due to their unique advantages, such as stability, high catalytic activity, controllable compositions/structure, etc. and potential applications in fields such as catalysis, optics, biotechnology and gas sensors [1]. For gas sensing application, metal oxide@metal oxide core–shells have attracted great interest because of the different combination of n-type and p-type metal oxides such as n-n, n-p or p-p can leads to synergetic effects that enhance gas sensing properties. However, recent investigations about metal@metal oxide core–shell as gas sensor have suggested that combination of metal (core) and metal oxide (shell) structure can enhance the sensitivity of gas sensor [2,3]. For example Zhu et al. [4] reported an ethanol gas sensor using Ag@TiO2 that showed higher sensing properties in comparison with pure TiO2. In fact from practical
point of view when metal is as a core it not affected by surrounding medium and consequently corrosion or dissolution metal will not occur. Furthermore, because metal is as a core, it will not decrease effective surface area of metal oxide for sensing application. Accordingly, core–shells with metal core and semiconductor shell become increasingly among the strongest candidates as sensor due to their controllable chemical and colloidal stability within the shell and charge transfer between the metal core and semiconductor [5,6].
Among the different combinations of metal@metal oxide core–shell composites, Ag@Fe2O3 is very
interesting: α-Fe2O3 (hematite) is not only one of the cheapest semiconductor materials (n-type,
Eg = 2.1 eV) available, but also is one of the most environmental friendly semiconductors. Thanks to
its low cost, high resistance to corrosion, and nontoxicity properties, this most stable iron oxide has been traditionally used as catalysts, pigments, electrode materials and gas sensor [7–9]. Regarding gas sensor applications, there are many reports about α-Fe2O3 nanostructures [10,11] and many researchers
have tried to enhance gas sensing properties of iron oxide using different strategies such as doping with metals [12], composite with another metal oxide [13] and synthesis of different morphologies [11]. Ag as a core is the cheapest available noble metal and displays excellent thermal conductivity properties, and its electrical conductivity is the best amongst other excellent candidate metals like Cu, Al and Au [14].
Regarding the methods for producing metal@metal oxide core–shell nanoparticles, so far several methods such as precipitation [2,3] and hydrothermal [6], etc. have been developed. However, two step reduction-sol gel method is one of the simplest and cheapest procedures for the synthesis of metal@metal oxide core–shell nanocomposites.
To the best of our knowledge, there is no published report about Ag@α-Fe2O3 core–shell
nanocomposites for gas sensing applications. So, aim of the present study is the simple chemical synthesis of Ag@α-Fe2O3 nanoparticles and investigation of gas sensing properties towards ethanol.
Ethanol gas sensors can be applied in many fields, such as the control of fermentation processes, safety testing of food packaging, and can also to monitor drunken driving [15]. A comparative gas sensing study between the Ag@α-Fe2O3 core–shell and α-Fe2O3 nanoparticles was then here performed to
2. Results and Discussion
2.1. SEM and TEM Investigations
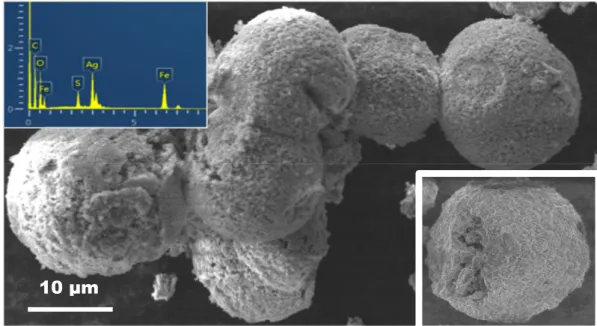
Figure 1 shows a panoramic view of the morphology of Ag@α-Fe2O3 composite sample annealed at
600 °C. Large spherical particle agglomerates, having an average size of about 50 μm, have been observed. The inset in Figure 1 reports one such agglomerate, on which is well visible the void inside the structure. Energy-dispersive X-ray spectrum (EDX) confirms that the nanocomposite contains Ag, Fe and O as the main elements. Sulfur, coming from the raw material used as precursors, is also evidenced. The presence of Cu and C in the spectrum is due to the grid used for the scanning electron microscopy (SEM) observation.
Figure 1. Scanning electron microscopy (SEM) micrograph showing the morphology of Ag@α-Fe2O3 composite. In the inset are shown one single agglomerate and the
energy-dispersive X-ray spectrum (EDX) spectrum.
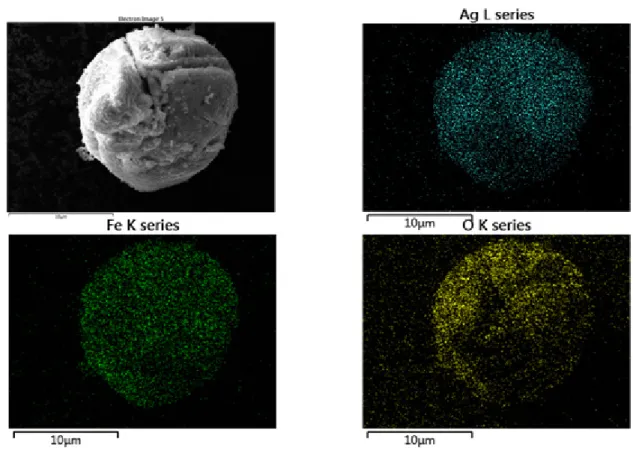
To have indications about the distribution of these elements on the sample surface, EDX elemental mapping analysis of the composite has been undertaken. Figure 2 shows the EDX elemental mapping of one particles aggregate, where the X-ray signal coming from Ag, Fe, and O, are represented by blue, green and yellow color, respectively. Data obtained shows the good uniformity regarding the spatial distribution of all these elements in the nanocomposite.
Transmission electron microscopy (TEM) analysis has been also performed to investigate the microstructure of the composite sample. Figure 3a reports a TEM image of the composite sample showing one large aggregate of nanoparticles.
In Figure 3b are visible isolated composite nanoparticles showing the core formed by Ag nanoparticles (AgNPs) 10–20 nm in diameter, surrounded by a shell of iron oxide having an average thickness of about 10–20 nm. It is interesting to note that, compared to α-Fe2O3 sample (see Figure 3c),
Ag@α-Fe2O3 nanoparticles appears to be almost round, suggesting that the presence of Ag NPs
hinders the crystallization process of the iron oxide. This is in agreement with XRD pattern of the
Ag@α-Fe2O3 composite (not shown), which highlight the presence of metallic Ag while peaks of
α-Fe2O3 are of very low intensity.
Figure 2. EDX elemental mapping showing the spatial distribution of Ag, Fe and O elements on the surface of the Ag@α-Fe2O3 nanocomposite agglomerate showed in the
SEM image.
Figure 3. Transmission electron microscopy (TEM) images of: (a) and (b) Ag@α-Fe2O3
composite; (c) α-Fe2O3.
2.2. UV-Vis
Optical absorptions spectra of Ag and Ag@α-Fe2O3 nanoparticles measured as a function of the
wavelength are shown in Figure 4. As-synthesized Ag colloid exhibit a absorption peak at 422 nm, a
50 nm
30 nm
20 nm
(a) (b)
characteristic peak assigned to Ag colloid with diameter <50 nm [16]. After formation of Ag@α-Fe2O3
core–shell, Ag plasmon peak exhibits a blue shift with simultaneous decrease in peak intensity. According to [17], this shift is due to the scattering effect of Fe2O3 shell around silver core.
300 400 500 600 700 0 2 4 Ag@α-Fe2O3 Ag NPs A bs or ban ce Wavelength (nm)
Figure 4. UV-Vis spectra of Ag nanoparticles and Ag@α-Fe2O3 core–shell nanocomposites. According to characterization results, formation mechanism for Ag@α-Fe2O3 core–shell
nanoparticles is shown in Figure 5. Upon adding PVP to the AgNO3 solution, Ag+ nuclei become
covered by surfactant, and after adding NaBH4, they are reduced to form Ag0 nanoparticles. The steric
repulsion of PVP inhibits agglomeration of Ag0 nanoparticles. When iron precursor is added, it is
adsorbed on the surface of Ag NPs and subsequently slowly hydrolyzed, forming a shell around the Ag core. After calcination surfactant molecules are removed, and the shell is thermally decomposed to generate the hematite α-Fe2O3 shell, producing a uniform core–shell of α-Fe2O3 nanoparticles.
Figure 5. Schematic mechanism for the formation of core@shell structured Ag@α-Fe2O3.
2.3. Sensing Tests
The synthesized composite with a core–shell structure has been used to fabricate gas sensor devices for detection of low concentrations of ethanol in air. First, a lot of preliminary work has been done to find the optimal operation temperature. The temperature of 250 °C has been chosen on the basis of the better performance obtained for ethanol detection in terms of sensitivity, selectivity and fast
Calcination 600 °C/2 h Coating by
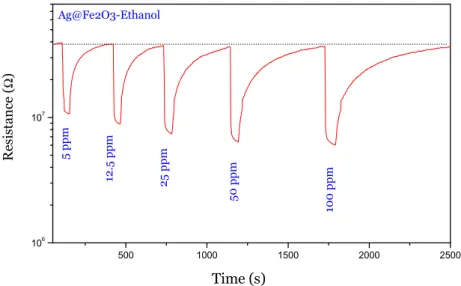
response/recovery time. Figure 6 shows the dynamic gas sensing characteristics of Ag@α-Fe2O3
towards different low concentrations of ethanol in air. The sensor showed the typical n-type gas sensing behavior, which can be explained as following. At the beginning of the sensing experiment, the sensor exposed to a dry air atmosphere exhibited a high resistance due to the oxidation reaction between surface electrons and oxygen molecules. After introduction of ethanol vapor into the testing chamber, the baseline resistance was immediately reduced. When the ethanol vapor was cut off from the chamber, the resistance was completely recovered to the original value in base gas. This result indicates that the Ag@α-Fe2O3 sensor is fully reversible to ethanol.
500 1000 1500 2000 2500 106 107 5 ppm 12 .5 ppm 25 ppm 10 0 ppm 50 ppm Re sis ta n ce ( Ω ) Time (s) Ag@Fe2O3-Ethanol
Figure 6. Sensing response of Ag@α-Fe2O3 towards different concentrations of ethanol
vapor at 250 °C.
The calibration curve of the Ag@α-Fe2O3 sensor to different concentrations of ethanol vapor is
shown in Figure 7a. For comparison, in the same graph, the calibration curve related to pristine α-Fe2O3 sensor is also plotted. It can be clearly evidenced that the composite-based sensor is more
sensitive compared to pristine α-Fe2O3 sensor in the range of concentrations investigated, which is in
agreement with results of Zhu et al. [4]. As shown in Figure 7b, the response of both sensors has a good linear relationship with the ethanol concentration (12.5–500 ppm range) in logarithmic forms, which is in good agreement with the theory of power laws proposed for semiconductor sensors [18]. The approximate linearity of sensitivity in the broad concentration range is quite suitable for the measurement of ethanol, which could offer wide applications for ethanol detection. Furthermore, it appears that the composite sensor is able to detect sub-ppm concentrations of ethanol with high signal/noise ratio.
Figure 8a shows response and recovery time for Ag@α-Fe2O3 sensor as a function of ethanol
concentration. As it can be seen, with increase of ethanol concentration, response time decreases and recovery time increases. Indeed as ethanol concentration increases more ethanol molecules interact with adsorbed oxygen ions, providing a fast response (shorter time), and obviously they need more time to desorb from surface. The response times are shorter for Ag@α-Fe2O3 core–shell
nanocomposites in comparison with α-Fe2O3 (Figure 8b). According to the response/recovery time
for Ag@α-Fe2O3 and α-Fe2O3, respectively. Decrease in response time is probably due to decrease of
activation energy of adsorption of ethanol in the presence of silver. However, recovery times are longer for Ag@α-Fe2O3 nanoparticles. The slow recovery can be explained by the sluggish surface
reactions regarding the adsorption, dissociation, and ionization of oxygen [19].
(a) (b)
Figure 7. (a) Sensing response of Ag@α-Fe2O3 and α-Fe2O3 towards different
concentrations of ethanol vapor at 250 °C; (b) Linear relationship of log S-log C for Ag@α-Fe2O3 and α-Fe2O3 sensors.
(a) (b)
Figure 8. (a) Response and recovery times for Ag@α-Fe2O3 sensor; (b) Response of
Ag@α-Fe2O3 and α-Fe2O3 sensors towards 12.5 ppm ethanol at 250 °C.
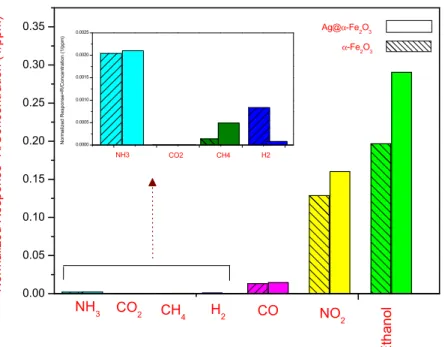
The normalized response (R/concentration) of both sensors towards different gases such as NO2,
CO, CO2, etc. is shown in Figure 9.
It indicates that the sensing response towards ethanol for both sensors is higher than for other reducing gases investigated (especially NH3, CO2, CH4 and H2). The sensors show instead a certain
sensitivity to NO2. However, the magnitude of the normalized response, for ethanol and NO2, is 0.2904
and 0.1968, 0.16 and 0.12875 for Ag@α-Fe2O3 and α-Fe2O3 sensors, respectively. These values also
demonstrated that Ag@α-Fe2O3 sensor is more selective than α-Fe2O3 sensor.
0 100 200 300 400 500 1 2 3 4 5 6 7 8 9 10 11 Re spo ns e=R a/ Rg Ethanol concentration (ppm) Ag@α-Fe2O3 α-Fe2O3 T=250 °C 1 10 100 1000 1 10 R esp on se= R a/ R g Ethanol concentration (ppm) Ag@α-Fe2O3 α-Fe2O3 T=250°C 0 100 200 300 400 500 3 4 5 6 7 8 9 10 200 400 600 800 1000 1200 1400 Re cov ery t ime (s ec) Ethanol concentration (ppm) Re sp on se t im e (se c) Ag@α-Fe2O3 0 100 200 300 400 500 1,0 1,5 2,0 2,5 3,0 Resp on se ( R a/ Rg) Time (sec) Ag@α-Fe2O3 α-Fe2O3
Figure 9. Normalized response of Ag@α-Fe2O3 and α-Fe2O3 sensors at 250 °C. In the inset,
the response to some reducing gases is magnified. 2.4. Sensing Mechanism
For metal oxide gas sensors, the sensing is based on the change in resistance, which is caused by the adsorption and desorption of ethanol molecules on the surface of sensing films in ethanol atmospheres. When α-Fe2O3 or Ag@Fe2O3 sensors are exposed to air, oxygen molecules would be adsorbed on the
surface of oxide. The adsorbed oxygen molecules would trap electrons from conduction band of α-Fe2O3 because of the strong electronegativity of oxygen atom, and produce ionized oxygen species
such as O O , O . The reaction kinetics may be explained by the following reactions [20]:
O ( ) → O ( ) (1)
O ( )+ e = O ( ) (2)
O ( )+ e = 2O( ) (3)
O( )+ e = O( ) (4)
The electrons transfer from the conduction band to the chemisorbed oxygen results in the decrease in the electron concentration and an increase in the resistance of α-Fe2O3 and Ag@α-Fe2O3. When the
α-Fe2O3 or Ag@α-Fe2O3 sensor is exposed to ethanol, the ethanol molecules could be chemisorbed on
the surfaces of α-Fe2O3 or Ag@α-Fe2O3 nanoparticles, and these chemisorbed ethanol molecules
would react with the adsorbed oxygen species to form H2O and CO2. The trapped electrons are then
released back to the α-Fe2O3 or Ag@α-Fe2O3 nanoparticles, leading to a decreased resistance of the
sensor [4]:
C H OH( )+ O( ) = CH CHO( )+ H O + e (5)
CH CHO( )+ 5O( ) = 2CO + 2H O + 5e (6)
CH CHO( )+ 6O( ) = 2CO + 3H O + 12e (7)
0.00 0.05 0.10 0.15 0.20 0.25 0.30 0.35 α-Fe2O3 Normal ized Response= R/ Con ce n tr at io n (1/ p pm ) Et h anol NO2 CO NH3 CO2 CH 4 H2 Ag@α-Fe2O3 0.0000 0.0005 0.0010 0.0015 0.0020 0.0025 N or m a liz ed Re sp o ns e = R /C on ce nt ra tio n ( 1/p pm ) NH3 CO2 CH4 H2
Accordingly, the magnitude of sensor response depends on two factors: the number of electrons which are captured by adsorbed oxygen molecules from the conduction band and the number of electrons that are released by the ethanol molecules reacting with adsorbed oxygen molecules.
In case of Ag@α-Fe2O3, according to [4,21], Ag core has three crucial rules: (i) an electron donates
to gaseous oxygen, according to Equations (2)–(4), and consequently accelerate these reactions on the surface; (ii) an electron reservoir releases electrons from surface, according to Equations (5)–(7); and (iii) there is decreased ethanol adsorption and desorption energy on the iron oxide shell. Therefore, in the case of Ag@α-Fe2O3, sensor response is higher than pure α-Fe2O3 and the response times of
Ag@α-Fe2O3 are shorter than pristine α-Fe2O3. A possible sensing mechanism for Ag@α-Fe2O3 sensor
is presented in Figure 10.
In summary, the peculiar hierarchical nano-architecture and the chemical and electronic sensitization effect of Ag nanoparticles in Ag@α-Fe2O3 sensors are the key factors in enhancing the
ethanol response of the nanocomposite-based sensor in comparison to pristine α-Fe2O3 sensor. The
same apply to explain the enhanced selectivity of the Ag@α-Fe2O3 sensor compared to that of α-Fe2O3
one. Indeed, Ag NPs likely promote oxygen adsorption/dissociation, thus favoring the reactions involved in the sensing mechanism and resulting in the surface reactivity enhancement for ethanol with respect to other interfering gases.
Figure 10. Possible ethanol sensing mechanism by Ag@α-Fe2O3 core–shell
nanocomposites (according to [4,21]). 3. Experimental Section
3.1. Chemicals
All chemicals used in the experiment were analytic reagent (AR). Silver nitrate (≥99.0% AgNO3) as
Ag source, sodium borohydride as reducing agent (≥99.0% NaBH4), citric acid (>99.0% C6H8O7 ×
H2O) as chelating agent, PEG-4000 as a esterification agent, iron sulfate (≥97% Fe2(SO4)3 × H2O) as
α-Fe2O3 source and poly(vinylpyrrolidone) (PVP-MW ~ 1300000) as stabilization agent were obtained
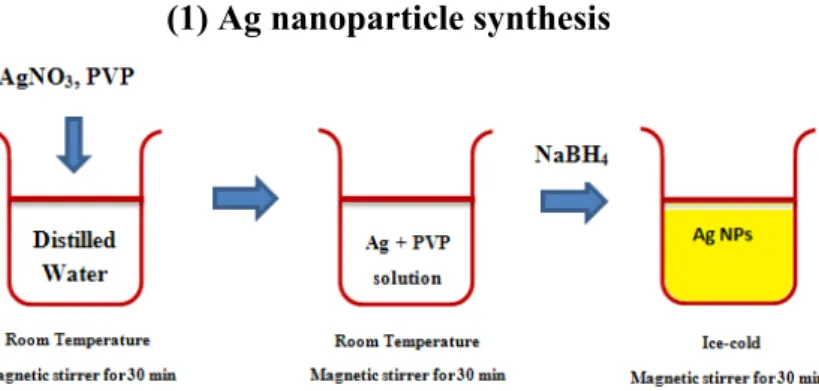
3.2. Ag Nanoparticle Synthesis
The solutions of PVP and AgNO3 were prepared by dissolving appropriate amounts of PVP and
AgNO3 in redistilled water in separate well-cleaned dry beakers at room temperature. Then PVP
solution and AgNO3 solution were mixed and magnetically stirred for 60 min to form Ag+-PVP
solution. In a separate beaker, the NaBH4 solution was prepared by dissolving the required amount in
distilled water. Ice bath was used to slow down the reaction and give better control over final particle size/shape. Then NaBH4 solution was added dropwise, (about 1 drop/second, until it is all used up) to
Ag+-PVP solution under vigorous stirring and solution stirred for another 10 min. Upon sodium
borohydride addition, the color of the solution slowly turned into pale yellow, indicating the reduction of the Ag+ ions to metallic silver.
3.3. Ag@α-Fe2O3 Nanoparticle Synthesis
Core–shell Ag@α-Fe2O3 nanocomposites were synthesized using a sol-gel coating process as
follow: to coat the silver nanoparticles, an Fe+3 sol was prepared by Pechini sol-gel method using iron
sulfate (III) as an Fe+3 source, citric acid as a chelating agent and PEG-6000 as a esterification agent
(details can be found in the [22]). The Fe+3 sol was added drop by drop to the solution of silver colloids
and the solution was stirred for 15 min. Finally, the mixture was refluxed for 2 h under moderate stirring at 120 °C and the core–shell solution of Ag@α-Fe2O3 was prepared. Figure 11, reports a
schematic picture of the synthesis procedure. For comparison, pure α-Fe2O3 nanoparticles were
synthesized by the same Pechini sol-gel method according to [22]. (1) Ag nanoparticle synthesis
(2) Iron oxide sol preparation (3) Ag@α-Fe2O3 synthesis
3.4. Characterization
Morphological analysis was carried out by SEM using a ZEISS 1540XB FE SEM instruments (Zeiss, Germany) equipped with an EDX detector. Particle size and shell formation studies of synthesized core–shells were performed with a JEOL JEM 2010 electron microscope (LaB6 electron gun), (JEOL, Tokyo, Japan) operating at 200 kV and equipped with a Gatan 794 Multi-Scan CCD camera.
Optical absorbance of silver nanoparticles as well as Ag@α-Fe2O3 core–shells were recorded using
a UV–Vis spectrophotometer (Evolution 500, Thermo Electron Corp., USA,) as a function of wavelength in the range from 300 to 700 nm.
3.5. Gas Sensing Measurements
To measure the sensor response of the core–shell nanoparticles for different gases, a sensor device was prepared as follows: the synthesized Ag@α-Fe2O3 core–shell as well as α-Fe2O3 nanoparticles was
drop coated on the cleaned Al2O3 substrate (6 mm × 3 mm sized) with interdigitated platinum
electrodes and a Pt heater located on the back. Before sensing tests, the sensor was conditioned in air for 2 h at 300 °C. The change in resistance of the device due to the presence of different gases was measured. The sensor was tested in the temperature range from 225 to 400 °C at various concentrations under a synthetic, dry air stream of 100 sccm by collecting the resistance data in the four-point mode. The gas sensing was performed by injecting pulses of the analyte from certified bottles. The gas response, S, is defined as S = Rair/Rgas for reducing gases and S = Rgas/Rair for oxidizing gases, where
Rair is the baseline resistance in air and Rgas is the electrical resistance of the sensor in the present of gas.
4. Conclusions
In this study, Ag@α-Fe2O3 core–shell nanoparticles were successfully synthesized using a simple
two step chemical route. Characterization techniques confirmed the core–shell structure of Ag@α-Fe2O3. According to TEM micrographs, the silver core with an average of 20 nm was covered
by a porous shell of Fe2O3 with thickness of 20 nm. As a very cheap gas sensor, the experiments on the
gas sensing properties showed that the Ag@α-Fe2O3 core–shell nanoparticles have better sensitivity to
ethanol than α-Fe2O3 nanoparticles. Moreover it showed negligible response towards other gases, i.e.,
high selectivity. In conclusion the silver@iron oxide core–shell nanocomposite prepared by the simple two step chemical route have strong potential as a ethanol sensing material with high selectivity.
Acknowledgments
This work was partially supported by the Iran Nanotechnology Initiative Council. Conflicts of Interest
References
1. Li, F.; Cheng, Z.; Yang, Y.; Wang, Y.; Chen, W. A facile and novel synthetic route to core–shell Al/Co nanocomposites. Mater. Lett. 2008, 68, 2003–2005.
2. Yu, Y.T.; Dutta, P. Examination of Au/SnO2 core-shell architecture nanoparticle for low
temperature gas sensing applications. Sens. Actuators B 2011, 157, 444–449.
3. Chung, F.C.; Wu, R.J.; Cheng, F.C. Fabrication of a Au@SnO2 core–shell structure for gaseous
formaldehyde sensing at room temperature. Sens. Actuators B 2014, 190, 1–7.
4. Zhu, Z.; KaO, C.T.; Wu, R.J. A highly sensitive ethanol sensor based on Ag@TiO2 nanoparticles
at room temperature. Appl. Surface Sci. 2014, 320, 348–355.
5. Kamat, P.V. Meeting the clean energy demand: nanostructure architectures for solar energy conversion. J. Phys. Chem. C 2007, 111, 2834–2860.
6. Song, H.Y.; Wu, X.F.; Yoon, J.M.; Yu, Y.T.; Chen, Y.F. Synthesis of core-shell Au@TiO2
nanoparticles with truncated wedge-shaped morphology and their photocatalytic properties. Langmuir 2009, 11, 6438–6447.
7. An, Z.G.; Zhang, J.J.; Pan, S.L. Facile preparation and characterization of glass/α-Fe2O3 core/shell
composite hollow spheres with the shell layer assembled by disk-like petals. Mater. Chem. Phys. 2009, 117, 209–213.
8. Shan, H.; Liu, C.; Liu, L.; Li, S.; Wang, L.; Zhang, X.; Bo, X.; Chia, X. Highly sensitive acetone sensors based on La-doped α-Fe2O3 nanotubes. Sens. Actuators B 2013, 184, 243–247.
9. Zhao, C.; Hu, W.; Zhang, Z.; Zhou, Z.J.; Pan, X.; Xie, E. Effects of SnO2 additives on
nanostructure and gas-sensing properties of α-Fe2O3 nanotubes. Sens. Actuators B 2014, 195,
486–493.
10. Bandgar, D.K.; Navale, S.T.; Khuspe, G.D.; Pawar, S.A.; Mulik, R.N.; Patil, V.B. Novel route for fabrication of nanostructured α-Fe2O3 gas sensor. Mater. Sci. Semiconduct. Process. 2014, 17,
67–73.
11. Sun, P.; Wang, W.; Liu, Y.; Sun, Y.; Ma, J.; Lu, G. Hydrothermal synthesis of 3D urchin-like α-Fe2O3 nanostructure for gas sensor. Sens. Actuators B 2012, 173, 52–57.
12. Sun, P.; Wang, C.; Zhou, X.; Cheng, P.; Shimanoe, K.; Lu, G.; Yamazoe, N. Cu-doped α-Fe2O3
hierarchical microcubes: Synthesis and gas sensing properties. Sens. Actuators B 2014, 193, 616–622.
13. Sun, P.; Du, S.; Xu, X.; You, L.; Ma, J.; Liu, F.; Liang, X.; Sun, Y.; Lu, G. Hierarchical α-Fe2O3/SnO2 semiconductor composites: Hydrothermal synthesis and gas sensing properties.
Sens. Actuators B 2013, 82, 336–343.
14. Manikam, V.R.; Cheong, K.Y.; Razak, K.A. Chemical reduction methods for synthesizing Ag and Al nanoparticles and their respective nanoalloys. Mater. Sci. Eng. B 2011, 176, 187–203.
15. Arena, A.; Donato, N.; Saitta, G.; Bonavita, A.; Rizzo, G.; Neri, G. Flexible ethanol sensors on glossy paper substrates operating at room temperature. Sens. Actuators B 2010, 145, 488–494. 16. Solomon, S.D.; Bahadory, M.; Jeyarajasingam, A.V.; Rutkowsky, S.A.; Boritz, C.; Mulfinger, L.
Synthesis and study of silver nanoparticles. J. Chem. Educ. 2007, 84, 322–325.
17. Chou, C.C.; Chu, K.S. Fabrication and characterization of silver core and porous silica shell nanocomposite particles. Microporous Mesoporous Mater. 2007, 98, 208–213.
18. Yamazoe, N.;Shimanoe, K. Theory of power laws for semiconductor gas sensors. Sens. Actuators B 2008, 128, 566–573.
19. Choi, J.K.; Hwang, I.S.; Kim, S.J.; Park, J.S; Park, S.S.; Jeong, U.; Kang, Y.C.; Lee, J.H. Design of selective gas sensors using electrospun Pd-doped SnO2 hollow nanofibers. Sens. Actuators B
2010, 150, 191–199.
20. Morrison, S.R.Semiconductor gas sensors. Sens. Actuators B 1981–1982, 2, 329–341.
21. Wu, R.J.; Lin, D.J.; Yu, M.R.; Chen, M.H.; Lai, H.F. Ag@SnO2 core–shell material for use in
fast-response ethanol sensor at room operating temperature. Sens. Actuators B 2013, 178, 185–191.
22. Wu, Y.; Wang, X. Preparation and characterization of single-phase α-Fe2O3 nano-powders by
Pechini sol–gel method. Mater. Lett. 2011, 65, 2062–2065.
© 2015 by the authors; licensee MDPI, Basel, Switzerland. This article is an open access article distributed under the terms and conditions of the Creative Commons Attribution license (http://creativecommons.org/licenses/by/4.0/).