Copyright © 2017 Korean Stroke Society
This is an Open Access article distributed under the terms of the Creative Commons Attribution Non-Commercial License (http://creativecommons.org/licenses/by-nc/4.0/) which permits unrestricted non-commercial use, distribution, and reproduction in any medium, provided the original work is properly cited.
pISSN: 2287-6391 • eISSN: 2287-6405 http://j-stroke.org 239
Journal of Stroke 2017;19(2):239-241 https://doi.org/10.5853/jos.2016.01620
Letter to the Editor
Dear Sir:
We have read with interest the article by Bridge and Thijs1 fo-cused on how selecting cryptogenic stroke patients to screen for atrial fibrillation (AF).
Cryptogenic stroke is an exclusion diagnosis, which is reached by ruling out known causes;2 however, it is possible that a silent AF may play a key role in the pathogenesis of this kind of stroke.3 In recent years, the use of prolonged outpatient cardiac monitor-ing has led to detection of low-burden AF in 15% of cryptogenic stroke patients.2
Bridge and Thijs emphasize resting electrocardiographic find-ings as simple and effective markers for selecting patients who should undergo further electrocardiogram (ECG) monitoring.1 Since it is really difficult and expensive to perform prolonged ECG monitoring in all cryptogenic strokes, resting 12-lead ECG parameters could help to identify subgroups of patients to sub-mit to further ECG monitoring.4
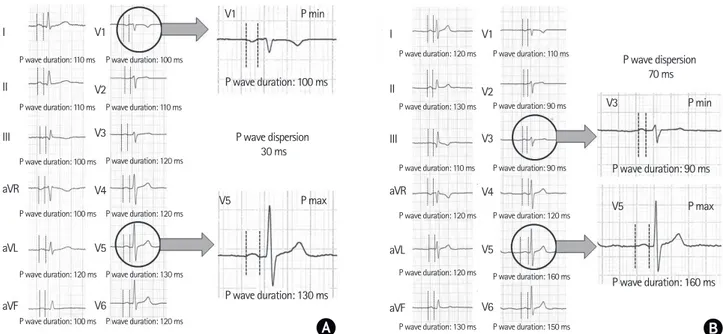
Nevertheless, Bridge doesn’t take account of P wave dispersion (PWD), a well-known ECG parameter, predictor of AF.5 PWD is defined as the difference between the maximum and the mini-mum P wave duration detected in a 12-lead ECG. A standard 12-lead ECG is generally used to measure PWD: P wave duration is manually measured from the beginning of the P wave deflec-tion from the isoelectric line to the end of the deflecdeflec-tion return-ing to isoelectric line in all simultaneous 12 leads of a standard paper-printed ECG. Therefore, PWD results from the difference between the shortest and the longest P wave duration in any of the simultaneous 12 ECG leads (Figure 1). PWD can be
calculat-ed by measurements on paper or computerizcalculat-ed methods. How-ever, manual measurement of P wave duration is feasible, more stable and reliable when performed on the high-resolution screen of a digital ECG system: scanning and digitizing paper-printed ECGs allow to achieve greater precision in detecting and measuring PWD.6
Increased PWD values reflect the inhomogeneous propagation of sinus impulses and the prolongation of atrial conduction time, a recognized electrophysiological substrate in patients with par-oxysmal AF. PWD was proven to be a sensitive and specific ECG marker for the risk of AF occurrence with a cutoff value of 40 ms for the identification of patients with history of paroxysmal lone AF in comparison with healthy subjects.5 Various insults leading to atrial remodeling result in slowed atrial conduction with in-homogeneous recovery, reflecting prolonged, inin-homogeneous and anisotropic distribution of connections between atrial myo-cardial fibers.7 PWD may be particularly relevant to cryptogenic stroke where high PWD values could originate from multiple in-flammatory insults directed against atrial myocardial cells.8 In fact, in patients with cardioembolic stroke and paroxysmal AF, increased PWD values has been consistently reported (Table 1).3,9 Furthermore, an our own previous study3 showed that PWD val-ues in cryptogenic stroke, as well as in cardioembolic group, are higher in comparison with healthy subjects, suggesting that PWD may be a marker to identify groups of patients to submit to longer ECG monitoring. Similarly, in recurrent transient ischemic attacks, high PWD values were observed, suggesting that a PWD>40 msec may be linked to an underlying silent paroxysmal AF, possible cause of ischemic recurrence.10 Another recent
stu-How to Identify Patients at Risk of Silent Atrial
Fibrillation after Cryptogenic Stroke: Potential Role of
P Wave Dispersion
Maurizio Acampa,
aPietro Enea Lazzerini,
bGiuseppe Martini
aaDepartment of Neurological and Sensorineural Sciences, General Hospital “Santa Maria alle Scotte”, Azienda Ospedaliera Universitaria Senese, Siena, Italy
Acampa, et al. P Wave Dispersion in Cryptogenic Stroke
240 http://j-stroke.org https://doi.org/10.5853/jos.2016.01739
dy11demonstrated increased PWD values in cryptogenic stroke patients, also suggesting an association with impaired left atrial mechanical functions and atrial enlargement, involved in the pathophysiology of AF. Conflicting results were reported by a previous study only,12 which found no difference in PWD values in acute stroke patients vs. control group. However in this study, patients with history of AF and cardiac diseases were excluded. Moreover, pathogenesis of ischemic strokes was not reported. PWD represents a promising marker of AF occurrence in these patients and a useful tool to identify subjects needing prolonged ECG monitoring; however, since these small reported studies didn’t evaluate the correlation between this ECG marker and fu-ture detection of AF in cryptogenic stroke, further prospective studies are needed, in order to evaluate the relationship between
PWD values and AF detection during prolonged ECG monitoring. Finally, in our recent paper,4 we suggested that 12-lead resting ECG represents a great potential tool in the evaluation of pa-tients with cryptogenic stroke, because, besides PWD, ECG may show other P wave indices, such as P wave duration above 120 ms and PR interval greater than 200 ms. These indices provide important information on atrial electric abnormalities during si-nus rhythm: they reflect subclinical atrial remodeling, secondary to the cumulative exposure to heterogeneous insults, represent-ing a substrate for AF.
References
1. Bridge F, Thijs V. How and when to screen for atrial fibrilla-Table 1. Clinical studies on P wave dispersion in patients with stroke
Author (year)
Subjects evaluated Age (years) Patients and control group characteristics P wave dispersion (msec) Patient
group Control group Patient group Control group Patient group Control group Patient group Control group P Kocer et al. (2009)12 67 58 64±12 61±7 Non-cardioembolic
strokes
Healthy subjects 45±20 43±12 n.s. Dogan et al. (2012)9 40 40 69±12 69±13 Ischemic strokes
with PAF Ischemic strokes without PAF 65±14 50±12 <0.001 Acampa et al. (2015)3 108 35 67±14 66±9 Cryptogenic strokes Healthy subjects 46±12 33±8 <0.05
Vural et al. (2015)11 40 40 41.9±6.7 42.5±7.1 Cryptogenic strokes Healthy subjects 30.1±7 27.4±3.5 0.02
Values are expressed as mean±standard deviation. PAF, paroxysmal atrial fibrillation; n.s., not significant.
P wave duration: 110 ms P wave duration: 100 ms
P wave duration: 110 ms P wave duration: 120 ms P wave duration: 120 ms P wave duration: 130 ms P wave duration: 120 ms P wave duration: 110 ms P wave duration: 100 ms P wave duration: 90 ms P wave dispersion 30 ms P wave dispersion 70 ms P wave duration: 130 ms P wave duration: 160 ms V5 V1 P max V5 P max I V1 V2 V3 V4 V5 V6 II III aVR aVL aVF I V1 V2 V3 V4 V5 V6 II III aVR aVL aVF P min V3 P min P wave duration: 100 ms P wave duration: 100 ms P wave duration: 120 ms P wave duration: 100 ms P wave duration: 120 ms
P wave duration: 120 ms P wave duration: 120 ms
P wave duration: 160 ms P wave duration: 150 ms P wave duration: 120 ms P wave duration: 130 ms P wave duration: 130 ms P wave duration: 110 ms P wave duration: 110 ms P wave duration: 90 ms P wave duration: 90 ms
Figure 1. Examples for measurement of P wave duration in 12 leads of two standard digitized paper-printed electrocardiogram (ECG) (A: healthy subject. B: patient with cryptogenic stroke). P wave duration is measured from the beginning of the P wave deflection from the isoelectric line to the end of the deflec-tion returning to isoelectric line in all simultaneous 12 leads of ECG. P wave dispersion results from the difference between the shortest (P minimum) and the longest (P maximum) P wave duration.
P wave duration: 110 ms P wave duration: 100 ms
P wave duration: 110 ms P wave duration: 120 ms P wave duration: 120 ms P wave duration: 130 ms P wave duration: 120 ms P wave duration: 110 ms P wave duration: 100 ms P wave duration: 90 ms P wave dispersion 30 ms P wave dispersion 70 ms P wave duration: 130 ms P wave duration: 160 ms V5 V1 P max V5 P max I V1 V2 V3 V4 V5 V6 II III aVR aVL aVF I V1 V2 V3 V4 V5 V6 II III aVR aVL aVF P min V3 P min P wave duration: 100 ms P wave duration: 100 ms P wave duration: 120 ms P wave duration: 100 ms P wave duration: 120 ms
P wave duration: 120 ms P wave duration: 120 ms
P wave duration: 160 ms P wave duration: 150 ms P wave duration: 120 ms P wave duration: 130 ms P wave duration: 130 ms P wave duration: 110 ms P wave duration: 110 ms P wave duration: 90 ms P wave duration: 90 ms B A
Vol. 19 / No. 2 / May 2017
http://j-stroke.org 241
https://doi.org/10.5853/jos.2016.01739
tion after stroke: insights from insertable cardiac monitoring devices. J Stroke 2016;18:121-128.
2. Saver JL. Clinical practice. Cryptogenic stroke. N Engl J Med 2016;374:2065-2074.
3. Acampa M, Guideri F, Tassi R, Dello Buono D, Celli L, di Toro Mammarella L, et al. P wave dispersion in cryptogenic stroke: a risk factor for cardioembolism? Int J Cardiol 2015;190:202-204.
4. Acampa M, Lazzerini PE, Martini G. Letter by acampa et al regarding article, “Underutilization of ambulatory ECG moni-toring after stroke and transient ischemic attack: missed op-portunities for atrial fibrillation detection”. Stroke 2016;47:e277. 5. Dilaveris PE, Gialafos JE. P-wave dispersion: a novel predictor
of paroxysmal atrial fibrillation. Ann Noninvasive Electrocar-diol 2001;6:159-165.
6. Dilaveris PE, Gialafos JE. P-wave duration and dispersion analysis: methodological considerations. Circulation 2001;103:E111.
7. Okutucu S, Aytemir K, Oto A. P-wave dispersion: what we know till now? JRSM Cardiovasc Dis 2016;5:2048004016639443. 8. Acampa M, Lazzerini PE, Guideri F, Tassi R, Martini G. Ischemic
stroke after heart transplantation. J Stroke 2016;18:157-168. 9. Dogan U, Dogan EA, Tekinalp M, Tokgoz OS, Aribas A, Akilli
H, et al. P-wave dispersion for predicting paroxysmal atrial fibrillation in acute ischemic stroke. Int J Med Sci
2012;9:108-114.
10. Koz C, Uzun M, Yokusoglu M, Ulas UH, Baysan O, Genc C, et al. Echocardiographic, electrocardiographic, and clinical cor-relates of recurrent transient ischemic attacks: a follow-up study. South Med J 2008;101:246-251.
11. Vural MG, Cetin S, Yilmaz M, Akdemir R, Gunduz H. Relation between left atrial remodeling in young patients with crypto-genic stroke and normal inter-atrial anatomy. J Stroke 2015;17:312-319.
12. Kocer A, Barutcu I, Atakay S, Ozdemirli B, Gul L, Karakaya O. P wave duration changes and dispersion. A risk factor or auto-nomic dysfunction in stroke? Neurosciences (Riyadh) 2009;14:14-18.
Correspondence: Maurizio Acampa
Department of Neurological and Sensorineural Sciences, General Hospital “Santa Maria alle Scotte”, Azienda Ospedaliera Universitaria Senese, viale Bracci, n.1, 53100 Siena, Italy
Tel: +39-577585476 Fax: +39-577586294 E-mail: [email protected] Received: October 22, 2016 Revised: March 8, 2017 Accepted: March 10, 2017