phd_unisi_076750_2.pdf
56FIRMATO DIGITALMENTE DA: Nome: NICLA
Cognome: LORITO Data: 19 febbraio 2021
66
Chapter III. Reprogramming of amino acid transporters to support
aspartate and glutamate dependency sustains endocrine resistance in
breast cancer
1. Introduction
The majority of breast cancers are positive for ER and/or PR and negative for HER2. These tumors depend on estrogen for their growth and survival and ET is the standard of care. However, around 40% of patients treated with ET relapse with a resistant disease and understanding the molecular and metabolic mechanisms underlying such resistance is an important need. We have previously shown that ET resistant cells are characterized by high glucose metabolic plasticity orchestrated by a miRNA-dependent regulation of key metabolic players (i.e., HK2) and that targeting this rewiring re-sensitizes ET resistant cells to the initial therapy [352].
miRNA are short (~22 nucleotides), noncoding RNA that mediate a post-transcriptional gene silencing by binding a complementary sequence in the 3’ untranslated region (3’ UTR) of the mRNA and impair its translation [388, 389], thus acting as regulators of cellular processes including proliferation, differentiation, and apoptosis and could also been involved in cancer initiation and progression [390], representing potential therapeutic targets [391]. Aberrant miRNA expression patterns have been observed in human breast cancer and are associated with tumorigenesis, metastasis, and poor prognosis. Particularly, a significant deregulation of miR-10, miR-125, miR-145, miR-21, miR-155, and miR-23b expression has been reported in breast cancer where they can act as tumor suppressors or oncomiR [392]. miRNA also exert a crucial role in ET response and resistance. For example, it has been demonstrated that miR-221/222 sustain SERD resistance by promoting β-catenin activation and the subsequent repression of the TGF-β-mediated growth inhibition [393]. More recently, miRNA have also been involved in the regulation of cancer metabolism [394]. For instance, miR-143 downregulates HK2 thus blocking glucose catabolism in breast cancer. Therefore, miR-155 promotes the transcription of HK2 by repressing miR-143, inducing a glycolytic phenotype in breast cancer cells [395]. However, it is still unclear whether the altered expression of miRNA is a causative event or the consequence of a pathological process. Defining the functional networks connecting miRNA and mRNA will contribute to their usefulness as therapeutic targets and will open novel opportunities for the development of diagnostic and therapeutic strategies.
Here we found that the enhanced miR-23b-3p expression induces a downregulation of the neutral and basic amino acid transporter SLC6A14, resulting in impaired amino acid metabolism in ET resistant cells. This alteration is supported first by the activation of autophagy and second by the selective import of aspartate and glutamate mediated by SLC1A2 transporter. The
67 metabolic drivers involved in this metabolic reprogramming are of clinical relevance and have prognostic and predictive value. Targeting these amino acid metabolic dependencies re-sensitizes ET resistant cells to the therapy and is essential to impair their aggressive features.
2. Results
2.1 Global genome analysis reveals a deregulated metabolic
miR-23b-3p/SLC6A14 node with prognostic value in endocrine therapy resistant
ER+ breast cancer
To uncover potential metabolic nodes related to AI resistance, we performed a genome-wide and miRNA profiling in an isogenic cellular model of breast cancer including (i) MCF7 parental cells cultured in the presence of estrogen (E2) to model a patient at the first diagnosis, (ii) MCF7 in the absence of E2 to mimic the reduction of E2 levels during response to AI, and (iii) MCF7 LTED (long-term estrogen deprived) cells which represent an established model of AI resistance. This global transcription analysis identified 3,568 mRNA and 62 miRNA significantly deregulated in MCF7 LTED compared to parental cells, both in the presence and absence of E2. A supervised hierarchical clustering analysis revealed a clear segregation between MCF7 and MCF7 LTED and, within the parental cells, there was an additional separation into E2 treated and shortly deprived (3 days) samples (Figure 1A). However, we decided to focus on MCF7 in presence of E2 and MCF7 LTED to mimic the clinical scenario of a postmenopausal woman who relapses after therapy with an AI. Gene set enrichment analysis (GSEA) showed that the majority of the differentially regulated gene sets in LTED versus parental cells are connected to metabolic pathways (Figure 1A) and, in particular, that LTED profile is inversely correlated with the gene set “amino acid transport across the plasma membrane” (Figure 1B). Since miRNA can regulate the target mRNA to impair its translation, their expression profiles are expected to be inversely correlated. Therefore, we generated a correlative network illustrating the potential miRNA-mRNA nodes deregulated in our model (Figure 1C). Since GSEA previously revealed a deregulated amino acid transport in MCF7 LTED cells, we focused on a metabolic hub involving miR-23b-3p [396], which showed a negative correlation with SLC6A14, a sodium-chloride-dependent transporter of all the amino acids across the plasma membrane with the exception of glutamate and aspartate [397, 398].
The clinical relevance of this deregulated metabolic node has been validated in retrospective clinical data showing that high expression of miR-23b-3p (Figure 1D) and low levels of
68 Figure 1. Global genome analysis reveals a deregulated miR-23b-3p/SLC6A14 node with prognostic value in endocrine therapy resistant ER+ breast cancer. (A) Supervised hierarchical clustering of RNA transcripts (left) and
miRNA (right) of 3 biological replicates of MCF7, MCF7 deprived from E2 for 3 days, and LTED cells that were subjected to gene or miRNA expression profiling using an Agilent Technologies assay. Differentially expressed genes
69
(n = 3.568; ANOVA) and miRNA (n = 62; ANOVA) were used for heatmap generation. High and low expression is normalized to the average expression across all the samples. On the left side, association of the genes in the heatmap with leading edge genes resulting from GSEA analysis on the specified gene sets is identified. (B) GSEA enrichment plot of amino acid transport dataset showing a negative association between the MSigDb M188 dataset and the LTED gene expression profile. NES, normalized enrichment score. (C) Anti-correlation network of differentially expressed miRNA and mRNA. Edge color is proportional to the strength of the anti-correlation (white to red = low to high). Node color is proportional to the LTED versus MCF7 log fold change (red, downregulated; green, upregulated). SLC genes are labeled in black; other miRNA or mRNA are labeled in gray. miR-23b and SLC6A14 nodes are highlighted as large circles. (D,E) Kaplan-Meier analysis of overall survival of BRCA TCGA cohort of ER+ patients divided into high and low expressing, as described in Methods, for miR-23b-3p (D: TGCA, high expressing, n = 68; low expressing, n = 475) or SLC6A14 (E: TGCA, high expressing, n = 257; low expressing, n = 467) expression.
2.2 Expression levels of miR-23b-3p and SLC6A14 are deregulated in
endocrine therapy resistant cells
Notably, we found that the deregulation of the miR-23b-3p/SLC6A14 axis was not a prerequisite of cells that are resistant to estrogen deprivation but also concurred to tamoxifen and fulvestrant resistance, thus suggesting a potential metabolic vulnerability that could be exploited for therapeutic or prognostic purposes. Indeed, qRT-PCR revealed enhanced expression of miR-23b-3p (Figure 2A) and reduced levels of SLC6A14 (Figure 2B) in MCF7 LTED, MCF7 TAMR, and MCF7 FULVR that are MCF7 derivatives mimicking tamoxifen and fulvestrant acquired resistance, respectively. Similar results were also obtained in LTED derivatives of the HCC1428 and ZR75.1 breast cancer cells (Figure 2C,D). Additionally, the induced overexpression of miR-23b-3p in the parental cells promoted the downregulation of the amino acid transporter (Figure 2E); conversely, miR-23b-3p silencing into LTED cells increased SLC6A14 levels (Figure 2E), validating the functional relation between these two molecular players.
Accordingly, all the ET resistant cells analyzed are characterized by a reduced uptake of exogenous 14C-radiolabeled amino acid pool compared to the parental counterpart (Figure 2F-2H) and this impaired amino acid upload was reverted through miR-23b-3p silencing (Figure 2I). However, no significant changes were reported in de novo protein synthesis (Figure 2J) between sensitive and resistant cells, thereby suggesting no effect of protein availability to support ET resistant cell growth.
70 Figure 2. Expression levels of miR-23b-3p and SLC6A14 are deregulated in endocrine therapy resistant cells.
(A–D) ET resistant derived and parental MCF7 (A,B), HCC1428 (C), and ZR75.1 (D) cells were subjected to qRT-PCR analysis using the assays described in the figure. Relative expression is shown using the parental cells as comparator. Data represent means ± SEM. One-way ANOVA; Dunnett corrected; *p < 0.05; **p < 0.01; ***p < 0.001. Each dot represents a biological replicate. (E) Total protein lysates from MCF7 and LTED cells transfected with the oligos as described in the figure for 72 h were subjected to western blot analysis, as indicated. (F–H) 14C-amino acid
mixture upload was measured in ET resistant and parental MCF7 (F), HCC1428 (G), and ZR75.1 (H) cells. The relative upload capacity is shown using parental cells as comparator. Data represent means ± SEM. One-way ANOVA; Dunnett corrected; *p < 0.05; **p < 0.01; ***p < 0.001. Each dot represents a biological replicate. (I) 14
C-amino acids mixture upload was measured in ET resistant derived MCF7 cells transfected for 72 h with either anti-miR-CTR or anti-miR-23b-3p oligos. The relative upload capacity is shown using anti-anti-miR-CTR transfected cells as comparator. Data represent means ± SEM. Student’s t test *p < 0.05; **p < 0.01; ***p < 0.001. Each dot represents a biological replicate. (J) LTED derivatives and parental counterparts of MCF7 and ZR75.1 cells were subjected to protein synthesis assay, as described in Methods. No differences were observed between parental and LTED cells in the absence or presence of the protein synthesis inhibitor cycloheximide (CHX, 50 mg/mL for 30 min). Data represent means ± SEM. One-way ANOVA; Dunnett corrected; ns, not significant.
71
2.3 Endocrine therapy resistant cells display enhanced autophagic flux
essential for their survival
Since we did not observe any reduction in protein synthesis (Figure 2J) and hypothetically in cell growth between MCF7 parental and LTED cells, despite the reduced amino acid uptake in the resistant models, we postulated that resistant cells may activate autophagy to compensate the decreased amino acid upload. Autophagy is an intracellular lysosomal self-digestion process consisting of the fusion of damaged/dysfunctional or superfluous subcellular components with lysosomes and their subsequent degradation. This pathway is responsible for the quality control of vital cellular organelles and is essential to fuel anabolic (including protein synthesis) and catabolic pathways in order to maintain homeostasis and support survival of normal and cancer cells during stress conditions such as nutrient deprivation or drug-induced cytotoxicity [399, 400]. The role of autophagy in cancer is still controversial and context-dependent [401]. In addition, autophagy and metabolism are intimately interconnected and it has been reported that the downregulation of SLC6A14 may induce autophagy activation [402]. Protein analysis by western blotting showed that LTED cells are characterized by enhanced levels of the microtubule-associated protein 1A-1B-light chain 3 (LC3), an established marker of autophagy activation, and that its expression is further increased after the administration of CQ (Figure 3A), which is able to inhibit lysosomal hydrolases by preventing endosomal acidification. Thus, CQ administration causes the accumulation of autophagosomes and avoids their degradation resulting in enhanced autophagic flux that may explain the further increased levels of LC3-II [403]. Autophagy activation is also regulated by beclin-1 [404] that is a pivotal scaffold protein for the autophagosome formation and resulted upregulated in all the ET resistant cells together with the LC3-II expression (Figure 3B).
Subsequently, we demonstrated that miR-23b-3p expression and autophagy induction are functionally related since the ectopic overexpression of miR-23b-3p in the parental cells improved LC3-II levels (Figure 3C); conversely, treating LTED cells with a miR-23b-3p inhibitor significantly impaired the expression of LC3-II (Figure 3D). Furthermore, ET resistant cells displayed a greater number of LC3 puncta after CQ treatment when compared to the parental cells (Figure 3E,F) and similar results were obtained in HCC1428 and ZR75.1 LTED models (Figure 3F). Based on the observation that ET resistant cells are characterized by increased autophagic flux than the parental counterpart, we performed a longer CQ treatment (120 hours) and the silencing of ATG7 (not shown), that is an E1-like activating enzyme essential for autophagy and involved in autophagosome formation and transport [405], and we observed a selectively and significantly impairment of cell survival in ET resistant cells (Figure 3G) with no effect on the parental counterpart, suggesting that autophagy targeting may re-sensitize ET resistant cells to the initial therapy.
72 An additional link between miR-23b-3p and autophagy comes from the notion that miR-23b-3p can act as regulator of beclin-1 [406]. Ubiquitination of beclin-1 on Lys63 (K63) sustains autophagy and is under the control of the balancing between the ubiquitinating enzyme tumor necrosis factor receptor (TNFR)-associated factor (TRAF6) and the deubiquitinating enzyme tumor necrosis factor alpha-induced protein 3 (TNFAIP3, also known as A20) [407]. TNFAIP3 is a predictive target gene of miR-23b-3p [408, 409], thus supporting the relation between autophagy and ET resistance. Accordingly, qRT-PCR showed reduced TNFAIP3 mRNA levels in LTED cells (Figure 3H) and western blotting and immunoprecipitation analyses revealed an increase of beclin-1 and K63-ubiquitinated beclin-1 in ET resistant cells (Figure 3J). The clinical relevance of this finding is supported by the association between low levels of TNFAIP3 and poor prognosis in a cohort of ER+ breast cancer patients from independent studies (Figure 3I).
73 Figure 3. Endocrine therapy resistant cells display enhanced autophagic flux essential for their survival. (A) LTED and parental MCF7 cells were subjected to 25 mmol/L CQ for 16 h. Total protein lysates were analyzed by western blotting with the antibody indicated. (B) Total protein lysates from ET resistant and parental MCF7 cells were subjected to western blotting analysis with the antibodies indicated. (C,D) Total protein lysates from MCF7 (C) and LTED (D) cells transfected with the oligos as described in the figure for 72 h were subjected to western blot analysis, as indicated. (E,F) MCF7 ET resistant and parental cells were treated with 25 mmol/L of CQ for 16 h and subjected to confocal analysis (E, green: LC3; blue: TOPRO-3, nuclei). Comparable analysis was performed for HCC1428 LTED and ZR75.1 LTED (F), and LC3 puncta were quantified (F) as described in Methods. Representative images are shown; scale bar, 10 mm. Data represent means ± SEM. Two-way ANOVA; **p < 0.01; ***p < 0.001. (G) ET resistant and MCF7 parental cells were grown either in the absence (vehicle) or presence of 50 mmol/L CQ treatment for 120 h before subjecting them to cell viability assay. Data are presented as fold change survival fraction of CQ treated versus vehicle treated cells. Representative images are shown. Data represent means ± SEM and were compared to parental cells using 1-way ANOVA; Dunnett corrected; ***p < 0.001. (H) LTED and MCF7 parental cells were subjected to qRT-PCR using the assay indicated. Data represent means ± SEM. Student’s t test; ***p < 0.001. (I) Kaplan-Meier analysis of overall survival of BRCA The Cancer Genome Atlas (TCGA) cohort of ER+ patients divided into high and low expressing, as described in Methods, for TNFAIP3 expression (high expressing, n = 231; low expressing, n = 493). The HR and log-rank Mantel-Cox p value are shown. (J) Total protein lysates from ET resistant
74
and parental MCF7 cells were subjected to immunoprecipitation (IP) using an anti-beclin-1 antibody and then subjected to immunoblotting (IB), as reported in the figure (top). Total lysates were also subjected to western blot analysis, as indicated (bottom).
2.4 Aspartate and glutamate intracellular levels correlate with the aggressive
features of endocrine therapy resistant cells
Despite the significant reduction of SLC6A14 expression in all the resistant cells (Figure 2B-2D), we observed only a slight decrease in amino acid uptake (Figure 2F-2H) and no changes in de novo protein biosynthesis (Figure 2J) compared to parental cells, suggesting that protein availability does not influence ET resistant cell growth. Thus, we checked wheatear there was an imbalance in the intracellular amino acid levels and we performed a high-performance liquid chromatography (HPLC) analysis. This analysis revealed increased intracellular levels of aspartate and glutamate in MCF7 LTED versus parental cells (Figure 4A), with no major changes in the levels of other amino acids. In line with the previously shown data, gene expression analysis revealed 57 significantly deregulated SLC genes (Figure 4B), 9 of which encoding for amino acid transporters, in LTED versus parental cells. Of these, 8 were downregulated in resistant cells, including SLC6A14, in line with the GSEA data analysis, and only a sodium-dependent acidic amino acid transporter, SLC1A2, was expressed at higher levels in LTED model (Figure 4B) to provide the increased intracellular content of aspartate and glutamate. This upregulation of SLC1A2 was confirmed by both western blot and qRT-PCR analysis in LTED compared to the corresponding parental cells (Figure 4B,C).
Silencing SLC1A2 in ET resistant cells further impaired amino acid upload (Figure 4D,E) and, in particular, reduced the incorporation of 14C-glutamate (Figure 4F) and 14C-aspartate (Figure 4G). Importantly, silencing SLC1A2 affected the survival of ET resistant cells (Figure 4H) and the selective deprivation of aspartate and glutamate negatively influenced the colony formation ability of LTED cells (Figure 4I), thus reinforcing our hypothesis that the specific dependency from aspartate and glutamate sustains the aggressive features of the resistant cells.
75 Figure 4. Aspartate and glutamate intracellular levels correlate with the aggressive features of endocrine therapy resistant cells. (A) Intracellular amino acids were extracted from LTED and parental MCF7 cells. Amino
acid derivatization was performed using 4-N,N-dimethylaminoazobenzene-40-sulfonyl chloride (DABS). DABS-amino acids were detected at visible light wavelengths using HPLC. A representative chromatogram is reported, and the quantification of aspartate (Asp) and glutamate (Glu) from 4 biological replicates is represented in a box and whiskers graph (mean, 25th percentile, and 75th percentile are shown; + indicates the median of the values). Student’s t test;
***p < 0.001. (B) Gene expression analysis of the significantly deregulated SLC transporters in LTED cells when compared to parental cells. Of the 57 significantly deregulated SLC genes, 9 amino acid transporters are shown in red. Each dot represents the mean value of the fold change derived by the analysis of 3 biological replicates (see Figure 1). Western blot analysis of total lysates from parental and LTED MCF7 cells for SLC1A2 is reported in the inset. (C) LTED and parental MCF7, HCC1428, and ZR75.1 cells were subjected to qRT-PCR using the assay indicated. Data represent means ± SEM, n = 3. Student’s t test; *p < 0.05; ***p < 0.001. (D–G) MCF7 ET resistant derivatives (D), HCC1428 LTED (E), and MCF7 LTED (F,G) were silenced using the non-targeting control (siCTR) or siRNA targeting SLC1A2 (siSLC1A2) for 72 h. 14C-amino acid (D,E), 14C-glutamate (F), and 14C-aspartate (G) uptake
was measured, and the radioactive signal normalized on protein content is shown using siCTR treated cells as comparators. Data represent means ± SEM. One-way ANOVA; Dunnett corrected; ***p < 0.001. (H) Complementarily, cell viability was measured using crystal violet staining and reported as fold change using parental
76
cells as comparator. Data represent means ± SEM. Student’s t test; ***p < 0.001. (I) ET resistant and parental cells were subjected to colony formation assay either in the presence of all of the amino acids (all) or in the absence of both aspartate and glutamate (-Asp, -Glu), as described in Method. Data represent means ± SEM of 3 biological replicates. Two-way ANOVA; Bonferroni corrected; *p < 0.05.
2.5 Aspartate and glutamate confer metabolic plasticity to endocrine therapy
resistant cells
To identify the destiny of the uploaded aspartate and glutamate, we performed a radioactive tracing analysis. The enhanced uptake of radioactive aspartate (Figure 5A) was paralleled by an increased incorporation of carbon units derived from aspartate into lipids (Figure 5B), proteins (Figure 5C), and DNA (Figure 5D) in LTED cells. Similarly, the high levels of radioactive glutamate uploaded in the resistant cells (Figure 5E) were paralleled by a significant incorporation of labelled carbon units only in DNA (Figure 5H), although a tendency towards increased radioactive signal in the extracted lipids and proteins was also observed (Figure 5F,G).
To further dissect the contribution of aspartate and glutamate in the metabolism of LTED cells, we performed a liquid chromatography-mass spectrometry (LC-MS) culturing cells in a medium containing uniformly (U) labeled 13C-aspartate (Figure 5I) or 13C-glutamate (Figure 5J). Consequently, we analyzed the 13C-labeling of TCA cycle intermediates and metabolites that could act as precursors of anaplerotic processes (e.g., uridine-5’-triphosphate, UTP, for DNA synthesis and glutamine for protein synthesis). When cells were cultured in the presence of U-13C-aspartate, we observed a significant increase in 13C-labeled citrate, α-KG, succinate, fumarate, and malate in LTED versus parental cells together with a significant enhanced labeling of UTP and glutamine (Figure 5I), suggesting that aspartate is an important source of carbons for TCA cycle and anabolic pathways. Isotopologues analysis revealed that LTED cells mainly exploit the canonical activity of the TCA cycle, since a substantial fraction of citrate was 4 atoms of 13C, whereas the fraction of 5 atoms was limited, suggesting that the reductive carboxylation of α-KG is not the predominant pathway (Figure 5I). Comparably, when we used a medium containing U-13C-glutamate, we noted a significant increase in 13C-labeled citrate, α-KG, succinate, fumarate, and malate in LTED cells compared to the parental counterpart (Figure 5J). These observations were paralleled by a significant enhanced labeling of UTP and glutamine (Figure 5J), implying that also glutamate is an essential source of carbons for TCA cycle and anabolic pathways.
Since we know that ET resistant cells display higher metabolic plasticity [353], we asked whether the increased aspartate and glutamate content was used not only for anabolic purposes but also to produce energy. Seahorse XFe Mito Stress Test analysis by monitoring oxygen consumption rate (OCR) revealed no significant changes in basal and maximal
77 respiration of MCF7 parental cells both in the presence and absence of single or both amino acids (Figure 5K,L). Conversely, the resistant cells significantly impaired their respiratory capacity after the simultaneous deprivation of aspartate and glutamate both in basal and under metabolic stress condition (Figure 5K,L). In contrast, the withdrawal of a single amino acid was not sufficient to impair the mitochondrial function in LTED cells, indicating that ET resistant cells can replenish the TCA cycle with aspartate or glutamate, when the other amino acid is deficient. These results are in line with the metabolomic analysis using U-13C-glutamate and U-13 C-asparate (Figure 5I,J).
78 Figure 5. Aspartate and glutamate confer metabolic plasticity to endocrine therapy resistant cells. (A–D)
LTED and MCF7 cells were subjected to 14C radioactive aspartate uptake (A) or cultured for 24 h in a medium
containing radioactive aspartate. Lipids, proteins, or DNA were extracted in parallel and radioactive signal measured to monitor the amount of aspartate that is incorporated into lipids (B), proteins (C), and DNA (D), as described in Methods. Each value was normalized on protein content. (E–H) LTED and MCF7 cells were subjected to 14C
79
radioactive glutamate uptake (E) or cultured for 24 h in a medium containing radioactive glutamate. Lipids, proteins, or DNA were extracted in parallel and the radioactive signal was measured to monitor the amount of glutamate that is incorporated into lipids (F), proteins (G), and DNA (H), as described in Methods. Each value was normalized on protein content. Data represent means ± SEM, n = 3. Student’s t test; *p < 0.05; **p < 0.01; ***p < 0.001; ns, not significant. (I,J) Schematic overview of the metabolism of downstream 13C-labeled aspartate and fluxes and relative
incorporation of 13C carbons derived from aspartate in the metabolites (I). Schematic overview of metabolism of
downstream 13C-labeled glutamate and fluxes and relative incorporation of 13C carbons derived from glutamate in the
metabolites (J). Two-way ANOVA, Sidak corrected; *p < 0.05; **p < 0.01; ***p < 0.001; ns, not significant. (K,L) Parental and LTED MCF7 cells were subjected to Seahorse XFe96 Mito Stress Test analysis and OCR was measured in real-time in the presence or absence of the indicated amino acids. Basal (K) and maximal (L) respiration was calculated as described in Methods, based on the OCR after the administration of the ATP synthase inhibitor oligomycin, the proton uncoupler carbonilcyanide p-triflouromethoxyphenylhydrazone (FCCP), and the respiratory complex I inhibitor rotenone, together with the respiratory complex III inhibitor antimycin A. Data represent means ± SEM. One-way ANOVA; Dunnett’s corrected; **p < 0.01.
2.6 Impairing the transport of aspartate and glutamate affects the metastatic
potential of endocrine therapy resistant cells in vivo
To further validate the amino acid metabolic reprogramming in our ET resistant models, we used an established ER+ breast cancer patient derived xenograft (PDX) model (HBCx34 TAMR) with acquired tamoxifen resistance [410]. qRT-PCR analysis showed reduced levels of SLC6A14 and, concomitantly, increased expression of SLC1A2 in TAMR PDX compared to the parental PDX (Figure 6A,B). In addition, resistant PDX were characterized by enhanced intracellular levels of glutamate and aspartate (Figure 6C,D) assessed by gas chromatography-MS (GC-chromatography-MS) analysis.
Moreover, since we have previously demonstrated that ET resistant cells display enhanced metastatic potential [352], we evaluated if SLC1A2 or miR-23b-3p targeting affected the invasive abilities in LTED cells. To directly consider the -3p isoform of the miR-23b, without the confounding effect of the -5p, we could not stably express the pre-miR-23b construct, since this would determine the downregulation of both the isoforms. Consequently, we transfected cells with either a control non-targeting miRNA (anti-miR-CTR) or an anti-miR-23b-3p in a short-term
in vivo assay, which has been demonstrated to reflect the metastatic potential of breast cancer
cells [411]. The invasive capacity depends on the cell ability to survive in circulation and colonize secondary sites. Thus, we transfected and labeled cells with different cell tracker dyes and injected them into the tail vein of SCID mice. Lung images 1-hour post-injection proved that an equivalent number of cells were inoculated. Imaging lungs 5 hours post-injection revealed a diminished number of anti-miR-23b-3p transfected cells retained into the lungs compared to the anti-miR-CTR treated cells (Figure 6E). Importantly, similar results were achieved when cells were transfected with siSLC1A2 (Figure 6F), suggesting that both miR-23b-3p and SLC1A2 are required for an efficient survival in circulation and for the metastatic ability of ET resistant cells. Finally, we evaluated the clinical relevance of our findings by assessing the prognostic and predictive value of the molecular drivers involved in the amino acid metabolic reprogramming of ET resistant cells. We analyzed a curated subset of around 800 ER+ breast cancer patients from different retrospective studies, previously treated with adjuvant tamoxifen. Kaplan-Meier
80 analysis revealed that TNFAIP3 (Figure 6G) and SLC6A14 (Figure 6H) lowering-expressing patients showed poor relapse-free survival (RFS) when compared with higher-expressing tumor women. The predictive value of SLC1A2 in response and resistance to ET was corroborated by an in silico analysis, which was done on publicly available gene expression data from 52 ER+ breast cancer patients. Biopsies were taken before and after two weeks of neo-adjuvant letrozole therapy [412] and patients were classified into responders and non-responders, based on a >50% and a <50% reduction in tumor volume following 3 months of letrozole treatment. The responder cohort significantly decreased SLC1A2 expression after two week-letrozole treatment while no changes were observed in the non-responder subgroup (Figure 6I). To seek of completeness, we validated the clinical relevance of SLC1A2 in a small cohort of ER+ breast cancer patients in response to adjuvant fulvestrant. Since the clinical outcome was not available, we exploited the variations in the proliferation related gene AURKA (aurora kinase A) as a readout of therapy response and we found that changes in SLC1A2 expression induced by fulvestrant positively correlated with alterations in AURKA (Figure 6J), corroborating the link between SLC1A2 levels and the changes in proliferation induced by fulvestrant.
In conclusion, these data support the involvement of the amino acid metabolic reprogramming in ET resistance, identifying miR-23b-3p and SLC1A2 as crucial molecular players with predictive value in ER+ breast cancer.
81 Figure 6. Impairing the transport of aspartate and glutamate affects the metastatic potential of endocrine therapy resistant cells in vivo. (A–D) ET (i.e., tamoxifen) sensitive and tamoxifen resistant PDX (HBCx34) were
obtained from ER+ breast cancer specimens previously characterized as described in Methods. Tumor tissues were excised, and total RNA was extracted and subjected to qRT-PCR using the assay to detect SLC6A14 (A) and SLC1A2 (B). Each dot represents an independent mouse. Alternatively, tumor tissues were extracted and subjected to GC-MS (as detailed in Methods) to evaluate the intratumoral levels of glutamate (C) and aspartate (D). Data represent means ± SEM. Student’s t test; *p < 0.05; **p < 0.01; ***p < 0.001. (E,F) MCF7 LTED cells were transfected with either anti-miR-23b-3p or a non-targeting control (anti-miR-CTR, E). Cells were labeled with CellTracker dyes (green for anti-miR-CTR and red for anti-miR-23b-3p) before injecting a mixture of anti-miR-23b-3p and anti-miR-CTR transfected cells in a 1:1 ratio into the tail vein of SCID mice (n = 4 per group), as described in Methods. Similarly, SLC1A2 silenced (red) and siCTR transfected cells (green) were injected (F). The lungs were recovered at the time indicated and imaged to analyze the number of fluorescent cells that colonize the lungs. Data shown are means for tumor cell coverage per field of view (FOV); n = 4 mice per group per time point ± SEM.
82
Representative images are shown; scale bar, 200 mm. ***p < 0.001. (G,H) Kaplan-Meier analysis of RFS of a curated cohort of ER+ patients treated with tamoxifen in the adjuvant setting and divided into high and low expressing as described in Methods for TNFAIP3 (G) and SLC6A14 expression (H). HR and log-rank Mantel-Cox p values are shown. (I) Correlation of SLC1A2 expression with response to AI in 52 paired ER+ breast cancer samples pre- and post-2-week letrozole treatment. A significant decrease in SLC1A2 expression was observed in the responder group, but no difference was found in the non-responder group (Wilcoxon paired t test). ns, not significant. Each dot represents the value derived by a patient’s specimen. Red lines connect the mean values pre- and post-letrozole treatment. (J) Correlation of the change in the SLC1A2 and AURKA expression levels following adjuvant fulvestrant treatment (Geo: GSE33658, n = 11; Spearman correlation and p value are indicated in the figure).
3. Discussion
Our study focused on an extensively characterized model of ET resistance that we and others proved to have clinical relevance [342, 413-415]. We demonstrated that the amino acid metabolic reprogramming is involved in the onset of ET resistance in ER+ breast cancer. Particularly, a reorganization of the amino acid transporters supports catabolic and anabolic processes by (i) the autophagy activation and (ii) a selective import of aspartate and glutamate in ET resistant breast cancer cells. Importantly, we validated our findings in PDX, in vivo assay, and retrospective clinical data derived from ET treated patients.
miR-23b, a member of the miR-23b/-27b/-24-1 cluster, has been found deregulated in several cancers (e.g., breast cancer, lymphoma, non-small-cell lung cancer, pancreatic cancer, colon cancer, and multiple myeloma) and its role as oncomiR or tumor suppressor is still controversial and seems to be context-dependent. For instance, in gastric and pancreatic cancer, it has been shown that reduced levels of miR-23b-3p sustain chemo- and radio-resistance, respectively [416, 417]. An additional complication is linked to the existence of the -5p and -3p isoforms that could play individual and/or opposite effects in a tissue-dependent manner. Since several studies did not explore which isoform was predominant in the subset of tumors analyzed, this bias may be the reason of the discrepancies observed among different works.
Here, we found that enhanced expression of miR-23b-3p orchestrates an amino acid metabolic reprogramming in ET resistant breast cancer cells and in a subset of patients with poor prognosis. Since a stable knockdown of this miRNA may be reached in vivo only through the parallel silencing of the two isoforms, we decided to perform a short-term lung retention assay consisting of the quantification of the residing cells in the lung after a tail vein injection. Such assay has the limitation of not recapitulating the intricate mechanism of the metastatic cascade; however, we have meticulously chosen the time points of the assay so that the cell ability to be retained in the lung corresponds to the capacity in surviving and colonizing the organ.
SLC6A14 is an ER-dependent amino acid transporter whose expression is exclusive of ER+ breast cancer where its targeting causes an autophagy related cell death [418]. Downregulated SLC6A14 is found in our models of ET resistance and is compatible with their survival. Thus, it is reasonable that the metabolic adaptation orchestrated by miR-23b-3p induces the impairment of SLC6A14, promoting a resistant phenotype characterized by potentiated pro-survival autophagy and enhanced dependency from aspartate and glutamate import which compensate
83 the reduced amino acid upload. Nevertheless, parental and resistant cells growth similarly and exhibit comparable rate of protein synthesis, thereby suggesting that autophagy may counteract the impaired amino acid dependency. However, although significantly diminished, the amino acid uptake was not abolished in ET resistant cells, indicating that other important amino acid transporters are still functioning. It has already been reported that the c-Myc-dependent glutamine transport contributes to ET resistant cell survival [348] and that autophagy activation may sustain tamoxifen resistance [419], that could be also supported by the LLGL2-dependent import of leucine [420]. Our investigation showed that SLC1A2 expression and the subsequent intracellular level of aspartate and glutamate are increased in ET resistant cells and PDX models, conferring them anabolic and catabolic advantages.
In summary, we demonstrated that both autophagy and aspartate and glutamate content are essential supporters of ET resistance. In a such complex scenario, the levels of aspartate and glutamate are not altered by autophagy inhibition and may be exploited to produce the other missing amino acids, limiting the dangerous reduction of the intracellular amino acid levels, that is a recognized activator of autophagy [421].
It is important to mention that SLC1A2 is involved in several types of cancer. For instance, in gastric and colorectal cancer, it has been observed a genomic breakpoint in the 5’ region of SLC1A2 that allows a fusion with CD44 [422, 423]. The aberrant formation of CD44-SLC1A2 increases the intracellular levels of glutamate and targeting SLC1A2 re-sensitizes tumors to chemotherapy [422]. Correspondingly, in our model, the upregulation of SLC1A2 results in enhanced intracellular levels of aspartate and glutamate and targeting this dependency impairs the aggressive features and re-sensitizes ET resistant breast cancer to the therapy. Despite we did not explore the possibility of a genomic rearrangement between CD44 and SLC1A2 in our model, we have evidence that CD44 is upregulated in the resistant cells compared to the parental counterpart, thereby making attractive the investigation of a potential gene fusion. Vander Heiden and colleagues have recently and extensively explored the role of aspartate in cancer. Firstly, they showed that OXPHOS-competent cells exploit mitochondrial respiration to boost aspartate biosynthesis and that aspartate addition is necessary for the proliferation of OXPHOS-defective cells [424]. Subsequently, it has been demonstrated that SLC1A3-mediated aspartate uptake [425] or the conversion of asparagine into aspartate [426] are useful events that allow to overcome the anabolic limitation that tumors experience and to sustain their growth. Additionally, aspartate limitation appears to be necessary for the anti-tumoral activity of metformin [427] and potentially other biguanides. Accordingly, we have previously proven that metformin is ineffective in AI resistant cells [352] and now this could be justified by the enhanced intratumoral aspartate levels exhibited by these cells.
SLC1A2 also functions as glutamate importer and, despite glutamate contribution to DNA, lipid, and protein biosynthesis is lower than that of aspartate in our model, it appears fundamental in sustaining anabolic pathways since only the simultaneous withdrawal of both the amino acids is
84 able to impair the respiratory capacity in ET resistant cells. Finally, this biosynthetic supportive role of aspartate and glutamate is endorsed by the observation that most carbons in cells originate from amino acids rather than glucose and glutamine [428].
In conclusion, our findings highlight an amino acid metabolic deregulation that sustains ET resistance and identify molecular drivers as predictive biomarkers and/or potential targets to be exploited to combat or delay ET resistance in ER+ breast cancer.
85
Chapter IV. Glucose metabolic reprogramming of ER+ breast cancer
in acquired resistance to the CDK4/6 inhibitor palbociclib
1. Introduction
Most breast cancers are ER+ and HER2-, thus depending on estrogen for their growth and survival. Targeting ER pathway through ET is the standard of care for these tumors but the emergence of resistance still represents a critical issue. Recently, the CDK4/6 inhibitor palbociclib has shown improved prognosis in patients with ER+/HER2- metastatic breast cancer treated in combination with ET both as first- and second-line therapy. However, despite clinical benefits, 15% of patients display innate or early resistance and 50% acquire resistance with progression within 25 months [138]. I have extensively described the molecular mechanisms underlying CDK4/6 inhibitor resistance in Chapter I (e.g., Rb loss, CDK2/4/6, CCNE1/2, and p16 amplification) and here we explored the metabolic adaptation that could emerge at the time of resistance based on recent evidence suggesting that the combination of autophagy and CDK4/6 inhibition has a synergistic anti-tumoral effect both in vitro and in vivo [224]. In particular, we investigated the glucose exploitation in a panel of isogenic ER+ breast cancer cell lines sensitive to palbociclib (PDS) and in their resistant derivatives (PDR) to identify potential metabolic drivers with prognostic value and propose novel combinatorial strategies to combat or delay the onset of resistance.
2. Results
2.1 Palbociclib affects the expression of key metabolic players implicated in
glucose catabolism
To explore the metabolic changes in glucose-dependent catabolism occurring during response and resistance to palbociclib, we focused on a series of PDS and PDR ER+ isogenic breast cancer cell lines, showing a different HER2 status, that have been previously characterized by gene expression profiling by our collaborators [429]: ZR75-1 and T47D cells that are HER2-, BT474 and MDA-MB-361 that are HER2+. Firstly, we performed a gene expression and protein analysis of the most important glycolytic drivers since CDK4/6 inhibitors have been suggested as perturbers of glucose metabolism [430].
GLUT1 is a mediator of glucose uptake and has been found upregulated in many cancers [431]. qRT-PCR analysis showed increased levels of GLUT1 in all the resistant cells (Figure 1A). Surprisingly, HK2, that is the rate-limiting glycolytic enzyme, appeared differentially expressed
86 in PDR cells changing on the basis of the genetic background (i.e., HER2 status): HER2- PDR cells moderately but significantly reduced HK2 levels, whereas HER2+ resistant counterparts enhanced its expression (Figure 1B) compared to the parental cells. Notably, drug administration (+PD) to PDS cells promoted a similar gene expression pattern (Figure 1A,B), indicating that a palbociclib acute treatment for 3 days may induce a metabolic shift towards the resistant phenotype in the parental cells. Changes in GLUT1 and HK2 expression were confirmed also at protein level both in PDS+PD and PDR cells (Figure 1C). These unexpected discrepancies between glucose transporter and HK2 render complicated the definition of the glucose-dependent metabolism and need to be validated at functional level. Indeed, HK2 expression is not an index of its enzymatic action and also different isoforms of HK exist thus potentially explaining the differences observed. To conclude the glucose metabolic characterization at protein level, we evaluated the expression of MCT1 and MCT4 that have been shown to act both as lactate exporters in Warburg-like cells [432] and we observed enhanced levels of MCT1 or MCT4 in HER2+ PDR cells together with a slight increase in PD treated parental cells compared to the sensitive counterpart. Conversely, HER2- PDR and PDS+PD cells decreased either MCT1 or MCT4 expression (Figure 1C).
87 Figure 1. Palbociclib affects the expression of key metabolic players implicated in glucose catabolism. (A,B)
PDR and PDS cells, in presence or absence of 1 µM palbociclib (PD), were subjected to qRT-PCR analysis. Relative expression is shown using PDS cells as comparator. Each dot represents a biological replicate. Gray shades are used for PDS cells, blue shades when PD is administrated to HER2− cells (either PDS or PDR), red shades when PD is administrated to HER2+ cells (either PDS or PDR). Data represent means ± SEM. One-way analysis of variance (ANOVA); Bonferroni corrected; * p < 0.05; ** p < 0.01; *** p < 0.001; **** p < 0.0001. (C) Total protein lysates from PDS (either in presence or absence of 1 µM PD) and PDR cells were subjected to western blot analysis, as indicated.
2.2 Palbociclib resistant cells show growth rates similar to the sensitive
counterpart while enhancing glucose uptake
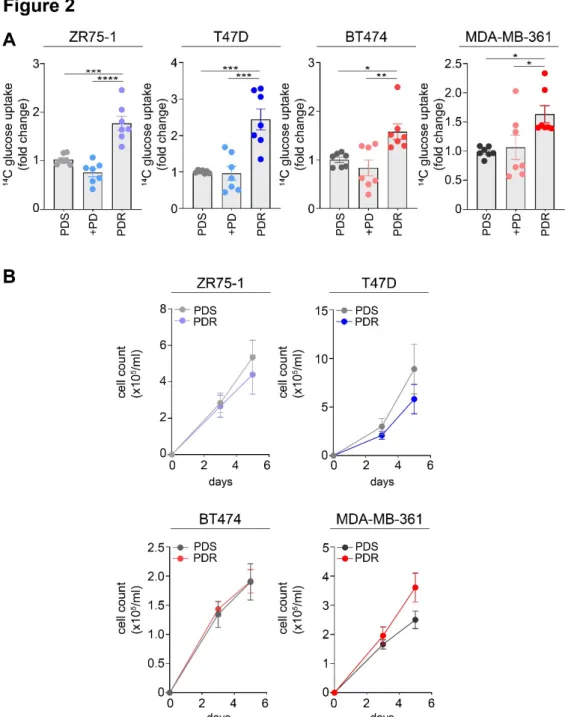
Then, we questioned whether the metabolic changes observed at molecular level had a functional consequence. According to our hypothesis, the enhanced expression of GLUT1 in the resistant cells was associated with improved glucose uptake, assessed by radioactive glucose tracing analysis (Figure 2A). However, despite we previously showed that palbociclib acute treatment significantly increased GLUT1 mRNA expression levels in the parental cells, we did
88 not register any significant changes in glucose upload after drug administration (Figure 2A). Interestingly, these alterations are not proliferation-dependent since comparable growth rates were reported between sensitive and resistant cells (Figure 2B) and, to prevent any confounding effects related to proliferation, all the metabolic assays were completed in 24 or 72 hours.
Figure 2. Palbociclib resistant cells show growth rates similar to the sensitive counterpart while enhancing glucose uptake. (A) 14C-glucose uptake was measured in PDS (either in presence or absence of 1 µM PD) and PDR
cells. The relative uptake capacity is shown using PDS cells as comparator. Each dot represents a biological replicate. Gray shades are used for PDS cells, blue shades when PD is administrated to HER2− cells (either PDS or PDR), red shades when PD is administrated to HER2+ cells (either PDS or PDR). Data represent means ± SEM. One-way ANOVA; Dunnett corrected; * p < 0.05; ** p < 0.01; *** p < 0.001; **** p < 0.0001. (B) No significant reduction in cell survival between PDS and PDR cells was observed by cell counting within the 5-day time range. Data represent means ± SEM. Two-way ANOVA; Bonferroni corrected.
89
2.3 HER2 status impacts on glucose catabolism and defines distinct glucose
dependencies during acute and chronic drug administration
To assess whether the enhanced glucose intake was paralleled by an improved glucose exploitation in the resistant cells, we performed Seahorse XFe analysis. Specifically, we used the Glycolytic Rate Assay which discriminates ECAR (extracellular acidification rate) from OCR following the serial injection of a mix of rotenone and antimycin A (Rot/AA), that inhibit the mitochondrial respiration by blocking ETC complex I and III respectively, and 2-DG to impair glycolysis. ER+/HER2- ZR75-1 and T47D cells significantly reduced glycoPER (glycolytic proton efflux rate – see Materials and Methods for more details) (Figure 3A,C) and consequently basal and compensatory glycolysis when resistant (Figure 3B,D). Conversely, ER+/HER2+ BT474 and MDA-MB-361 PDR cells increased glycoPER (Figure 3E,G) and accordingly also their basal and compensatory glycolysis when compared to the sensitive counterpart (Figure 3F,H). Additionally, palbociclib acute treatment impaired both these glycolytic parameters in the parental cells, regardless of HER2 status, suggesting that the metabolic changes induced by drug administration may differ from those of the resistant cells, at least in the HER2+ subgroup.
90 Figure 3. HER2 status impacts on glucose catabolism and defines distinct glucose dependency during acute and chronic drug administration. (A, C, E, G) PDS (either in presence or absence of 1 µM PD) and PDR cells were
subjected to seahorse XFe96 Glycolytic Rate Assay and glycoPER was measured in real-time and normalized on protein levels. (B, D, F, H) Basal and compensatory glycolytic capacity was calculated as described in Methods, based on ECAR and OCR after the administration of the respiratory complex I inhibitor rotenone, together with the respiratory complex III inhibitor antimycin A following by the glycolysis inhibitor 2-DG. Data represent means ± SEM. Each dot represents at least three technical replicates from three biological replicates. Blue dots are from HER2− cells, red from HER2+. One-way ANOVA; Dunnett’s corrected; **** p < 0.0001.
91 We also performed a Mitochondrial Stress Test to evaluate whether resistant and parental cells may exploit the OXPHOS to meet the energetic demand under metabolic stress condition. Compared to the Glycolytic Rate Assay, different drugs were serially injected in the Mitochondrial Stress Test: oligomycin that inhibits mitochondrial complex V, the OXPHOS uncoupler FCCP (carbonyl cyanide-4-(trifluoromethoxy)phenylhydrazone), and a mix of Rot/AA. In line with the results derived from the Glycolytic Rate Assay, HER2- PDR cells significantly increased OCR level and accordingly basal and maximal respiration compared to PDS (Figure 4A-D). In contrast, HER2+ cells displayed impaired OCR and related parameters when become resistant (Figure 4E-H).
These results suggest that the mitochondrial respiration is inversely correlated to the aerobic glycolysis in our models and that the glucose metabolic reprogramming is influenced by HER2 status. Therefore, potential combination strategies with metabolic poisons may be designed based on the different genetic background.
92 Figure 4. HER2 status impacts on glucose-dependent mitochondrial respiration during palbociclib resistance. (A, C, E, G) PDS and PDR cells were subjected to seahorse XFe96 Mito Stress Test analysis and OCR
was measured in real-time and normalized on protein levels. (B, D, F, H) Basal and maximal respiration was calculated as described in Methods, based on the OCR after the administration of the ATP synthase inhibitor oligomycin, the proton uncoupler FCCP, and the respiratory complex I inhibitor rotenone, together with the respiratory complex III inhibitor antimycin A. Each dot represents at least three technical replicates from three biological replicates. Data represent means ± SEM. One-way ANOVA; Dunnett’s corrected; *** p < 0.001; **** p < 0.0001.
93
2.4 Targeting glucose catabolism re-sensitizes ER+/HER2+ palbociclib
resistant cells to the drug
Since our data suggested that the glycolytic pathway could be involved in palbociclib response and resistance, we decided to interfere with glucose catabolism using various approaches. Firstly, we used 2-DG, a compound that is phosphorylated by HK2 but is not further metabolized thus acting as a glycolysis inhibitor. 2-DG slightly affected the survival fraction in HER2- PDR cells with a percentage of 20% compared to untreated resistant cells (Figure 5A). A more pronounced effect was observed in HER2+ PDR derivatives showing a reduction in cell survival fraction after 2-DG administration of 48% in BT474 and 64% in MDA-MB-361 compared to the control (Figure 5A). Similar results have been achieved when cells were cultured in the absence of glucose (Figure 5B) and in a galactose-containing/glucose-deprived medium (Figure 5C), a condition that forces the OXPHOS dependency of the cells [433]. In addition to the pharmacological approach, we confirmed the involvement of glucose catabolism in palbociclib resistance of the HER2+ subset also through the genetic interference. Importantly, HK2 silencing (Figure 5D) significantly impaired cell survival in BT474 (Figure 5E) and MDA-MB-361 (Figure 5F) resistant cells. These results support the hypothesis that glycolysis targeting may re-sensitize HER2+ resistant cells to palbociclib.
94 Figure 5. Targeting glucose catabolism re-sensitizes ER+/HER2+ palbociclib resistant cells to the drug. PDR
cells were either treated for 3 days in the presence of 2-DG (A), in a glucose deprived medium (B) or in a medium in which glucose is replaced by galactose (C). Data are presented as fold change survival fraction of treated versus vehicle treated or basal-cultured cells. Each dot represents at least three technical replicates from three biological replicates. Shades of blue dots are for HER2− PDR cells, shades of red dots for HER2+ PDR cells. Data represent means ± SEM and were compared to vehicle treated or basal-cultured conditions using one-way ANOVA; Dunnett corrected; * p < 0.05; ** p < 0.01; *** p < 0.001; **** p < 0.0001. (D) Total protein lysates from ER+/HER2+ PDR cells transfected with the oligos as described in the figure for 72 h were subjected to western blot analysis, as indicated. (E, F) Survival fraction changes were measured in cells transfected as indicated in the Figure. Each dot represents at least three technical replicates from three biological replicates. Data represent means ± SEM and were compared to non-targeting control siRNA (siCTR) treated cells using Student t test; **** p < 0.0001.
2.5 Targeting glycolysis increases the effect of palbociclib on
ER+/HER2-parental cells
Since the above-described metabolic characterization revealed enhanced glucose capacity also in ER+/HER2- parental cells (Figures 1-3), we hypothesized that glycolysis targeting may be effective in this condition and potentiate the effect of the drug, in the palbociclib sensitive setting. According to our supposition, 2-DG treatment (Figure 6A), glucose deprived medium (Figure 6B), and the replacement of glucose with galactose (Figure 6C) exerted a major effect
95 in impairing the survival fraction of ER+/HER2- parental cells when compared to the HER2+ sensitive counterpart. Based on these observations, we expected that the combination of glycolysis targeting and palbociclib treatment may be more effective than monotherapies. Indeed, 2-DG treatment (Figure 6D,G), glucose deprived medium (Figure 6E,H), and galactose-containing medium (Figure 6F,I) potentiated the impairment of the survival fraction mediated by palbociclib in ER+/HER2- parental cells.
96 Figure 6. Targeting glycolysis increases palbociclib effect on ER+/HER2- parental cells. PDS cells were either
treated for 3 days in the presence of 2-DG (A), in a glucose deprived medium (B) or in a medium in which glucose is replaced by galactose (C). Data are presented as fold change survival fraction of treated versus vehicle treated or basal-cultured cells. Each dot represents at least three technical replicates from three biological replicates. Data represent means ± SEM and were compared to vehicle treated or basal-cultured conditions using one-way ANOVA; Dunnett corrected; * p < 0.05; ** p < 0.01; *** p < 0.001; **** p < 0.0001. ER+/HER2− PDS cells were either treated for 3 days in the presence of 2-DG (D, G), in a glucose deprived medium (E, H) or in a medium in which glucose is replaced by galactose (F, I) either in presence or absence of 1 µM PD. Data are presented as fold change of the survival fraction of treated versus vehicle treated or basal-cultured cells. Each dot represents at least three technical replicates from three biological replicates. Gray shades are used for PDS cells, blue dots when PD is administrated to
97
HER2- PDS cells. Data represent means ± SEM and were compared to vehicle treated or basal-cultured conditions using one-way ANOVA; Dunnett corrected; * p < 0.05; ** p < 0.01; **** p < 0.0001.
2.6 Metabolomic analysis shows a different intracellular metabolite profile
between HER2- and HER2+ palbociclib resistant cells
To assess whether the different metabolic behavior at the time of resistance between HER2- and HER2+ PDR cells resulted in a differential intracellular metabolite composition, we performed a GC-MS analysis that, using the Mass Profiler Profession software and matching the m/z entities of each sample with the Fiehn library, identified around 1.000 metabolites [434]. Unsupervised hierarchical clustering analysis revealed a clear division between HER2- and HER2+ cell lines according to their intracellular differentially regulated metabolites and, within these two subsets, we observed that samples clustered together based on their palbociclib sensitivity or resistance (Figure 7A). These data reinforce the concept that both the genetic background and the drug resistance consistently alter the metabolomic pattern.
To confirm the different glucose dependencies observed in vitro, we monitored the level of G6P, pyruvate, and lactate that are critical intermediates of the glycolytic pathway. Metabolomic analysis revealed that the relative abundance of G6P and lactate decreased in HER2- T47D PDR cells (Figure 7B) while increasing in MDA-MB-361 resistant models (Figure 7C) compared to the sensitive counterpart. An opposite trend was observed in the pyruvate levels that were increased in HER2- PDR (Figure 7B) and reduced in HER2+ PDR cells (Figure 7C) compared to the parental PDS.
These data are in line the prior metabolic characterization and highlight the enhanced glycolytic dependency of the HER2+ PDR cells compared to the resistant derivatives that do not express
98 Figure 7. Metabolomic analysis shows a different intracellular metabolite profile between HER2- and HER2+ palbociclib resistant cells. (A) Unsupervised hierarchical clustering and heat map of the entities derived by the cell lysis, metabolites extraction, and subsequent derivatization before processing to GC–MS from three independent biological replicates of PDS and PDR cell lines. (B, C) Intracellular relative abundance of the following metabolites in ER+/HER2− (B) and in ER+/HER2+ cells (C): G6P, lactate, and pyruvate. * p < 0.05; ** p < 0.01; *** p < 0.001; **** p < 0.0001.
99
2.7 High expression levels of HK2 identify a subset of patients with poor
prognosis
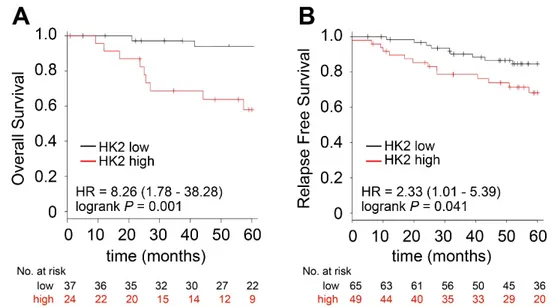
We have previously reported that higher expression of HK2 correlates with worse prognosis in ET treated ER+ breast cancer patients [352]. Finally, to investigate the clinical relevance of our findings we focused on a cohort of ER+/HER2+ breast cancer patients treated with ET since a dataset of patients receiving palbociclib together with the related clinical follow-up were not available. Thus, to assess whether the glucose dependency observed in vitro when resistance occurs in HER2+ models is associated with poor prognosis in ER+/HER2+ patients, we examined the prognostic value of HK2 that is an establish hallmark of glucose metabolism. We found that breast cancers with higher levels of HK2 displayed reduced OS (Figure 8A) and RFS than lowering-expressing tumors (Figure 8B).
Figure 8. High expression levels of HK2 identify a subset of patients with poor prognosis. Kaplan–Meier analysis of OS (A) and RFS (B) of a curated cohort of ER+/HER2+ patients divided into high- and low-expressing, as described in Methods, for HK2 expression. The hazard ratio (HR), interval of confidence and log-rank Mantel–Cox p value are shown.
Importantly, a multivariate cox analysis revealed that the prognostic value of HK2 was independent from ESR1, HER2, and tumor proliferation assessed by MKI67 (Table 1). In summary, our data propose HK2 as a potential metabolic marker of tumor aggressiveness in the ER+/HER2+ subset and suggest a novel potential combination strategy for those patients.
100 Table 1. Multivariate Cox regression analysis (OS, A) and (RFS, B).
3. Discussion
Metabolic reprogramming and deregulation are established hallmarks of cancer. These alterations are not exclusively secondary effects of increased energetic and anabolic demands of the proliferating or invasive tumor cells. Instead, these traits alone are able to support and drive tumor initiation and progression and are associated with enhanced metastatic potential [435], the acquisition of stem-like properties [436], and most recently, therapy resistance [353]. Our experimental model was a previously characterized panel of isogenic ER+ breast cancer cell lines sensitive to palbociclib together with their resistant derivatives [429]. CDK4/6 inhibitors have been approved in combination with ET for the treatment of patients with ER+/HER2- locally advanced or metastatic breast cancer. However, we decided to use cellular models that are resistant only to palbociclib in order to prevent the confounding effect of a combinatorial treatment with ET or HER2 targeted therapy. This approach has already been adopted and generated clinically relevant data recognizing CCNE1 overexpression and Rb loss as genetic alterations involved in palbociclib resistance [195, 221, 429]. In addition, mTOR pathway has been reported to enhance the glycolytic dependency and exert a role in therapy resistance [430]. Thus, the combination of PI3K inhibitors blocking mTOR pathway and CDK4/6 inhibitors may be a potential strategy to improve prognosis and clinical trials are currently in progress [437].
Here we investigate the glucose-dependent metabolic reprogramming that could emerge in response and resistance to palbociclib. It is well known that cancer cells preferentially oxidize glucose to pyruvate that is subsequently fermented to lactate even in presence of oxygen [230, 236], providing energy and building blocks that are fundamental in tumorigenesis and cancer progression. Our data propose a different glucose dependency in palbociclib resistant cells based on their distinct genetic background. Indeed, ER+/HER2- and ER+/HER2+ breast cancer cells differentially depend on aerobic glycolysis when mimicking a sensitive or resistant scenario: ER+/HER2- models display increased glucose exploitation when sensitive;
101 conversely, ER+/HER2+ cell lines are characterized by an enhanced glycolytic catabolism at the time of palbociclib resistance. Accordingly, targeting glycolysis by several approaches is effective in potentiating the anti-tumoral effect of palbociclib in ER+/HER2- parental cells and re-sensitizing ER+/HER2+ resistant cells to the initial therapy.
The rationale for studying the glucose metabolic reprogramming in palbociclib resistance is supported by several observations: (i) the complexes cyclin D1/CDK4 and cyclin D3/CDK6 have been reported to be involved in glucose metabolism [61], (ii) CDK4/6 inhibitors may sustain central carbon metabolism by enhancing mitochondria number and ROS production in pancreatic cancer [430], (iii) the combination of CDK4/6 and autophagy inhibitors has a synergistic effect in Rb positive solid tumors [224].
Our initial and basal characterization based on the results from glucose uptake and GLUT1 gene expression and protein analysis suggested a mechanism of palbociclib resistance commonly shared by all the resistant cell lines showing higher glucose dependency then the sensitive counterparts, independently of HER2 status. However, a more detailed functional metabolic analysis performed by the Seahorse platform revealed a different metabolic behavior between HER2- and HER2+ resistant cells. Indeed, ER+/HER2- resistant cells reduced their glycolytic dependency and in line increased the mitochondrial function both in basal and under metabolic stress condition. Conversely, ER+/HER2+ resistant derivatives were characterized by higher aerobic glycolysis and accordingly impaired respiratory capacity. Thus, the exploitations of glucose through lactic fermentation or oxidative phosphorylation are inversely correlated in our models as monitored by the measurement of ECAR and OCR.
The discrepancy between glucose uptake and Seahorse analysis (i.e., the enhanced glucose intake did not result in enhanced glucose catabolism in the HER2- subset) could be due to the fact that the glucose uploaded may fuel alternative anabolic pathways, for example diverting glycolytic intermediates into PPP, hexosamine and/or serine biosynthetic pathways. In support of this hypothesis, it has been shown that palbociclib acute treatment enhances pentose levels, as a readout of enhanced PPP flux [438] thus providing building blocks necessary for tumor growth and proliferation, and NADPH essential to counteract the oxidative stress caused by exposure to the drug.
The differential metabolic profiles identified have been therapeutically exploited by various approaches: (i) blocking the first rate-limiting step of glycolysis using 2-DG, (ii) culturing cells in a medium deprived from glucose, (iii) replacing glucose with galactose. We found that glycolysis targeting is more effective in the HER2- sensitive setting while can re-sensitize the HER2+ resistant subset to palbociclib. Our data also suggest that targeting oxidative metabolism (e.g., blocking the complexes of the ETC) may be a further interesting investigation that could re-sensitize ER+/HER2- resistant breast cancer to palbociclib. This represents a plausible clinical scenario since palbociclib is currently used only in ER+/HER2- patients.
102 Indeed, CDK4/6 inhibitors are not yet approved for the treatment of ER+/HER2+ breast cancer [160] although preclinical data have proposed the deregulated cyclin D1/CDK4/6/pRb axis as a mechanism of anti-HER2 therapy resistance [439] and showed that breast cancer cells surviving the therapeutic intervention with the EGFR inhibitor lapatinib are characterized by enhanced activation of the cyclin D1/CDK4 complex. Several clinical trials enrolling ER+/HER2+ breast cancer patients are currently evaluating the efficacy and safety of combining palbociclib and anti-HER2 therapies also with the addition of ET [156, 440].
The clinical relevance of our findings is supported by Kaplan-Meier analyses showing that HK2 higher-expressing ER+/HER2+ breast cancer patients are characterized by poor prognosis (i.e., reduced OS and RFS) independently of ESR1, HER2, and tumor proliferation, according to the
in vitro positive correlation between enhanced glycolysis dependency and palbociclib resistance
in the HER2+ subset. To definitively prove HK2 as a predictive biomarker we should validate its role in matched tissue biopsies obtained at diagnosis and at the time of disease progression after therapy.
To conclude, the implications of our study are: (i) glucose catabolism sustains resistance to palbociclib and its targeting is effective in preclinical models; (ii) since glucose metabolism can be monitored by 18F-fluorodeoxyglucose (18F-FDG) PET/CT in patients, understanding the correlation between 18F-FDG PET/CT and palbociclib response may help to monitor therapy response and personalize treatment; (iii) further investigation could help to understand the prognostic role of HK2 and to discover other potential metabolic vulnerabilities involved in palbociclib resistance in order to develop novel therapeutic strategies useful to combat or delay the onset of resistance.