Accepted
Article
This article has been accepted for publication and undergone full peer review but has not been through the copyediting, typesetting, pagination and proofreading process, which may lead to differences between this version and the Version of Record. Please cite this article as doi: 10.1002/1878-0261.12047
Molecular Oncology (2017) © 2017 The Authors. Published by FEBS Press and John Wiley Received Date : 13-Jan-2017
Revised Date : 09-Feb-2017 Accepted Date : 16-Feb-2017 Article type : Research Article
A three-microRNA signature identifies two subtypes of glioblastoma patients with different clinical outcomes
Giovanna Marziali1*, Mariachiara Buccarelli1*, Alessandro Giuliani2, Ramona Ilari1, Sveva Grande3,4, Alessandra Palma3,4, Quintino Giorgio D'Alessandris5, Maurizio Martini6, Mauro Biffoni1, Roberto Pallini5§ and Lucia Ricci-Vitiani1§
1Department of Hematology, Oncology and Molecular Medicine, 2Department of
Environment and Health, 3Department of Technology and Health, Istituto Superiore di Sanità, Rome, Italy; 4Istituto Nazionale di Fisica Nucleare INFN, Rome, Italy; 5Institute of Neurosurgery and 6Institute of Pathology, Università Cattolica del Sacro Cuore, Rome, Italy.
*
These two authors equally contributed to the manuscript.
§
These authors shared senior authorship.
Accepted
Article
Correspondence to: Lucia Ricci-Vitiani (E-mail: [email protected]) and Giovanna Marziali (E-mail: [email protected]), Department of Hematology, Oncology and Molecular Medicine, Istituto Superiore di Sanità, Viale Regina Elena 299, 00161 Rome, Italy.
Keywords: Glioblastoma, Glioblastoma stem-like cells, microRNAs, Patient stratification.
ABSTRACT
Glioblastoma multiforme (GBM) is the most common and malignant primary brain tumor in adults, characterized by aggressive growth, limited response to therapy, and inexorable recurrence. Because of the extremely unfavorable prognosis of GBM, it is important to develop more effective diagnostic and therapeutic strategies based on biologically and clinically relevant patient stratification systems. Analyzing a collection of patient-derived GBM stem-like cells (GSCs) by gene expression profiling, nuclear magnetic resonance (NMR) spectroscopy and signal transduction pathway activation, we identified two GSC clusters characterized by different clinical features. Due to the widely documented role played by microRNAs (miRNAs) in the tumorigenesis process, in this study we explored whether these two GBM patient subtypes could also be discriminated by different miRNA signatures. Global miRNA expression pattern was analyzed by oblique principal component (OPC) analysis and principal component analysis (PCA). By a combined inferential strategy on PCA results, we identified a reduced set of three miRNAs – 23a, 27a and miR-9* (miR-9-3p) – able to discriminate the proneural- and mesenchymal-like GSC phenotypes as well as mesenchymal and proneural subtypes of primary GBM included in The Cancer Genome Atlas (TCGA) dataset. Kaplan-Meier analysis showed a significant correlation between the selected miRNAs and overall survival in 429 GBM specimens from TCGA-identifying patients who had an unfavorable outcome. The survival prognostic capability of
Accepted
Article
the three miRNA signatures could have important implications for the understanding of the biology of GBM subtypes and could be useful in patient stratification to facilitate interpretation of results from clinical trials.
1. INTRODUCTION
Glioblastoma multiforme (GBM) is the most frequent and malignant primary adult brain tumor. Standard GBM treatment includes maximal safe surgical resection followed by combined radiotherapy and chemotherapy with the DNA methylating agent temozolomide (TMZ) (Stupp et al., 2005). Despite continuous improvements in the treatment of GBM during the past decade, these tumors are still associated with a poor prognosis and rare long-term survival (Wen and Kesari, 2008).
Incurable GBM is characterized by uncontrolled cellular proliferation, robust angiogenesis, intense resistance to apoptosis, diffuse infiltration, propensity for necrosis and genomic instability. Moreover, it exhibits a high degree of intra- and inter-tumor heterogeneity (Dunn et al., 2012).
Genomic profiling, chromosomal number variations and abnormalities in DNA methylation have been used to define four subtypes of GBM, that include the pro-neural (oligodendrocytic signature), neural (oligodendrocytic, astrocytic and neural signature), mesenchymal (cultured astroglial signature) and classical (astrocytic signature) subtype (Verhaak et al., 2010).
Increasing evidence has led to the identification of a subpopulation of cells displaying stem-like properties reminiscent of normal stem cells, called tumor-initiating cells or GBM stem-like cells (GSCs), that are believed to play a fundamental role in tumor resistance to chemo- or radiotherapy as well as in tumor recurrence (Singh et al., 2004). GSCs can be
Accepted
Article
tumorigenic ability and are reported to recapitulate the genotype, gene expression patterns and in vivo biology of human GBM more closely than many commonly utilized glioma cell lines (Ernst et al., 2009; Lee et al., 2006). The availability of cell lines that represent a more reliable model for understanding the biology of primary human tumors, may help to identify cues for targeted therapies (Piccirillo et al., 2015).
One of the hallmarks of cancer is the defect in the regulatory circuits that control normal cell proliferation and homeostasis (Hanahan and Weinberg, 2011). Through the ability to regulate a large number of genes, microRNAs (miRNAs), a class of short non-coding RNAs, has been shown to control diverse oncogenic signaling pathways including cell proliferation, cell cycle regulation, apoptosis, invasion, glioma stem cells behavior, and angiogenesis. Dysregulated miRNAs are considered to be essential players in carcinogenesis, and thus potential therapeutic targets (Mizoguchi et al., 2013). Deregulation of miRNAs can affect carcinogenesis if their target mRNAs are encoded by oncogenes or tumor suppressor genes (Lages et al., 2012); overexpression, silencing or switching off specific miRNAs have been described in carcinogenesis of GBM (Brower et al., 2014; Floyd and Purow, 2014; Henriksen et al., 2014). Silencing or down-regulation may result from deletion of a chromosomal region, epigenetic silencing, or defects in their biogenesis whereas increased expression of mature miRNA may occur as a consequence of transcriptional activation or amplification of the miRNA encoding gene.
In the attempt to find druggable signaling pathways, we previously analyzed a collection of nineteen patient-derived GSCs by gene expression profiling, NMR spectroscopy and phosphoproteomic analysis of the signal transduction pathway (Marziali et al., 2016). We identified two GSC clusters, resembling the GSf and GSr groups described by Schulte (Schulte et al., 2011), though with distinct molecular signatures. Based on gene expression, NMR spectroscopy and phosphoproteomic data, we found that the GSf-like and GSr-like
Accepted
Article
clusters are characterized by a "pro-neural-" and "mesenchymal"-like signature, respectively, similar to those described by Verhaak et al. (Verhaak et al., 2010). Significant overlaps with the other two GBM subtypes (i.e. neural and classic) were not observed in our GSC collection. Phosphoproteomic analysis showed that the GSf-like signature is characterized by a significant increase in SRC, Mitogen Activated Protein Kinase (MAPK), and Insulin-like Growth Factor-Receptor (IGF1-R/IR), whereas GSr-like lines displayed increased levels of phosphorylated proteins associated with the mammalian Target of Rapamycin (mTOR) pathway and a strong activation of downstream targets of the Epidermal Growth Factor Receptor (EGFR) (Marziali et al., 2016).
Classifying GBM patients included in The Cancer Genome Atlas (TCGA) based on combined expression patterns of the two RPPA endpoints discriminating GSf- and GSr-like phenotypes (i.e. SRC and RPS6, respectively), we showed that TCGA GBM patients with GSr-like features display a significantly shorter overall survival (Marziali et al., 2016).
To further dissect the molecular biology of GSCs, in the present study we analyzed miRNA expression profile by microarray analysis to identify miRNAs differentially expressed between GSf- and GSr-like sample groups. A reduced set of three miRNAs, able to discriminate GSf- and GSr-like GSC phenotypes as well as mesenchymal and proneural GBM patient subtypes with different clinical outcomes was identified.
2. MATERIALS AND METHODS
2.1. Clinical material and tumor characterization
Glioblastoma samples were harvested from 35 out of 109 consecutive patients who underwent craniotomy at the Institute of Neurosurgery, Catholic University of Rome. All patients provided written informed consent according to research proposals approved by the Institutional Ethical Committee. Clinical and pathological features are summarized in
Accepted
Article
were men and 9 were women. The expression of the proliferation marker Ki67, PTEN, Vascular Endothelial Growth Factor (VEGF) and EGFRvIII were characterized on tumor specimens by immunohistochemistry on deparaffinized sections as previously described (Martini et al., 2013; Martini et al., 2008; Montano et al., 2011; Pallini et al., 2008). MGMT promoter methylation patterns by methylation-specific PCR and isocitrate dehydrogenase (IDH)1/2 mutation state were assessed on genomic DNA extracted from paraffin-embedded tissue as previously described (Horbinski et al., 2009; Pallini et al., 2008). OS was calculated from the date of surgery where a diagnosis of GBM was established, to death. PFS was determined from the date of surgery until progression or death (Wen et al., 2010). After surgery, the patients received radiotherapy and concomitant TMZ followed by six cycles of adjuvant TMZ according to the Stupp protocol (Stupp et al., 2005; Wen et al., 2010).
Cox analysis was used for hazard ratio and 95% confidence interval determination. All p-values are based on two-tailed tests and differences were considered significant when p<0.05. StatView ver5.0 was used (SAS Institute, Cary, NC).
2.2. Glioblastoma stem-like cell cultures
GSCs were isolated through mechanical dissociation of the tumor tissue and cultured in a serum-free medium supplemented with epidermal growth factor (EGF) and basic fibroblast growth factor (bFGF) as previously described (Pallini et al., 2008). Cell lines actively proliferating required 3 to 4 weeks to be established. In these conditions, cells grow as clusters of undifferentiated cells, as indicated by morphology and expression of stem cell markers such as CD133 and SOX2 (Supplementary Table S2). Stem cell marker expression was assessed by flow cytometry using a Canto analyzer (Becton Dickinson, Milan, Italy) using AC133-PE antibody (Miltenyi Biotec, Bologna, Italy) and PerCP-CyTM 5.5 mouse anti-Sox2 (BD, Becton Dickinson, Milan, Italy) for CD133 and anti-Sox2, respectively. Viable cells were identified using 7-amino actinomycin D (7AAD; Sigma Aldrich, St. Louis, MO). To
Accepted
Article
assess clonogenicity, viable cells were dispensed at different densities (1-3-10 cells/well) in 96 well plates by cell sorting (FACS Aria, Becton Dickinson) (Supplementary Table S2). After 10-14 days, wells with growing clones were enumerated, and results were analysed by Extreme Limiting Dilution Assay (ELDA) software (Hu and Smyth, 2009). The in vivo tumorigenic potential of GBM neurospheres was assayed by intracranial or subcutaneous cell injection in immunocompromised mice in 30 out of 37 GSC lines. GBM neurospheres were able to generate a tumor identical to the human tumor in antigen expression and histological tissue organization. GSC lines were validated by Short Tandem Repeat (STR) DNA fingerprinting as previously described (Lulli et al., 2015).
2.3. Microarrays and Real-Time PCR
To analyze GSC miRNA expression total RNA was prepared using TRIzol Reagent (Invitrogen Life Technologies, Carlsbad, CA, USA). RNA was labeled and hybridized to the Agilent-019118 array following the manufacturer's instructions. Microarray analysis was performed as previously described (Felli et al., 2010).
For Real-time PCR, fifty nanograms of RNA were reverse transcribed with TaqMan MicroRNA Reverse Transcription Kit (Applied Biosystems, Carlsbad, CA, USA). Real-time PCR for miR-23a-3p (miRBase ID MIMAT0000078), miR-27a-3p (miRBase ID MIMAT0000084) and miR-9-3p (miRBase ID MIMAT0000442), were performed using TaqMan® MicroRNA Assays protocol (assay ID 000399, ID 000408, ID 002231, Applied Biosystems). All reactions were run in duplicate. Normalization was performed by using RNU6B primer kit (ID 001093, Applied Biosystems). RT-PCR was performed using an ABI Prism 7900 Sequence Detector (Applied Biosystems).
Accepted
Article
2.4. Statistical Methods
In order to single out an effective miRNA signature for the GSf/GSr discrimination we applied a four-step strategy:
i) clustering of the variables (miRNA expression profiles) by means of Oblique Principal Component Analysis (OPC) to single out (if any) a profile partition consistent with the GSf/GSr classification. OPC (Sethi, 1971) is a divisive clustering that partitions the variables of a data set into maximally internally correlated clusters. The partition stops when the ratio: intra-cluster/inter-cluster correlation reaches a maximum. If this purely data-driven partition matches the GSf/GSr a priori classification we have a proof-of-concept of the discrimination of the two sub-types in the miRNA space; ii) application of Principal Component Analysis (PCA) on the data set having miRNA as statistical units and samples (miRNA profiles) as variables. The seven miRNAs endowed with the highest scores on the a posteriori emerging discriminant component were selected. This data-driven strategy allows for the elimination of overfitting problems (Napoletani et al., 2010) by concentrating on a purely unsupervised selection of miRNAs. After this step, we further refined our choice by the computation of (iii) mutual Pearson correlations between selected miRNAs on a transposed (statistical units = cell lines, variables = selected miRNA species) subset of the original data matrix to eliminate redundant miRNA species (only one of strongly correlated pairs selected on the basis of their statistical significance as for GSf/GSr classification).
The last step (iv) was the application of Linear Discriminant Analysis (LDA) based on the three miRNA species previously selected on independent data sets so to check their classification ability at both statistical (training set) and predictive (test set) levels.
Accepted
Article
3. RESULTS
3.1. Multidimensional analysis of GSf- and GSr-like miRNA profiles
Analyzing a collection of nineteen GSC lines derived from seventeen GBM patients (from two of these, GSC lines from different tumor regions were isolated), by complementary molecular approaches, we recently identified two GSC clusters: one characterized by a proneural-like phenotype (GSf-like) and the other showing a mesenchymal-like phenotype (GSr-like) (Marziali et al., 2016).
To further examine the molecular biology of our GSC lines we analyzed mature miRNA expression using a microarray platform. Following background subtraction and quartile normalization, the global miRNA expression pattern was analyzed by oblique principal component analysis (OPC), a divisive variable clustering technique (Sethi, 1971). This analysis gave rise to a two cluster optimal solution (Table 1) that exactly mirrors the a priori GSf-/GSr-like classification except for line GSC#83.2. It is worth noting that, being OPC a completely unsupervised procedure and the GSf-/GSr-like label added a posteriori, the classification does not suffer from overfitting problems. The misclassified line (shown in italics in Table 1) lies on the border between the two clusters having an R-square with its own cluster (Own Cluster R-square = 0.79) of the same order of magnitude of the R-square with the other class (R-square = 0.72). The two cluster partition explains the 84.6% of total variance (Proportion of variance Explained, bolded in the Table 1) while, considering all the samples as part of the same group (one cluster solution), it accounts for 82.5% of total information. Thus, all the samples, besides their GSf-/GSr-like character, are largely invariant, pointing to a shared ideal miRNA profile characteristic of the tissue.
Having verified the ability of the entire miRNA profile to correctly discriminate the two GBM subtypes we checked for the existence of a single score able to select the best linear combination of miRNA species endowed with such discriminant ability. We faced this
Accepted
Article
task by analyzing the same data set by a Principal Component Analysis (PCA) which allows for the projection of the initial 19 dimensions data set into a reduced space spanned by mutually independent axes (principal components) explaining the relevant (signal-like) part of total variance of the system. Differently from OPC that partitions the variables into disjoint sets, PCA is a spectral method (Preisendorfer et al., 1988) and this implies that each miRNA species has a score relative to each component while, at the same time, each sample has a peculiar correlation (loading) with all the extracted components.
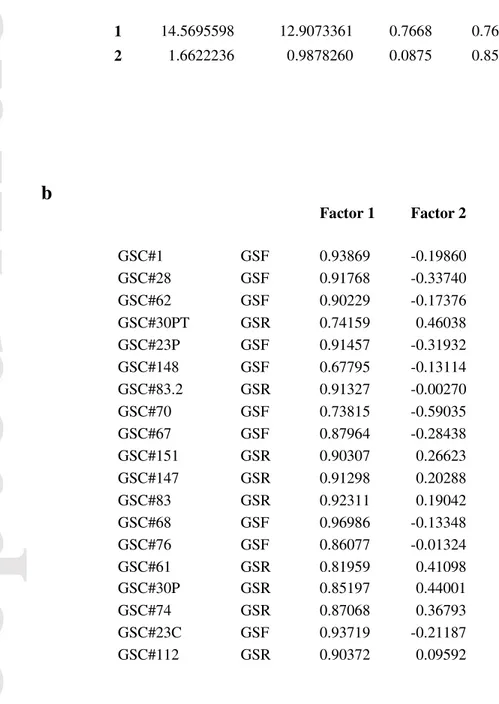
PCA showed a clear clustering of GSC cell lines and confirmed separation between GSf- and GSr-like samples (Figure 1, top panel). PCA suggests a two-component solution as a bona fide reliable reconstruction of the 19 sample space. The percent of variation explained by the first two components (Factor 1, Factor 2) is reported in Table 2a. The first component (Factor 1) explains the far major part of system variation (77% of total variance explained), while the second accounts for 8.5% of total variance. Globally the two-component solution accounts for 85% of total information. Pearson correlation coefficients of the original variables (samples) with the extracted components constitute the factor-loading pattern (Table 2b) and allow to assign a meaning to the Factors.
Factor 1 is a ‘size’ component (Jolicoeur and Mosimann, 1960): all the samples have values close to unity loadings, in line with the existence of a ‘common miRNA ideal profile’ shared by all the samples, possibly due to the common tissue origin. Factor 2 is a ‘shape’ component mirroring the ‘GSf-/GSr-like’ axis: all the GSf-like samples have negative loadings with Factor 2 while GSr-like loadings are positive. Thus, miRNAs with high scores on Factor 2 point to the GSr-like phenotype whereas miRNAs with low scores identify the GSf-like subtype. Results of PCA for both samples (loading space) and miRNAs (score space) are shown in Figure 1.
Accepted
Article
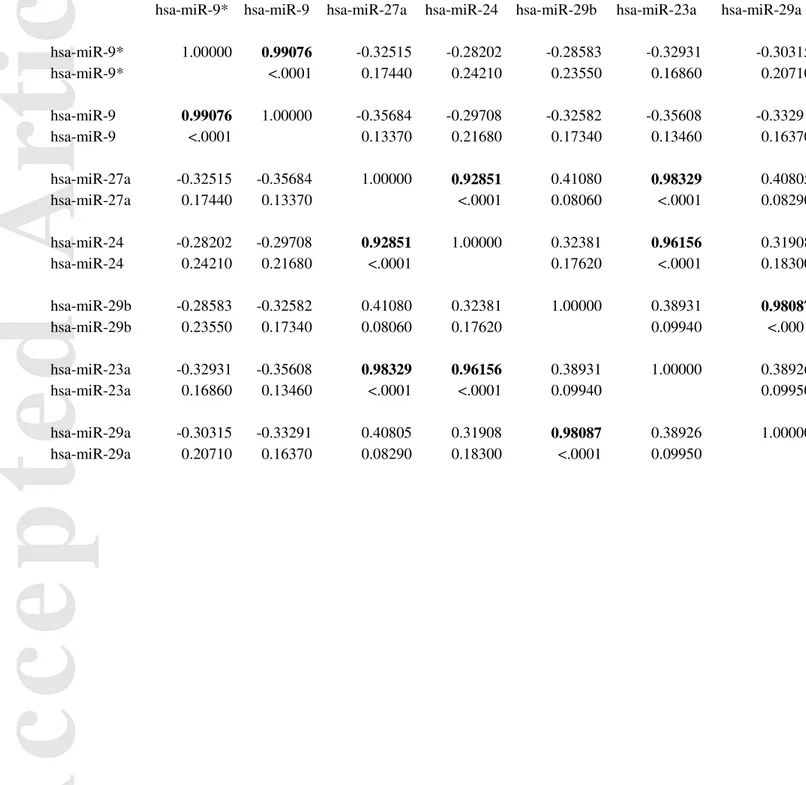
3.2. A set of three miRNAs discriminates between GSf- and GSr-like GSC subtypes Focusing on miRNAs endowed with the maximal relevance of the discriminating component (Factor 2), we established a threshold (Figure 1, bottom panel) corresponding to a score > 5 in absolute value to set a reduced signature. Since principal components have by construction zero mean and unit standard deviation, they correspond to z-scores, thus a threshold of 5 corresponds to a p < 0.00001 as far as the influence of Factor 2 (i.e. the discriminating component) on the selected miRNA species is concerned. Seven miRNAs species emerged from the application of the above threshold. The Pearson correlation coefficients between these seven miRNA species were computed to eliminate redundant miRNAs (two miRNAs having near to unity correlation need not be both inserted in the signature, given they carry largely redundant information). Table 3 reports the miRNAs correlation matrix (bolded near to unity correlations). Correlations near to unity correspond to miRNAs already known to be structurally related (mature sequences of miR-23a, miR-27a, miR-24-2 derived from a common pri-miRNA transcript encoded by miR-23a/miR27a/miR-24-2 cluster on chromosome 19, miR-9 and miR-9* originate from the opposite strand of the same precursor) (Liang et al., 2014). As expected, a statistically significant difference between the two groups was observed for all the seven miRNAs.
In order to select, for each redundant pair, the ‘best representative’ species, miRNAs were ordered in terms of their t-test statistics values (Table 4) and those with higher t-value were chosen (bolded in Table 4). At the end of this procedure a 3 miRNA signature (miR-23a, miR-27a and miR-9*), able to correctly cluster 18 out of 19 GSC lines collection in two subtypes emerged (Table 5).
To check the generalization ability of the selected signature, we analyzed the expression levels of miR-23a, miR-27a and miR-9* (now identified as miR-9-3p, www.mirbase.org) in both our sample set and in 18 newly established GSC lines by real-time
Accepted
Article
polymerase chain reaction (RT-PCR) (Supplementary Table S3), reaching a total of 37 GSC lines analyzed.
All the discriminant analyses were performed establishing a training set of 16 out of 19 samples of known phenotype (7 GSr-like, 9 GSf-like). This set was selected to build the linear discriminant function, which in turn was used for predicting an independent test set (n=21; i.e. the 18 new GSC and the 3 remaining GSC lines previously analyzed). All the analyses made use of the same signature. Each discriminant analysis is reported in terms of its performance on both training and test sets by means of the relative confusion matrixes (Table 6). This analysis identified 7 out of 21 GSC lines as GSr-like subtype and the remaining as GSf-like subtype.
To confirm the predictive potential of the three miRNAs to discriminate between GSf- and GSr-like subtypes, the metabolite profiles of the 18 newly established GSC lines were analyzed by 1H NMR spectroscopy. We previously demonstrated that the GSf- and GSr-like clusters are differentiated by NMR spectroscopy profiles: the GSf-like, characterized by metabolites involved in the production of neurotransmitters such as NAA and GABA, with a prevalent neuronal metabolism; the GSr-like, characterized by lack of NAA and GABA and by high lipids, indicative of a prevalent astroglial-like metabolism (Marziali et al., 2016). Unsupervised cluster analysis on all GSC lines clearly separated the samples in the two clusters (Figure 2). According to NMR classification, the three miRNA signature was able to correctly clusterize 20 out of 21 samples belonging to the test set confirming the reliability of the miRNA signature in classifying GSC subtypes (Table 6 and Figure 2).
3.3. Patient clinical features and the three miRNA signature
Univariate analysis in all our patient cohort (n=35), showed that post-operative Karnofsky Performance Status (KPS) (<70 vs > 70), O6-methylguanine-DNA
Accepted
Article
methyltransferase (MGMT) promoter methylation, and Phosphatase and Tensin Homolog (PTEN) expression were significantly associated with Overall Survival (OS) (p=0.0092, p=0.0167, and p=0.0284, respectively; log rank test; Supplementary Table S4). Post-operative KPS>70, MGMT promoter methylation, and PTEN expression showed prognostic value also for Progression Free Survival (PFS) (p=0.0214, p=0.0440, and p=0.0485, respectively; log rank test; Supplementary Table S4). To analyze possible association of miRNA signature with clinical and pathological parameters of the donor patients, we distinguished GBMs that generated GSf-like cells (Group A, n=22) from those generating GSr-like cells (Group B, n=13) (Supplementary Table S5). Patients of group A and group B were homogeneous for the clinical and molecular features that hold prognostic value, such as age, extent of tumor resection, KPS, and MGMT methylation (Supplementary Table S1). As previously described (Marziali et al., 2016), EGFRvIII expression was more frequent in tumors generating GSr-like cultures than in those generating GSf-like cultures. There were no significant differences in OS and PFS between GSf- and GSr-like generating tumors (median OS=9 and 8 months, median PFS=5 and 4 months, p=0.5593 and 0.4921, respectively; log-rank test; Supplementary Table S5).
3.4. The three miRNA signature discriminates between Proneural and Mesenchymal subtypes in the TCGA cohort
Taking into account the potential bias of information obtained from our limited GSC samples, we tested the reliability of the signature in classifying GBM patients from completely independent sources such as the large cohort of GBM patients from TCGA. Thus, we explored the expression of miR-23a, miR-27a and miR-9-3p by using the Glioblastoma Bio Discovery Portal (GBM-BioDP software platform, http://gbm-biodp.nci.nih.gov). miRNA expression data were available for 429 patients, classified into the four subtypes:
Accepted
Article
proneural (P), neural (N), classical (C) and mesenchymal (M), as described by Verhaak and colleagues (Verhaak et al., 2010). As previously reported (Marziali et al., 2016), the GSf-like and GSr-like clusters are characterized by a “proneural” and a “mesenchymal-like” expression signature, respectively. Thus, we selected P (97 patients) and M (108 patients) from the 429 patients of the TCGA database and we performed the discriminant analyses according to the same scheme used for the 37 GSC lines described above. We defined a training set of 129 out of 205 patients of known subtype (70 M and 59 P) to build the linear discriminant function, which in turn was used for predicting an independent test set (n=76). As shown in Table 7, the analysis was able to correctly classify 30 out of 38 M patients and 31 out of 38 P patients confirming the high predictive potential of the three miRNA signature.
To further validate the ability of miR-23a, miR-27a and miR-9-3p in discriminating between M and P GBM subtypes in the cohort of TCGA patients the GBM-BioDP software platform was used (Celiku et al., 2014). We found that both miR-23a and 27a were significantly higher in the M versus P subtype whereas miR-9-3p expression was significantly higher in the P versus M subtype confirming a role for these three miRNAs in patient stratification (Figure 3A). Similarly, using miR-23a, miR-27a and miR-9-3p expression levels of our collection of GSC lines, we found that miR-9-3p expression was significantly higher in the GSf- versus GSr-like subtype whereas, both miR-23a and miR-27a were significantly higher in GSr- versus GSf-like subtype (Figure 3B), confirming the “proneural” and “mesenchymal-like” expression signature of the GSC subtype, respectively.
3.5. The three miRNA signature identifies two subtypes with different prognosis in the TCGA cohort of GBM patients
In order to investigate the prognostic value of the three miRNA signature we evaluated whether miRNA-based classification correlated with clinical outcomes of the TCGA patients.
Accepted
Article
We initially classified the patients categorized as M and P subtypes, according to Verhaak’s criteria, for which survival data were available (n=169 out of 205). As shown in Figure 4A, the prognoses of the patients classified as GSr-like, were significantly worse than those classified as GSf-like (p=0.0032). Then, to assess the generalized power of the three miRNA based classification for predicting patient clinical outcome, we analyzed the whole cohort of TCGA patients, for which survival and miRNA expression data were available (n=429), irrespective of the Verhaak subtype classification. A training set of 177 patients of known subtype (i.e. 93 M and 84 P) was defined to build the linear discriminant function used to classify the remaining 252 patients (independent test set). TCGA patients identified as C subtype were equally distributed between GSf- and GSr-like subgroups whereas, the majority (2:1) of the N patients gathered in the GSf-like subtype. This analysis classified 121 patients as GSf-like and 131 as GSr-like subtypes. Kaplan-Meier survival analysis (Figure 4B) revealed that the prognoses of patients classified as GSr-like were significantly worse than those classified as GSf-like (p=0.042), indicating the three miRNA signature is significantly associated with survival.
3.6. Genes involved in cancer and neurodegenerative pathways are the preferential targets of the three miRNA signature.
To explore the possible biological impact of miR-23a, miR-27a and miR-9-3p in GBM, we derived the potential target genes from GB-BioD. The lists of mRNAs correlating with selected miRNAs were then analyzed for pathway enrichment analysis by using the Kyoto Encyclopedia of Genes and Genomes (KEGG) present in MSigDB (GSEA online tool; http://www.broadinstitute.org/gsea/index.jsp). We found that the most significantly enriched pathways were related to cancer, apoptosis or focal adhesion. Interestingly, a significant association with pathways involved in neurodegenerative disease emerged, suggesting that
Accepted
Article
these three miRNAs may be associated to major neurodegenerative disorders such as Alzheimer’s and Parkinson’s diseases in addition to brain malignancies (Figure 5 and Supplemantary Table S6).
4. DISCUSSION
The identification of the key cellular pathways targeted by mutation during tumor progression is a high priority aim in cancer research. Using global gene expression profiling, several research groups have categorized GBM into distinct subtypes. The proneural (P) and mesenchymal (M) subtypes have been identified as representative classifiers and reported to have both prognostic and predictive value (Colman et al., 2010; Freije et al., 2004; Li et al., 2009; Phillips et al., 2006; Verhaak et al., 2010).
To date, classification of GBMs has not become part of clinical practice due mainly to the absence of a direct implication in the selection of a more appropriate therapy. However, identifying novel genetic signatures to gain better insights into the biology of cancers may help to develop novel therapies in the direction of precision medicine.
Several studies have reported miRNA profiles in GBM, highlighting the role of miRNAs in the progression of this disease and suggesting that miRNA signatures may be prognostic indicators of GBM and thus potentially, predict clinical outcome (Barbano et al., 2014; Fowler et al., 2011; Guan et al., 2015; Kim et al., 2011; Kouri et al., 2015; Lakomy et al., 2011; Pang et al., 2015; Zhang et al., 2016).
Here, we performed miRNA expression profiling of a collection of patients-derived GSC culture and identified a three miRNA signature (miR-23a–3p, miR-27a-3p and miR-9-3p) able to classify the cohort of TCGA GBM patients in two subgroups with significantly different overall survival.
Accepted
Article
In agreement with previous data, the expression of these three miRNAs is significantly altered in GBM compared with normal brain tissues (Rao et al., 2010; Visani et al., 2014).
The TCGA GBM dataset showed decreased miR-9-3p and increased miR-23a and miR-27a expression preferentially in GBMs with a mesenchymal expression signature associated with a more invasive and aggressive behavior (Phillips et al., 2006). The same expression trends of these miRNAs were confirmed in our GSC samples.
Mature sequences of miR-23a, miR-27a, miR-24-2 derived from a common pri-miRNA transcript encoded by mir-23a/mir-27a/mir-24-2 cluster on chromosome 19 (Liang et al., 2014).
Several studies have shown that miR-23a is involved in the development and progression of multiple types of cancers, such as gastrointestinal, colorectal, esophageal squamous cell, and lung cancer (Chhabra et al., 2010). Recently, the up-regulation of miR-23a was found to be associated with glioma. It has been reported that miR-miR-23a acts as a key modulator in CREB/PTEN regulated gliomagenesis (Tan et al., 2012). Moreover it promotes glioma cell proliferation via regulation of MXI1 (Xu et al., 2013), glioma cell invasion by inhibiting the expression of HOXD10 (Hu et al., 2013) and cell growth via targeting apoptotic protease activating factor-1 (APAF1) (Lian et al., 2013).
The oncogenic role of miR-27a has been confirmed by several experimental studies. miR-27a was significantly up-regulated in renal cell carcinoma (Nakata et al., 2015), in esophageal cancer (Wu et al., 2015), in gastric adenocarcinoma (Liu et al., 2009) and in breast cancer (Mertens-Talcott et al., 2007). miR-27a also contributes to oncogenesis by regulating cell cycle progression (Tian et al., 2014). It has recently been shown that miR-27a is overexpressed both in human glioma samples and cell lines (Yang et al., 2012).
Accepted
Article
MiR-9, found to be highly expressed in the brain of vertebrates, has been demonstrated to play a role in the development of the nervous system, regulating key genes in neurodevelopment by synergizing with its complementary miR-9* (Schraivogel et al., 2011; Yoo et al., 2009). Both miRNAs may be important GBM mediators via regulation of multiple distinct signaling pathways and resistance to chemotherapy. Importantly, it has been reported that miR-9 operate as a switch that regulates oligoneural versus mesenchymal decisions by suppressing mesenchymal differentiation through downregulation of JAK/STAT pathway (Kim et al., 2011). The same study also identified others miRNAs contributing to the phenotypic diversity of GBM subtypes indicating that miRNAs may be useful for GBM classication allowing for the development of molecular-treatment decisions and more accurate prognosis(Kim et al., 2011).
Recently, the EGFRvIII/Ras/PI3K/AKT axis has been shown to exert its tumorigenic influence through the specific inhibition of miR-9 leading to the upregulation of the transcription factor FOXP1 thus providing a tumor growth advantage to EGFRvIII-driven tumors (Gomez et al., 2014).Interestingly, among the molecular variables characterizing our GSC collection, EGFRvIII expression was significantly more frequent in tumors generating GSr-like cultures than in those generating GSf-like cultures. However, the median overall survival of the donor patients that generated GSr-like cultures compared with that of the patients generating GSf-like cultures was not significantly different. The lack of correlation with clinical outcome in our patients can be ascribed both to the small number of patients included in the study and to limiting factors related to GSC isolation: GSC cultures were obtained from only one third of the tumors. This implies that the GSC paradigm cannot be applied in a substantial fraction of patients suffering from GBM but mainly to more aggressive cases, since median overall and progression free survival were significantly shorter in tumors that generated GSC cultures compared with those that did not (Pallini et al.,
Accepted
Article
2008).
Altogether these data reinforce the concept that miRNAs are important actors in GBM carcinogenesis, and thus potential therapeutic targets.
5. CONCLUSIONS
A three miRNA signature able to discriminate GSf- and GSr-like GSC phenotypes as well as, mesenchymal and proneural GBM patient subtypes was identified, confirming that miRNAs can be considered biomarkers for patient stratification. Even though clinical application of miRNAs either as potential therapeutics, targets or biomarkers is still at the initial phase of development, several ongoing studies are investigating the predictive value of single or multiple miRNA levels in oncology. The three miRNA signature grouping TCGA patients in two different classes with significant survival differences may bea promisingprognostic tool that can improve the predictability of tumor aggressiveness. Thus, new knowledge about miRNAs in cancer has the potential to indicate new ways to stratify diseases and tailor an appropriate therapy to specific GBM patient subsets.
ACKNOWLEDGEMENTS
The authors wish to thank Dr Gabriele De Luca for technical assistance and Dr Tonino Sofia for critically revise the manuscript.
Authors' contributions
LRV and GM conceived the study and wrote the manuscript; MBu performed experiments and analyzed data; RI performed experiments; AG performed statistical analysis; SG and AP performed NMR experiments; QGD'A provided samples; MM analyzed clinical data; MBi analyzed data and wrote the paper; RP provided and analyzed clinical data and wrote the
Accepted
Article
GRANT SUPPORT
This work was supported by grant from Associazione Italiana per la Ricerca sul Cancro, AIRC (IG 2013 14574 to RP, Start-up 6326 and IG 2014 15584 to LRV).
CONFLICTS OF INTEREST
All authors disclosed no conflicts of interest.
REFERENCES
Barbano, R., Palumbo, O., Pasculli, B., Galasso, M., Volinia, S., D'Angelo, V., Icolaro, N., Coco, M., Dimitri, L., Graziano, P., Copetti, M., Valori, V.M., Maiello, E., Carella, M., Fazio, V.M., Parrella, P., 2014. A miRNA signature for defining aggressive phenotype and prognosis in gliomas. PloS one 9, e108950.
Brower, J.V., Clark, P.A., Lyon, W., Kuo, J.S., 2014. MicroRNAs in cancer: glioblastoma and glioblastoma cancer stem cells. Neurochemistry international 77, 68-77.
Celiku, O., Johnson, S., Zhao, S., Camphausen, K., Shankavaram, U., 2014. Visualizing molecular profiles of glioblastoma with GBM-BioDP. PloS one 9, e101239.
Chhabra, R., Dubey, R., Saini, N., 2010. Cooperative and individualistic functions of the microRNAs in the miR-23a~27a~24-2 cluster and its implication in human diseases. Molecular cancer 9, 232.
Colman, H., Zhang, L., Sulman, E.P., McDonald, J.M., Shooshtari, N.L., Rivera, A., Popoff, S., Nutt, C.L., Louis, D.N., Cairncross, J.G., Gilbert, M.R., Phillips, H.S., Mehta, M.P., Chakravarti, A., Pelloski, C.E., Bhat, K., Feuerstein, B.G., Jenkins, R.B., Aldape, K., 2010. A multigene predictor of outcome in glioblastoma. Neuro-oncology 12, 49-57.
Dunn, G.P., Rinne, M.L., Wykosky, J., Genovese, G., Quayle, S.N., Dunn, I.F., Agarwalla, P.K., Chheda, M.G., Campos, B., Wang, A., Brennan, C., Ligon, K.L., Furnari, F., Cavenee, W.K., Depinho, R.A., Chin, L., Hahn, W.C., 2012. Emerging insights into the molecular and cellular basis of glioblastoma. Genes & development 26, 756-784.
Ernst, A., Hofmann, S., Ahmadi, R., Becker, N., Korshunov, A., Engel, F., Hartmann, C., Felsberg, J., Sabel, M., Peterziel, H., Durchdewald, M., Hess, J., Barbus, S., Campos, B., Starzinski-Powitz, A., Unterberg, A., Reifenberger, G., Lichter, P., Herold-Mende, C., Radlwimmer, B., 2009. Genomic and expression profiling of glioblastoma stem cell-like spheroid cultures identifies novel tumor-relevant genes associated with survival. Clinical cancer research : an official journal of the American Association for Cancer Research 15, 6541-6550.
Felli, N., Cianetti, L., Pelosi, E., Care, A., Liu, C.G., Calin, G.A., Rossi, S., Peschle, C., Marziali, G., Giuliani, A., 2010. Hematopoietic differentiation: a coordinated dynamical process towards attractor stable states. BMC systems biology 4, 85.
Accepted
Article
Floyd, D., Purow, B., 2014. Micro-masters of glioblastoma biology and therapy: increasingly recognized roles for microRNAs. Neuro-oncology 16, 622-627.
Fowler, A., Thomson, D., Giles, K., Maleki, S., Mreich, E., Wheeler, H., Leedman, P., Biggs, M., Cook, R., Little, N., Robinson, B., McDonald, K., 2011. miR-124a is frequently down-regulated in glioblastoma and is involved in migration and invasion. European journal of cancer 47, 953-963.
Freije, W.A., Castro-Vargas, F.E., Fang, Z., Horvath, S., Cloughesy, T., Liau, L.M., Mischel, P.S., Nelson, S.F., 2004. Gene expression profiling of gliomas strongly predicts survival. Cancer research 64, 6503-6510.
Gomez, G.G., Volinia, S., Croce, C.M., Zanca, C., Li, M., Emnett, R., Gutmann, D.H., Brennan, C.W., Furnari, F.B., Cavenee, W.K., 2014. Suppression of microRNA-9 by mutant EGFR signaling upregulates FOXP1 to enhance glioblastoma tumorigenicity. Cancer research 74, 1429-1439.
Guan, Y., Chen, L., Bao, Y., Li, Z., Cui, R., Li, G., Wang, Y., 2015. Identification of low miR-105 expression as a novel poor prognostic predictor for human glioma. International journal of clinical and experimental medicine 8, 10855-10864.
Hanahan, D., Weinberg, R.A., 2011. Hallmarks of cancer: the next generation. Cell 144, 646-674.
Henriksen, M., Johnsen, K.B., Andersen, H.H., Pilgaard, L., Duroux, M., 2014. MicroRNA expression signatures determine prognosis and survival in glioblastoma multiforme--a systematic overview. Molecular neurobiology 50, 896-913.
Horbinski, C., Kofler, J., Kelly, L.M., Murdoch, G.H., Nikiforova, M.N., 2009. Diagnostic use of IDH1/2 mutation analysis in routine clinical testing of formalin-fixed, paraffin-embedded glioma tissues. Journal of neuropathology and experimental neurology 68, 1319-1325.
Hu, X., Chen, D., Cui, Y., Li, Z., Huang, J., 2013. Targeting microRNA-23a to inhibit glioma cell invasion via HOXD10. Scientific reports 3, 3423.
Hu, Y., Smyth, G.K., 2009. ELDA: extreme limiting dilution analysis for comparing depleted and enriched populations in stem cell and other assays. Journal of immunological methods 347, 70-78.
Jolicoeur, P., Mosimann, J.E., 1960. Size and shape variation in the painted turtle. A principal component analysis. Growth 24, 339-354.
Kim, T.M., Huang, W., Park, R., Park, P.J., Johnson, M.D., 2011. A developmental taxonomy of glioblastoma defined and maintained by MicroRNAs. Cancer research 71, 3387-3399.
Kouri, F.M., Ritner, C., Stegh, A.H., 2015. miRNA-182 and the regulation of the glioblastoma phenotype - toward miRNA-based precision therapeutics. Cell cycle 14, 3794-3800.
Lages, E., Ipas, H., Guttin, A., Nesr, H., Berger, F., Issartel, J.P., 2012. MicroRNAs: molecular features and role in cancer. Frontiers in bioscience 17, 2508-2540.
Lakomy, R., Sana, J., Hankeova, S., Fadrus, P., Kren, L., Lzicarova, E., Svoboda, M., Dolezelova, H., Smrcka, M., Vyzula, R., Michalek, J., Hajduch, M., Slaby, O., 2011. MiR-195, miR-196b, miR-181c, miR-21 expression levels and O-6-methylguanine-DNA methyltransferase methylation status are associated with clinical outcome in glioblastoma patients. Cancer science 102, 2186-2190.
Lee, J., Kotliarova, S., Kotliarov, Y., Li, A., Su, Q., Donin, N.M., Pastorino, S., Purow, B.W., Christopher, N., Zhang, W., Park, J.K., Fine, H.A., 2006. Tumor stem cells derived from glioblastomas cultured in bFGF and EGF more closely mirror the phenotype and genotype of primary tumors than do serum-cultured cell lines. Cancer cell 9, 391-403.
Li, A., Walling, J., Ahn, S., Kotliarov, Y., Su, Q., Quezado, M., Oberholtzer, J.C., Park, J., Zenklusen, J.C., Fine, H.A., 2009. Unsupervised analysis of transcriptomic profiles reveals six glioma subtypes. Cancer research 69, 2091-2099.
Accepted
Article
Lian, S., Shi, R., Bai, T., Liu, Y., Miao, W., Wang, H., Liu, X., Fan, Y., 2013. Anti-miRNA-23a oligonucleotide suppresses glioma cells growth by targeting apoptotic protease activating factor-1. Current pharmaceutical design 19, 6382-6389.
Liang, T., Yu, J., Liu, C., Guo, L., 2014. An exploration of evolution, maturation, expression and function relationships in mir-23 approximately 27 approximately 24 cluster. PloS one 9, e106223.
Liu, T., Tang, H., Lang, Y., Liu, M., Li, X., 2009. MicroRNA-27a functions as an oncogene in gastric adenocarcinoma by targeting prohibitin. Cancer letters 273, 233-242.
Lulli, V., Buccarelli, M., Martini, M., Signore, M., Biffoni, M., Giannetti, S., Morgante, L., Marziali, G., Ilari, R., Pagliuca, A., Larocca, L.M., De Maria, R., Pallini, R., Ricci-Vitiani, L., 2015. miR-135b suppresses tumorigenesis in glioblastoma stem-like cells impairing proliferation, migration and self-renewal. Oncotarget 6, 37241-37256.
Martini, M., Cenci, T., D'Alessandris, G.Q., Cesarini, V., Cocomazzi, A., Ricci-Vitiani, L., De Maria, R., Pallini, R., Larocca, L.M., 2013. Epigenetic silencing of Id4 identifies a glioblastoma subgroup with a better prognosis as a consequence of an inhibition of angiogenesis. Cancer 119, 1004-1012.
Martini, M., Pallini, R., Luongo, G., Cenci, T., Lucantoni, C., Larocca, L.M., 2008. Prognostic relevance of SOCS3 hypermethylation in patients with glioblastoma multiforme. International journal of cancer 123, 2955-2960.
Marziali, G., Signore, M., Buccarelli, M., Grande, S., Palma, A., Biffoni, M., Rosi, A., D'Alessandris, Q.G., Martini, M., Larocca, L.M., De Maria, R., Pallini, R., Ricci-Vitiani, L., 2016. Metabolic/Proteomic Signature Defines Two Glioblastoma Subtypes With Different Clinical Outcome. Scientific reports 6, 21557.
Mertens-Talcott, S.U., Chintharlapalli, S., Li, X., Safe, S., 2007. The oncogenic microRNA-27a targets genes that regulate specificity protein transcription factors and the G2-M checkpoint in MDA-MB-231 breast cancer cells. Cancer research 67, 11001-11011.
Mizoguchi, M., Guan, Y., Yoshimoto, K., Hata, N., Amano, T., Nakamizo, A., Sasaki, T., 2013. Clinical implications of microRNAs in human glioblastoma. Frontiers in oncology 3, 19. Montano, N., Cenci, T., Martini, M., D'Alessandris, Q.G., Pelacchi, F., Ricci-Vitiani, L., Maira,
G., De Maria, R., Larocca, L.M., Pallini, R., 2011. Expression of EGFRvIII in glioblastoma: prognostic significance revisited. Neoplasia 13, 1113-1121.
Nakata, W., Uemura, M., Sato, M., Fujita, K., Jingushi, K., Ueda, Y., Kitae, K., Tsujikawa, K., Nonomura, N., 2015. Expression of miR-27a-3p is an independent predictive factor for recurrence in clear cell renal cell carcinoma. Oncotarget 6, 21645-21654.
Napoletani, D., Panza, M., Struppa, C., 2010. Agnostic Science. Towards a Philosophy of Data Analysis. Foundations of Science 16, 1-20.
Pallini, R., Ricci-Vitiani, L., Banna, G.L., Signore, M., Lombardi, D., Todaro, M., Stassi, G., Martini, M., Maira, G., Larocca, L.M., De Maria, R., 2008. Cancer stem cell analysis and clinical outcome in patients with glioblastoma multiforme. Clinical cancer research : an official journal of the American Association for Cancer Research 14, 8205-8212.
Pang, C., Guan, Y., Zhao, K., Chen, L., Bao, Y., Cui, R., Li, G., Wang, Y., 2015. Up-regulation of microRNA-15b correlates with unfavorable prognosis and malignant progression of human glioma. International journal of clinical and experimental pathology 8, 4943-4952. Phillips, H.S., Kharbanda, S., Chen, R., Forrest, W.F., Soriano, R.H., Wu, T.D., Misra, A.,
Nigro, J.M., Colman, H., Soroceanu, L., Williams, P.M., Modrusan, Z., Feuerstein, B.G., Aldape, K., 2006. Molecular subclasses of high-grade glioma predict prognosis, delineate a pattern of disease progression, and resemble stages in neurogenesis. Cancer cell 9, 157-173. Piccirillo, S.G., Colman, S., Potter, N.E., van Delft, F.W., Lillis, S., Carnicer, M.J., Kearney, L.,
Watts, C., Greaves, M., 2015. Genetic and functional diversity of propagating cells in glioblastoma. Stem cell reports 4, 7-15.
Accepted
Article
Preisendorfer, R., Mobley, C., Bannett, T., 1988. Principal component analysis in meteorology and oceanography. Journal of Geophysical Research 93, 10815-10830.
Rao, S.A., Santosh, V., Somasundaram, K., 2010. Genome-wide expression profiling identifies deregulated miRNAs in malignant astrocytoma. Modern pathology : an official journal of the United States and Canadian Academy of Pathology, Inc 23, 1404-1417.
Schraivogel, D., Weinmann, L., Beier, D., Tabatabai, G., Eichner, A., Zhu, J.Y., Anton, M., Sixt, M., Weller, M., Beier, C.P., Meister, G., 2011. CAMTA1 is a novel tumour suppressor regulated by miR-9/9* in glioblastoma stem cells. The EMBO journal 30, 4309-4322.
Schulte, A., Gunther, H.S., Phillips, H.S., Kemming, D., Martens, T., Kharbanda, S., Soriano, R.H., Modrusan, Z., Zapf, S., Westphal, M., Lamszus, K., 2011. A distinct subset of glioma cell lines with stem cell-like properties reflects the transcriptional phenotype of glioblastomas and overexpresses CXCR4 as therapeutic target. Glia 59, 590-602.
Sethi, S., 1971. Comparative cluster analysis for world markets. Journal of Marketing Research 8, 348-354.
Singh, S.K., Hawkins, C., Clarke, I.D., Squire, J.A., Bayani, J., Hide, T., Henkelman, R.M., Cusimano, M.D., Dirks, P.B., 2004. Identification of human brain tumour initiating cells. Nature 432, 396-401.
Stupp, R., Mason, W.P., van den Bent, M.J., Weller, M., Fisher, B., Taphoorn, M.J., Belanger, K., Brandes, A.A., Marosi, C., Bogdahn, U., Curschmann, J., Janzer, R.C., Ludwin, S.K., Gorlia, T., Allgeier, A., Lacombe, D., Cairncross, J.G., Eisenhauer, E., Mirimanoff, R.O., European Organisation for, R., Treatment of Cancer Brain, T., Radiotherapy, G., National Cancer Institute of Canada Clinical Trials, G., 2005. Radiotherapy plus concomitant and adjuvant temozolomide for glioblastoma. The New England journal of medicine 352, 987-996.
Tan, X., Wang, S., Zhu, L., Wu, C., Yin, B., Zhao, J., Yuan, J., Qiang, B., Peng, X., 2012. cAMP response element-binding protein promotes gliomagenesis by modulating the expression of oncogenic microRNA-23a. Proceedings of the National Academy of Sciences of the United States of America 109, 15805-15810.
Tian, Y., Fu, S., Qiu, G.B., Xu, Z.M., Liu, N., Zhang, X.W., Chen, S., Wang, Y., Sun, K.L., Fu, W.N., 2014. MicroRNA-27a promotes proliferation and suppresses apoptosis by targeting PLK2 in laryngeal carcinoma. BMC cancer 14, 678.
Verhaak, R.G., Hoadley, K.A., Purdom, E., Wang, V., Qi, Y., Wilkerson, M.D., Miller, C.R., Ding, L., Golub, T., Mesirov, J.P., Alexe, G., Lawrence, M., O'Kelly, M., Tamayo, P., Weir, B.A., Gabriel, S., Winckler, W., Gupta, S., Jakkula, L., Feiler, H.S., Hodgson, J.G., James, C.D., Sarkaria, J.N., Brennan, C., Kahn, A., Spellman, P.T., Wilson, R.K., Speed, T.P., Gray, J.W., Meyerson, M., Getz, G., Perou, C.M., Hayes, D.N., Cancer Genome Atlas Research, N., 2010. Integrated genomic analysis identifies clinically relevant subtypes of glioblastoma characterized by abnormalities in PDGFRA, IDH1, EGFR, and NF1. Cancer cell 17, 98-110. Visani, M., de Biase, D., Marucci, G., Cerasoli, S., Nigrisoli, E., Bacchi Reggiani, M.L., Albani,
F., Baruzzi, A., Pession, A., group, P.s., 2014. Expression of 19 microRNAs in glioblastoma and comparison with other brain neoplasia of grades I-III. Molecular oncology 8, 417-430. Wen, P.Y., Kesari, S., 2008. Malignant gliomas in adults. The New England journal of medicine
359, 492-507.
Wen, P.Y., Macdonald, D.R., Reardon, D.A., Cloughesy, T.F., Sorensen, A.G., Galanis, E., Degroot, J., Wick, W., Gilbert, M.R., Lassman, A.B., Tsien, C., Mikkelsen, T., Wong, E.T., Chamberlain, M.C., Stupp, R., Lamborn, K.R., Vogelbaum, M.A., van den Bent, M.J., Chang, S.M., 2010. Updated response assessment criteria for high-grade gliomas: response assessment in neuro-oncology working group. Journal of clinical oncology : official journal of the American Society of Clinical Oncology 28, 1963-1972.
Accepted
Article
Wu, X.Z., Wang, K.P., Song, H.J., Xia, J.H., Jiang, Y., Wang, Y.L., 2015. MiR-27a-3p promotes esophageal cancer cell proliferation via F-box and WD repeat domain-containing 7 (FBXW7) suppression. International journal of clinical and experimental medicine 8, 15556-15562.
Xu, W., Liu, M., Peng, X., Zhou, P., Zhou, J., Xu, K., Xu, H., Jiang, S., 2013. miR-24-3p and miR-27a-3p promote cell proliferation in glioma cells via cooperative regulation of MXI1. International journal of oncology 42, 757-766.
Yang, S., Wang, K., Qian, C., Song, Z., Pu, P., Zhang, A., Wang, W., Niu, H., Li, X., Qi, X., Zhu, Y., Wang, Y., 2012. A predicted miR-27a-mediated network identifies a signature of glioma. Oncology reports 28, 1249-1256.
Yoo, A.S., Staahl, B.T., Chen, L., Crabtree, G.R., 2009. MicroRNA-mediated switching of chromatin-remodelling complexes in neural development. Nature 460, 642-646.
Zhang, Y., Xu, Y., Li, F., Li, X., Feng, L., Shi, X., Wang, L., Li, X., 2016. Dissecting dysfunctional crosstalk pathways regulated by miRNAs during glioma progression. Oncotarget 7, 25769-25782.
FIGURE LEGENDS
Figure 1: Principal component analysis of miRNA expression identifies two distinct clusters of GSC-lines largely corresponding to the GSf-like/GSr-like classification described previously. Individual GSC samples (top) or miRNAs (bottom) are distributed into bivariate spaces spanned by the first two principal component loadings (top panel) and scores (bottom panel) respectively.
Figure 2: Classification in two clusters of GSC-lines by miRNA signature reproduces the classification based on NMR analysis with the exception of one line.
Figure 3: Box and whiskers plots of miR-9-3p (top), miR-23a (center) and miR-27a (bottom) expression in M and P subtype GBM samples extracted from TCGA (A) or in GSC-lines (B). Numbers of samples in each group is indicated in brackets. The variability represents the range encompassing minimum and maximum values. * and *** indicate a significant (p<0.05 and p<0.001) difference between the two groups, respectively (Umpaired t test, two-tailed).
Figure 4: Kaplan-Meier analysis shows that among 169 GBM patients from TCGA prognosis was significantly worse in those classified as GSr-like than in those classified as GSf-like (p=0.0032) (A). The classification based on miRNA-expression applied to the whole cohort of 429 patients for whom survival and miRNA expression data were available,
Accepted
Article
irrespective of the Verhaak subtype classification, revealed that the prognoses of the GSr-like patients were significantly worse than those classified as GSf-like (p=0.042) (B). For this analysis a training set of 177 out of 429 patients of known subtype (93 M and 84 P) was defined to build the linear discriminant function for predicting the GSr- and GSf-like subtypes of the independent test set of 252 patients.
Figure 5: Pathway enrichment analysis of mRNA targets of the three miRNAs included in the signature indicates a significant association with cell survival, cancer and cell adhesion but also with neurodegenerative diseases.
Supplementary Information
Supplementary Table 1. Clinical parameters: comparison between groups.
Supplementary Table 2. Stemness features of GSC lines (CD133 and Sox2 expression;estimated stem cell frequency evaluated by ELDA).
Supplementary Table 3. Clusterization of GSC lines based on expression levels of miR-23a, miR-27a and miR-9-3p.
Supplementary Table 4. Molecular parameters: comparison between groups. Supplementary Table 5. Univariate Kaplan-Meier analysis for prognosticators. Supplementary Table 6. Overlap of miRNA target genes with KEGG pathways.
Accepted
Article
Table 1. Cluster summary for the two subtypes
Cluster Variation Proportion Second Cluster Members Variation Explained Explained Eigenvalue
1 11 11 9.074497 0.8250 0.6826
2 8 8 6.76652 0.8458 0.5199
R-squared with
§
Own #Next 1-R**2 Variable
Cluster Variable Cluster Closest Ratio Label
Cluster 1 GSC#1 0.9158 0.6729 0.2573 GSF GSC#28 0.9454 0.5663 0.1260 GSF GSC#62 0.8492 0.6188 0.3955 GSF GSC#23P 0.9251 0.5786 0.1777 GSF GSC#148 0.4918 0.3335 0.7625 GSF GSC#83.2 0.7949 0.7244 0.7439 GSR GSC#70 0.7282 0.2607 0.3676 GSF GSC#67 0.8538 0.5345 0.3142 GSF GSC#68 0.9416 0.7630 0.2464 GSF GSC#76 0.7078 0.6393 0.8101 GSF GSC#23C 0.9209 0.6639 0.2354 GSF Cluster 2 GSC#30PT 0.7142 0.3783 0.4596 GSR GSC#151 0.8917 0.6500 0.3094 GSR GSC#147 0.8619 0.6964 0.4550 GSR GSC#83 0.8890 0.7076 0.3795 GSR GSC#61 0.8113 0.4935 0.3725 GSR GSC#30P 0.9034 0.5170 0.2000 GSR GSC#74 0.9037 0.5606 0.2191 GSR GSC#112 0.7912 0.7170 0.7379 GSR
Accepted
Article
Table 2. Percent of variation (a) and loading pattern (b) of the PCA two components
a
Eigenvalue Difference Proportion Cumulative
1 14.5695598 12.9073361 0.7668 0.7668 2 1.6622236 0.9878260 0.0875 0.8543
b
Factor 1 Factor 2 GSC#1 GSF 0.93869 -0.19860 GSC#28 GSF 0.91768 -0.33740 GSC#62 GSF 0.90229 -0.17376 GSC#30PT GSR 0.74159 0.46038 GSC#23P GSF 0.91457 -0.31932 GSC#148 GSF 0.67795 -0.13114 GSC#83.2 GSR 0.91327 -0.00270 GSC#70 GSF 0.73815 -0.59035 GSC#67 GSF 0.87964 -0.28438 GSC#151 GSR 0.90307 0.26623 GSC#147 GSR 0.91298 0.20288 GSC#83 GSR 0.92311 0.19042 GSC#68 GSF 0.96986 -0.13348 GSC#76 GSF 0.86077 -0.01324 GSC#61 GSR 0.81959 0.41098 GSC#30P GSR 0.85197 0.44001 GSC#74 GSR 0.87068 0.36793 GSC#23C GSF 0.93719 -0.21187 GSC#112 GSR 0.90372 0.09592Accepted
Article
Table 3. Pearson Correlation Coefficients
Pearson Correlation Coefficients, N = 19 Prob > | r | under H0: Rho=0
hsa-miR-9* hsa-miR-9 hsa-miR-27a hsa-miR-24 hsa-miR-29b hsa-miR-23a hsa-miR-29a
hsa-miR-9* 1.00000 0.99076 -0.32515 -0.28202 -0.28583 -0.32931 -0.30315 hsa-miR-9* <.0001 0.17440 0.24210 0.23550 0.16860 0.20710 hsa-miR-9 0.99076 1.00000 -0.35684 -0.29708 -0.32582 -0.35608 -0.33291 hsa-miR-9 <.0001 0.13370 0.21680 0.17340 0.13460 0.16370 hsa-miR-27a -0.32515 -0.35684 1.00000 0.92851 0.41080 0.98329 0.40805 hsa-miR-27a 0.17440 0.13370 <.0001 0.08060 <.0001 0.08290 hsa-miR-24 -0.28202 -0.29708 0.92851 1.00000 0.32381 0.96156 0.31908 hsa-miR-24 0.24210 0.21680 <.0001 0.17620 <.0001 0.18300 hsa-miR-29b -0.28583 -0.32582 0.41080 0.32381 1.00000 0.38931 0.98087 hsa-miR-29b 0.23550 0.17340 0.08060 0.17620 0.09940 <.0001 hsa-miR-23a -0.32931 -0.35608 0.98329 0.96156 0.38931 1.00000 0.38926 hsa-miR-23a 0.16860 0.13460 <.0001 <.0001 0.09940 0.09950 hsa-miR-29a -0.30315 -0.33291 0.40805 0.31908 0.98087 0.38926 1.00000 hsa-miR-29a 0.20710 0.16370 0.08290 0.18300 <.0001 0.09950
Accepted
Article
Table 4. Pearson correlation coefficients ordered in terms of t-test value
Variable Method Variances DF t Value Pr > | t |
hsa-miR-9* Pooled Equal 17 2.73 0.0143
hsa-miR-9* Satterthwaite Unequal 9.19 2.88 0.0178
hsa-miR-9 Pooled Equal 17 2.64 0.0173
hsa-miR-9 Satterthwaite Unequal 9.69 2.78 0.0201
hsa-miR-27a Pooled Equal 17 -3.17 0.0056
hsa-miR-27a Satterthwaite Unequal 8.74 -3.02 0.0151
hsa-miR-24 Pooled Equal 17 -2.66 0.0164
hsa-miR-24 Satterthwaite Unequal 8.22 -2.52 0.0349
hsa-miR-29b Pooled Equal 17 -2.18 0.0439
hsa-miR-29b Satterthwaite Unequal 8.67 -2.07 0.0697
hsa-miR-23a Pooled Equal 17 -3.43 0.0032
hsa-miR-23a Satterthwaite Unequal 8.97 -3.26 0.0098
hsa-miR-29a Pooled Equal -2.39 0.0287
hsa-miR-29a Satterthwaite Unequal 8.9 -2.27 0.0493
Table 5. Three miRNA signature clusterization of 19 GSC lines
GSf-like GSr-like Total
GSf-like 10 0 10 100.00 0.00 100.00 GSr-like 1 8 9 11.11 88.89 100.00 Total 11 8 19 57.89 42.11 100.00
Accepted
Article
Table 6. Three miRNA signature clusterization of 37 GSC lines
Training set
GSr-like GSf-like Total
GSr-like 7 0 7 100.00% 0.00% GSf-like 0 9 9 0.00% 100.00% Total 7 9 16 Test set
GSr-like GSf-like Total
GSr-like 7 0 7
100 .00% 0.00%
GSf-like 1 13 14
7.10% 92.90%
Accepted
Article
Table 7. Three miRNA signature clusterization of TCGA patients
Training set M P Total M 64 6 70 91.4% 8.6% P 5 54 59 8.5% 91.5% Total 69 60 129 Test set M P Total M 30 8 38 78.9% 21.1% P 7 31 38 18.4% 81.6% Total 37 39 76