A mechanically active heterotypic E-cadherin/N-cadherin
adhesion enables fibroblasts to drive cancer cell invasion
Anna Labernadie1, Takuya Kato2, Agustí Brugués1, Xavier Serra-Picamal1,3, Stefanie Derzsi2, Esther Arwert2, Anne Weston2, Victor González-Tarragó1, Alberto Elosegui-Artola1, Lorenzo Albertazzi1, Jordi Alcaraz3, Pere Roca-Cusachs1,3, Erik Sahai2,*, and Xavier Trepat1,3,4,5,*
1Institute for Bioengineering of Catalonia, Barcelona 08028, Spain 2The Francis Crick Institute, 1 Midland Road, London, NW1 1AT, UK
3Unitat de Biofísica i Bioenginyeria, Facultat de Medicina, Universitat de Barcelona, Barcelona
08036, Spain
4Institució Catalana de Recerca i Estudis Avançats (ICREA), Barcelona 08010, Spain
5Centro de Investigación Biomédica en Red en Bioingeniería, Biomateriales y Nanomedicina,
Barcelona 08028, Spain
Abstract
Cancer Associated Fibroblasts (CAFs) promote tumor invasion and metastasis. We show that CAFs exert a physical force on cancer cells that enables their collective invasion. Force
transmission is mediated by a heterophilic adhesion involving N-cadherin at the CAF membrane and E-cadherin at the cancer cell membrane. This adhesion is mechanically active; when subjected to force it triggers β-catenin recruitment and adhesion reinforcement dependent on α-catenin/ vinculin interaction. Impairment of E-cadherin/N-cadherin adhesion abrogates the ability of CAFs to guide collective cell migration and blocks cancer cell invasion. N-cadherin also mediates repolarization of the CAFs away from the cancer cells. In parallel, nectins and afadin are recruited to the cancer cell/CAF interface and CAF repolarization is afadin dependent. Heterotypic
junctions between CAFs and cancer cells are observed in patient-derived material. Together, our
*Corresponding authors: Xavier Trepat, PhD, ICREA Research Professor, Institute for Bioengineering of Catalonia, 08028, Barcelona, Spain, Tel: (+34) 934 020 265, [email protected]; Erik Sahai, PhD, The Francis Crick Institute, 44 Lincoln’s Inn Fields, London WC2A 3LY, United Kingdom, [email protected].
Author contributions
AL, ES, and XT conceived the study and designed experiments, with additional input from TK. AL performed most experiments and data analysis. TK performed and analyzed spheroid invasion experiments and generated A431 KO cell lines. AL, AE-A, VG and PR-C designed, performed and analyzed magnetic cytometry assays. AB and XS-P developed software for image analysis and force measurements. SD performed QRT-PCR experiments. AL and LA performed STORM imaging. JA contributed CAFs from patients with non-small lung cell carcinoma. EA performed the intravital imaging and assisted the patient sample analysis, AW performed electron microscopy. AL, ES, XT wrote the manuscript with input from all authors.
Code availability
Computer code used in this study can be made available upon request to the corresponding authors.
Author Manuscript
Nat Cell Biol. Author manuscript; available in PMC 2018 March 01.
Published in final edited form as:
Nat Cell Biol. 2017 March ; 19(3): 224–237. doi:10.1038/ncb3478.
Europe PMC Funders Author Manuscripts
findings show that a mechanically active heterophilic adhesion between CAFs and cancer cells enables cooperative tumor invasion.
Introduction
Carcinomas often retain epithelial features such as cell-cell junctions and a limited ability to degrade the extracellular matrix (ECM)1,2. These features should limit their invasion; however, carcinoma cells can metastasize without requiring an epithelial to mesenchymal transition2–4. One solution to this paradox is that epithelial cancer cells exploit
non-malignant stromal cell types to develop cooperative invasion strategies5,6. Cancer associated fibroblasts (CAFs) are ideal stromal partners to enable collective cancer cell invasion5,7,8. CAFs can remodel the ECM to create tracks for cancer cells to migrate5,9, but the
mechanisms by which cancer cells enter CAF-generated tracks and migrate along them are unclear. One possibility is that cancer cells simply follow the paths of least mechanical resistance. CAFs and cancer cells might also use communication strategies to invade cooperatively. One of such communication strategies could be the secretion of soluble growth factors and chemokines so as to generate chemotactic gradients to direct cell
migration10–14. Contact mediated signaling via Eph/ephrin or nectin/afadin complexes may also play a role in cancer cell-CAF communication15,16. Yet another possibility is that CAFs and cancer cells guide each other through mechanical interactions. Mechanical coupling of epithelial cells via E-cadherin and catenin complexes linked to the actin cytoskeleton is well established17–21. However, cadherin contacts between different cell types in pathological contexts have not been deeply studied, and almost nothing is known about mechanical coupling between CAFs and epithelial cancer cells.
Here we show that CAFs drive the collective invasion of cancer cells through an intercellular physical force. Unexpectedly, this physical force is transmitted through a heterophilic adherens junction involving E-cadherin on the cancer cell membrane and N-cadherin on the CAF membrane. Heterotypic adhesion between both cell types mediates not only force transmission and mechanotransduction but also CAF polarization.
Results
CAFs lead cancer cell invasion in 3D and 2D migration assays
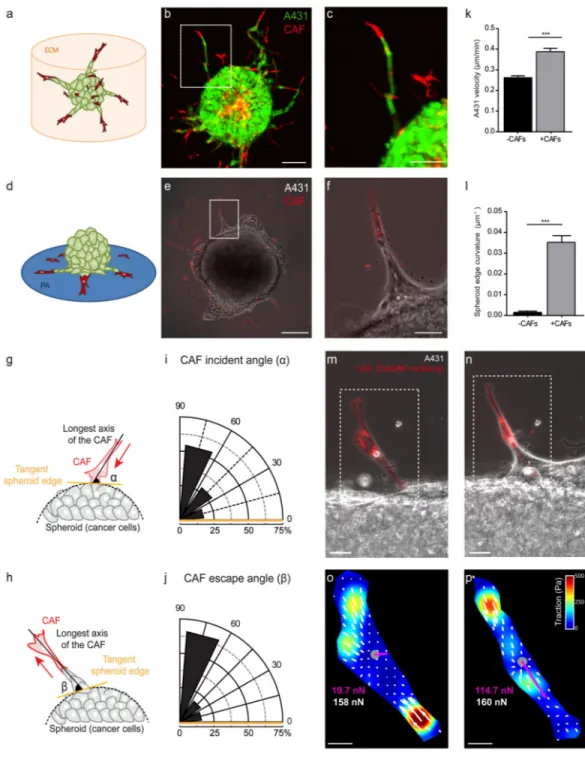
Spheroids containing cancer cells (A431) and CAFs, both derived from human vulval squamous cell carcinoma, were embedded in a mixture of collagen and matrigel (Figs 1a-c). Over 60 hours cells invaded the surrounding 3D ECM forming strands in which the leading cell was generally one CAF followed by several A431cells (Figs 1a-c, Supplementary Video 1)5. To study whether confinement by the ECM is required for the leader/follower
organization of CAF/A431 invasion we designed a 2D assay in which cells could migrate in the absence of the geometric constraints imposed by the ECM (Figs 1d-f and Supplementary Videos 2 and 3). Spheroids containing only A431 cells were deposited on a soft
polyacrylamide gels (Young’s modulus, 6kPa) and allowed to attach for ~12 hours. We then added CAFs and let them attach randomly on the substrate. Within a few hours, a fraction of the CAFs contacted the spheroid (Supplementary Video 2). Upon contact, CAFs inverted
Europe PMC Funders Author Manuscripts
their front/rear polarity and migrated away from the spheroid followed by A431 cells (Figs 1e-f, Supplementary Videos 2 and 3). To characterize CAF repolarization we took advantage of their elongated shape, and we defined the incident angle (α) as the angle between the CAF orientation and the tangent to the spheroid immediately before contact (Fig. 1g). Conversely, we defined the escape angle (β) as the angle between the CAF orientation and the tangent to the spheroid after contact (Fig. 1h). CAFs approached the spheroids following a trajectory that was generally perpendicular to the spheroid tangent (Fig. 1i). The escape trajectory was also perpendicular to the spheroid tangent indicating an inversion of CAF polarity reminiscent of that observed during contact inhibition of locomotion (CIL)15,22–26 (Fig. 1j, Supplemental Videos 2 and 3). Unlike cells undergoing CIL, and despite the absence of surrounding 3D ECM, CAFs remained in close contact with cancer cells in a leader/follower organization that lasted several hours. Both the velocity of A431 cells and the local curvature of the spheroid were highest in the regions where CAFs were leading the spreading of the spheroid (Figs 1k and 1l). These results show that intercellular
communication mechanisms independent of the 3D ECM must be invoked to explain guidance of cancer cells by CAFs.
CAFs generate pulling forces on cancer cells
Guidance of cancer cell migration by CAFs could result from paracrine signaling, as in the case of tumor associated macrophages6, but also by direct physical dragging through a force exerted by CAFs on cancer cells. To test the latter possibility, we used traction force
microscopy to monitor forces generated by the CAFs on their substrate before contacting the spheroid (Figs 1m and 1o) and during CAF-led migration (Figs 1n and 1p). Before contact, CAFs exhibited a traction pattern characteristic of mesenchymal cells in isolation; forces were restricted to both edges of the CAFs and, within the experimental noise, the vectorial sum of forces vanished, indicating force balance (Fig. 1o). In contrast, when CAFs were leading cancer cell migration, traction forces exerted by CAFs were locally unbalanced and tractions at the leading edge largely exceeded those at the trailing edge (Fig. 1p). As a direct consequence of Newton’s laws17,27–30 this result establishes that traction forces generated by CAFs at the leading edge are transmitted to cancer cells.
CAFs and A431 cells form heterophilic E-cadherin/N-cadherin junctions
To be able to transmit forces, CAFs and cancer cells must be mechanically connected. This was confirmed by the observation of multiple contact points in Transmission Electron Microscopy (TEM) and Focused Ion Beam Scanning Electron Microscopy (FIB-SEM) (Fig. 2a, Supplementary Video 4). To identify the proteins involved in these interactions, we first focused on classical cadherins (E-, N-, P-cadherin). QRT-PCR analysis revealed that A431 cells expressed both E- and P-cadherin, consistent with previous results31, and CAFs expressed N-cadherin (Fig. 2b). This excludes the possibility of homophilic interactions between CAFs and A431 cells involving classical cadherins. We therefore considered the possibility of heterophilic junctions between N-cadherin at the CAF membrane and E- or P-cadherin at the A431 membrane. Co-cultured CAFs and cancer cells showed co-localization of E-cadherin and N-cadherin at contacts between the two cell types (Fig. 2c, Supplementary Figure 1a-e). Further, α-catenin, β-catenin and vinculin were observed at the interface between A431 cells and CAFs (Supplementary Figs 2 and 3). Higher resolution Structured
Europe PMC Funders Author Manuscripts
Illumination Microscopy (SIM) and Stochastic Optical Reconstruction Microscopy (STORM) confirmed the co-localization of E-cadherin, N-cadherin, β-catenin and F-actin (Figs 2e and 2f, Supplementary Figure 1f). P-cadherin localized at the junctions between A431 cells, but not between CAFs and A431 cells (Fig. 2d, Supplementary Figure 1g). To study junctional kinematics we stably expressed N-cadherin-EGFP in CAFs and E-cadherin-Ruby in A431 cells deleted for endogenous E-cadherin using CRISPR/Cas9 (details in Supplementary Figure 4a-g,q). E-cadherin and N-cadherin co-localized within 30 minutes of contact between cells, and this co-localization persisted for >60 minutes (Figs 2g and 2h). In contrast, expression of E-cadherin with a W2A mutation in the extracellular domain (A431-EcadW2A) drastically diminished co-localization with N-cadherin, and the few contacts that formed were short-lived (Figs. 2g and 2h, Supplementary Video 5). This suggests that E-cadherin and N-cadherin form strand-swap dimers between their cadherin EC1 domains32,33. Calcium chelation and re-addition experiments confirmed the importance of Ca2+ for E-cadherin/N-cadherin co-localization (Supplementary Video 6). Further time-lapse imaging confirmed the localization with β-catenin and vinculin at E-cadherin/N-cadherin junctions (Supplementary Videos 7, 8, and 9).
E-cadherin/N-cadherin heterophilic junctions between CAFs and cancer cells are present in different types of carcinoma
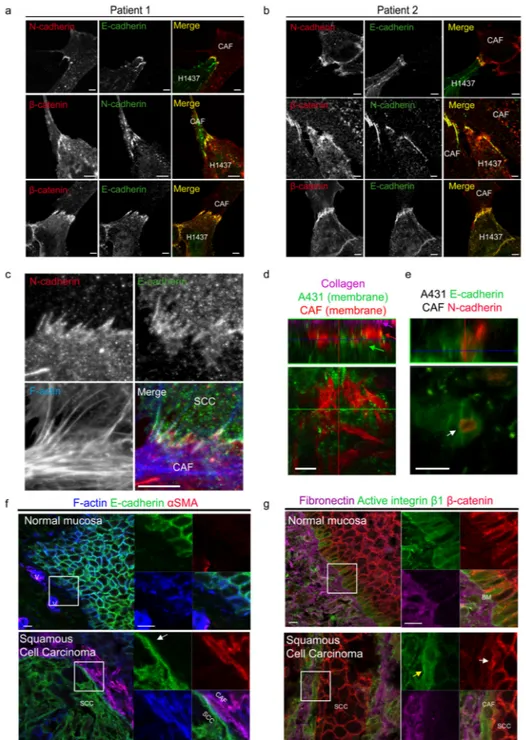
We next investigated whether the E-cadherin/N-cadherin junction was present in other types of carcinoma (Fig. 3). We analyzed co-cultures of primary human CAFs isolated from lung adenocarcinoma patients and human lung adenocarcinoma cancer cells (H1437). Similarly to A431 cells, H1437 are weakly-invasive carcinoma cells that express E-cadherin, but not N-cadherin or P-cadherin34. In the 3 patients analyzed, immunostainings revealed the extensive presence of E-cadherin/N-cadherin junctions and their systematic colocalization with β-catenin (Fig. 3a-b, Supplementary Figure 5). We also co-cultured cancer cells and CAFs isolated from the same vulval squamous cell carcinoma patient. These experiments also showed co-localization of N-cadherin, E-cadherin and F-actin at the CAF-cancer cell contact (Fig. 3c).
To investigate heterotypic contacts between cancer cells and fibroblasts in vivo we performed intravital imaging and analyzed patient samples. Figures 3d and 3e show close contact of cancer cells and CAFs in tumors generated by the co-injection of A431 cells and CAFs. CAFs were typically located at the tumor margin between the cancer cells and the ECM (magenta in xz projection). Co-injection of E-cadherin-Ruby A431 cells and N-cadherin-GFP CAFs revealed co-location of both cadherins at the interface between cancer cells and CAFs (Fig. 3e). More significantly, staining of human squamous cell carcinoma revealed clear localization of E-cadherin at the interface between cancer cells and α-smooth muscle actin (αSMA) positive CAFs (Fig. 3f). β-catenin was also localized at this interface (Fig. 3g); as expected, neither E-cadherin nor β-catenin localized to the basal surface of normal epidermis. In addition to analyzing heterotypic cell contacts, we investigated cell-ECM contacts by staining for active integrin β1 and fibronectin. This revealed rather variable cell-ECM contacts in SCC cells. CAFs showed higher levels of integrin activation and fibronectin contact and, in some cases, CAFs were simultaneously making contact with
Europe PMC Funders Author Manuscripts
the ECM and cancer cells (yellow and white arrows, respectively, in the right-hand panel of Fig. 3g). Thus, heterotypic E-cadherin/N-cadherin junctions are observed in many contexts in both lung and squamous cell carcinoma.
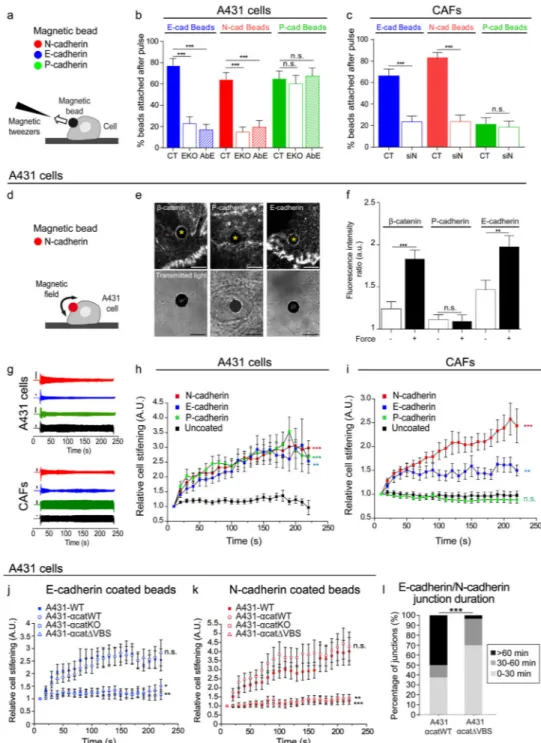
The E-cadherin/N-cadherin junction withstands similar forces than homophilic junctions To address the mechanical properties of a heterotypic E-cadherin/N-cadherin contact, we employed a set of magnetocytometry approaches19,35–37 to apply forces on beads attached to cells through diverse homophilic and heterophilic cadherin adhesions (Fig. 4). We coated magnetic beads with either recombinant E-, N- or P-cadherin Fc fusion proteins and allowed them to attach to A431 cells (Fig. 4a). We quantified the number of beads attached to cells after applying a pulling force of 0.5 nN for 1 minute (Fig. 4b). After the force pulse, ~70% of the beads coated with either E-cadherin or P-cadherin remained attached to the cells, thus indicating a similar strength of homophilic E-cadherin and P-cadherin adhesions in A431 cells. Despite the fact that A431 cells do not express N-cadherin, ~70% of the beads coated with N-cadherin also resisted the force pulse, indicating that the heterophilic N-cadherin junction with A431 cells was able to withstand similar forces than the homophilic E-cadherin/E-cadherin junctions.
We next repeated the protocol using A431-EcadKO cells. E-cadherin knockout did not lead to compensatory expression of N-cadherin, although P-cadherin levels increased modestly (Supplementary Figure 4a). As expected, the binding of E-cadherin beads decreased very significantly, although some residual non-specific interaction remained37 (Fig. 4b). The number of P-cadherin beads that resisted the force pulse did not change in A431-EcadKO cells, thus highlighting the specificity of the assay. Importantly, knocking out E-cadherin resulted in a large drop in N-cadherin bead binding, which supports the existence of a heterophilic adhesion between N-cadherin and cadherin (Fig. 4b). To confirm the E-cadherin dependence of N-E-cadherin binding, we used an E-E-cadherin blocking antibody (Fig. 4b). These experiments paralleled those in A431-EcadKO cells, further supporting that adhesion of N-cadherin beads to A431 cells is mediated by heterophilic contact with E-cadherin.
We applied the same experimental approach to CAFs (Fig. 4c). The majority of N-cadherin beads (~80%) remained attached after the magnetic pulse, whereas most P-cadherin beads were unable to resist the applied force. A large fraction (63%) of beads coated with E-cadherin remained attached to the CAF surface, consistent with a heterotypic E- E-cadherin/N-cadherin junction. To further investigate this interaction in CAFs, we used siRNA to knockdown N-cadherin (CAFs-siNcad, see Supplementary Figure 4f,h-k, n, q) and repeated the pulse application. In these experiments, the number of E-cadherin and N-cadherin beads that remained attached decreased to residual levels. We conclude that both A431 cells and CAFs are able to form strong heterotypic adhesions through E-cadherin and N-cadherin. The E-cadherin/N-cadherin junction is mechanosensitive
We next studied whether the junction is mechanosensitive. We first investigated whether adherens junctions proteins are recruited to the membrane of A431 cells when exposed to a bead coated with N-cadherin (Figs 4d-f). Immunostainings of the cell-bead contact revealed
Europe PMC Funders Author Manuscripts
accumulation of β-catenin and E-cadherin but not P-cadherin, indicating that N-cadherin is sufficient to recruit E-cadherin and actin binding partners (Fig. 4e). We then applied a pulsatile force to the cell-bead contact and observed a significant increase in the recruitment of β-catenin and E-cadherin but not of P-cadherin (Fig. 4f). These results establish that a heterophilic E-cadherin/N-cadherin junction triggers a specific mechanotransduction response.
To quantify the mechanical response of the E-cadherin/N-cadherin junction we used magnetic tweezers to apply high pulsatile forces to the adherent magnetic beads and recorded the resulting bead displacements19,21,35 (Figs 4g-i). In A431 cells, pulling on E- and P-cadherin beads resulted in a progressive decrease in bead displacements, showing that cells responded to the applied force by stiffening the adhesion (Figs 4g and 4h). No
stiffening was observed when pulling on uncoated beads, indicating that unspecific binding of the beads does not induce a mechanoresponse. Despite the fact that A431 cells do not express N-cadherin, force applied to N-cadherin beads also triggered reinforcement of the adhesion with similar magnitude and time evolution than those of homophilic E- and P-cadherin adhesions. We followed the same approach to analyze mechanosensitivity of the E-cadherin/cadherin junction in CAFs (Figs 4g and 4i). As expected, force applied to N-cadherin coated beads triggered strong reinforcement of the CAF-bead contact. Force applied through E-cadherin beads also triggered mechanical reinforcement in CAFs,
although to a lesser extent than N-cadherin beads. Force applied through P-cadherin beads or uncoated beads unspecifically bound to the CAFs did not affect dynamics of the cell-bead contact. Taken together, our results establish that, unlike previously thought35, a heterophilic E-cadherin/N-cadherin adhesion is able to sense and actively respond to physical forces. Mechanotransduction at adherens junctions has been attributed to forced unfolding of a cryptic binding site in α-catenin that enables vinculin binding37–40. To study whether this mechanism explains mechanotransduction of the E-cadherin/N-cadherin junction we used CRISPR/Cas9 to knock out catenin in A431 cells (A431-αcatKO) and expressed α-catenin lacking the vinculin binding site (A431-αcatΔVBS) or wild type α-catenin (A431-αcatWT, rescue control). Experiments using either E-cadherin beads (Fig. 4j) or N-cadherin beads (Fig. 4k) showed that reinforcement responses were abrogated in cells lacking α-catenin or its vinculin binding site. Thus, mechanosensing by E-cadherin/N-cadherin junctions is enabled by vinculin binding to α-catenin. To test whether junctional
reinforcement by vinculin binding influenced CAF-A431 interfacial dynamics, we compared heterotypic contact time between CAFs and A431-αcatWT or A431-αcatΔVBS. These experiments showed that impeding vinculin binding to α-catenin shortens contact time significantly, thus indicating that mechanosensing plays a central role in determining junctional integrity (Fig 4l).
E-cadherin is required for force transmission between A431 and CAFs
The fact that the E-cadherin/N-cadherin junction is mechanically active and able to
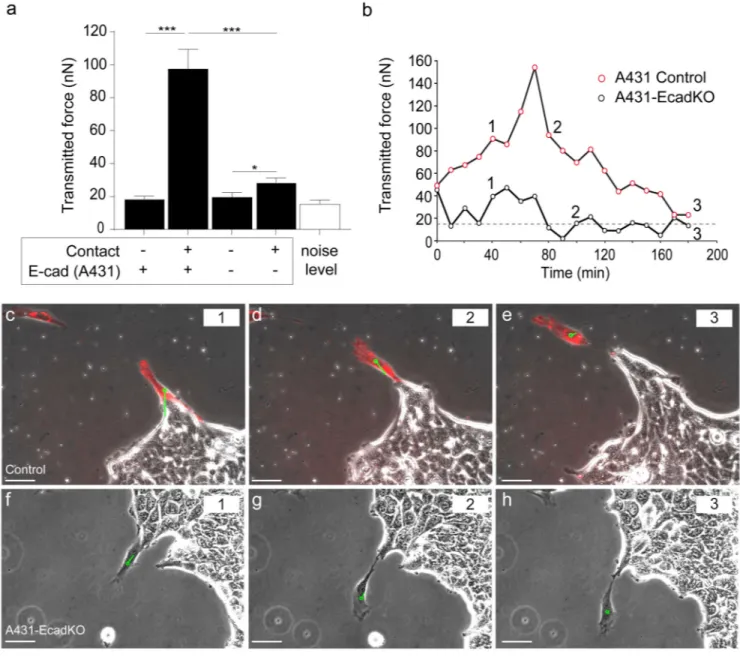
withstand forces does not demonstrate that this junction is responsible for force transmission during CAF-led migration of A431 cells. To address this issue quantitatively, we measured force transmission between CAFs and A431 cells in the presence or absence of E-cadherin
Europe PMC Funders Author Manuscripts
(Fig. 5). During contact, control CAFs exerted a force of ~100nN on A431 cells, comparable with the force across homotypic junctions in epithelial doublets and sheets17,18,27,30 (Fig. 5a). When E-cadherin was knocked out in A431 cells, force transmission levels fell dramatically compared to the control case (Fig. 5a), indicating a key role for E-cadherin in force transmission between the two cell types.
We next analyzed the time course of force transmission during collective cell migration. Forces between CAFs and control A431 cells exhibited large fluctuations (Figs 5b-e and Supplemental Video 10), consistent with the dynamic activity of cell-cell adhesion proteins at the CAF-A431 contact (Supplemental Video 7). When CAFs eventually detached from the A431 cells and migrated in isolation, local balance of traction forces within the CAFs was re-established and force transmission between cells vanished (Figs 5b-e and Supplemental Video 10). In contrast with control A431 cells, force transmission during physical contact between CAFs and A431-EcadKO cells was minimal (Figs 5b and 5f-h, Supplementary Video 11). Taken together, our results show that heterotypic adhesions between CAFs and cancer cells transmit tugging forces of similar magnitude than those exerted between homotypic cell doublets and within epithelial monolayers17,18,27,30.
Impairment of the E-cadherin/N-cadherin junction alters cell migration patterns in 2D We next sought to analyze the cooperative migration of CAFs and A431 cells in 2D spheroid assays. The majority of CAFs are directly followed by cancer cells; we termed these CAFs “leaders” (Fig. 6a,b, Supplementary Video 12). CAFs that migrated away from the spheroid as isolated cells were called “loners” (Fig. 6a,b, Supplementary Video 12). The fraction of leaders in CAFs was ~3-fold higher than that in normal dermal fibroblasts (Fig. 6b, see Supplementary Figure 4p for a characterization of normal fibroblast and CAF contractility). Similarly, the fraction of leaders in a population of primary lung CAFs was ~4-fold higher than in fibroblasts obtained from tumor-free parenchyma in the same patients (Fig. 6c). This evidence indicates that the ability of fibroblasts to lead cancer cells correlates with their activation state.
We probed the role of the heterophilic E-cadherin/N-cadherin interaction in determining the fraction of leader vs follower CAFs by either using A431-EcadKO cells or CAFs-siNcad. When E-cadherin was knocked out, the percentage of leaders dropped dramatically (Fig. 6d, Supplementary Video 13). N-cadherin siRNA in CAFs also decreased the numbers of leaders significantly (Fig. 6d). These findings cannot be attributed to an effect of the depletion on the migratory behavior of each individual cell type because A431-EcadKO spheroids (without CAFs) exhibited the same expansion velocity and shape than their control counterparts (Supplementary Figure 4e), and CAF-siNcad in isolation migrated at the same velocity than control CAFs (Supplementary Figure 4n). Taken together, these findings support that the heterophilic E-cadherin/N-cadherin junction is responsible for the guidance of A431 cells by CAFs in 2D migration assays.
N-cadherin, afadin, and mechanotransduction are required for CAF repolarization We next studied whether E-cadherin/N-cadherin junctions are also responsible for the repolarization of CAFs upon contact with A431 cells. While CAFs depleted for N-cadherin
Europe PMC Funders Author Manuscripts
approached the spheroid with a similar incident angle than controls (Fig. 6e), they did not reverse their polarity, but moved along the spheroid’s tangent rather than perpendicularly to it (Fig. 6f and Supplementary Video 13). Removal of E-cadherin also reduced the efficiency of CAF re-polarization, albeit to a lesser extent than N-cadherin depletion (Figure 6f). These observations indicate that N-cadherin plays a role in the guidance of cancer cell migration by CAFs heterophilic adhesions. Further, experiments using A431-αcatΔVBS cells and their rescue control A431-αcatWT demonstrated that junctional mechanostransduction is critical for CAFs to lead A431 migration (Figs 6g-i).
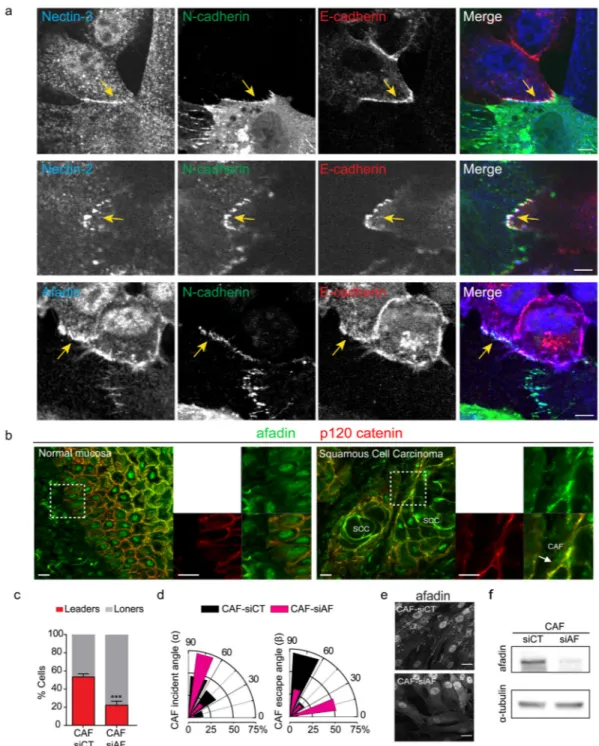
The lesser effect of E-cadherin knockout on CAF re-polarization suggested that other signaling modules may be engaged at the A431/CAF interface. Therefore, we analyzed the localization of nectins, their actin-binding partner protein afadin, and cadherin-11, which have previously been implicated in modulating adherens junctions and CIL16,41 (Fig. 7 and Supplementary Figure 6). Cadherin-11 did not localize to heterotypic contact zones and depletion experiments revealed no effect on the ability of CAFs to lead A431 migration (Supplementary Figures 6a-c). In contrast, nectin-2, nectin-3 and afadin localized at heterotypic contacts (Fig. 7a). Afadin was also localized at the interface between SCC cells and the stroma in patient samples (Supplementary Figure 7b). Depletion of afadin in CAFs led to a >2-fold decrease the fraction of leaders and perturbed CAF repolarization following contact with cancer cells (Fig. 7c-f). Thus, the nectin-afadin system is required for both leader/follower patterns of 2D migration and CAF repolarization.
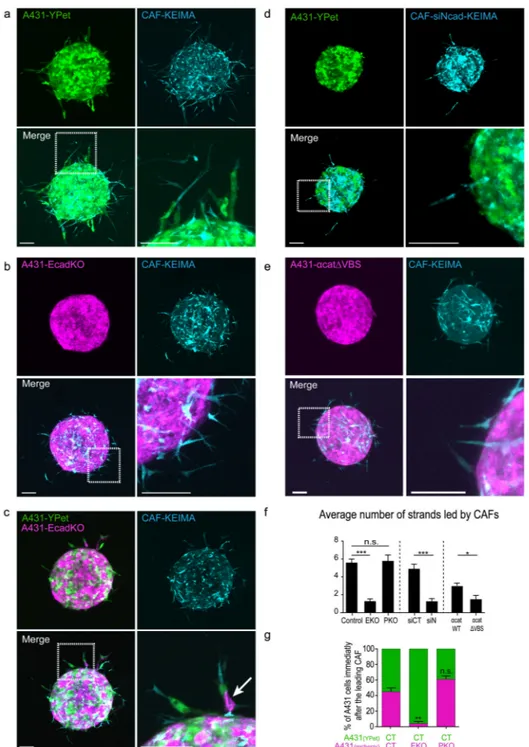
The E-cadherin/N-cadherin junction is required for A431 invasion
We next turned to 3D invasion assays; control spheroids of CAFs mixed with A431 cells invaded the ECM forming multicellular strands led by CAFs (Figs 8a, 8f). Strikingly, E-cadherin knockout in A431 cells greatly reduced cancer cell invasion; CAFs invaded the ECM but A431 cells were unable to follow them and remained cohesive in the spheroid (Figs 8b and 8f). P-cadherin knockout in A431 cells did not affect invasion (Fig. 8f, Supplementary Figure 7c). To exclude the possibility that E-cadherin A431-EcadKO cells are generally defective at invasion, we generated spheroids containing a mixture of A431 control cells, A431-EcadKO cells, and CAFs (Fig. 8c). In these experiments, A431-EcadKO cells were observed invading behind wild-type A431 cells (example marked with white arrow in Figure 8c), but almost never directly behind CAF. Thus, A431-EcadKO cells are not generically defective at invasion; they are simply defective at following fibroblasts. Consistent with this observation, in 96% of invading strands the cell immediately following the CAFs was a control cell rather than an A431-EcadKO cell (Figs 8c,g). Knockdown of N-cadherin in CAFs reduced the number of CAF-led invading A431 strands to a similar degree as knockout of E-cadherin in A431 cells (Fig. 8d,f), thus confirming the critical role of heterophilic E-cadherin/N-cadherin adhesion.
The continued cohesion of A431-EcadKO spheroids was somewhat unexpected as several studies have reported reduced cohesion and increased single cell migration following E-cadherin down-regulation42,43. We therefore investigated if the compensatory increase in P-cadherin in A431-EcadKO cells was responsible for cohesion (Supplementary Figure 4a). We generated A431 cells lacking both E-cadherin and P-cadherin (A431-EPcadKO). When
Europe PMC Funders Author Manuscripts
tested in spheroid assays with CAFs, A431-EPcadKO cells could invade as single cells and as cell strands lacking CAFs (Supplementary Figures 7b and 7d). Finally, we tested whether junctional mechanotransduction was required for CAFs to lead cancer cell invasion. The number of invasion strands led by CAFs in 3D invasion assays of A431-αcatΔVBS spheroids decreased sharply (Figs 8e and 8f). Taken together, this analysis indicates that A431 cells can display a broad repertoire of invasion modes depending on their homotypic adhesion, their heterotypic adhesion with CAFs, and their ability to actively respond to intercellular force. It emphasizes that forces applied on mechanically active E-cadherin/N-cadherin cancer cell-CAF contacts are critical to overcome the cohesive forces exerted by homotypic contacts between E-cadherin expressing cancer cells that can restrict migration.
Discussion
Cancer progression is increasingly attributed to the aberrant interaction between cancer cells and their microenvironment44–46. Non-malignant cell types within this microenvironment can be coopted by cancer cells to perform functions that are otherwise poorly efficient or altogether unavailable to the tumour47–49. While biochemical communication between the tumor and the stroma by growth factors and chemokines (e.g.TGFβ, HGF, EGF, CXCL12, CCL7)10–14 is well-established, we identified a physical cooperative invasion mechanism involving pulling force exerted by CAFs on cancer cells. Force transmission is mediated by a heterophilic junction between E-cadherin expressed by cancer cells and N-cadherin
expressed by CAFs. Several studies have demonstrated heterophilic junctions between distinct cadherin pairs50–55, and recent structural analysis indicates that the heterophilic cadherin/N-cadherin interaction has higher binding affinity than the homophilic
E-cadherin/E-cadherin one33. Consistent with our data, the high affinity binding in this interaction was dependent on the formation of strand-swap dimers33. However, the role of the interaction between E-cadherin and N-cadherin in physiology and disease is virtually unexplored. This gap of knowledge might be attributable, in part, to the traditional notion that expression of distinct cadherins by adjacent tissues favors tissue segregation rather than adhesion56. Here we demonstrated that, rather than mediating cell separation, an
E-cadherin/N-cadherin interaction enables cancer cell adhesion, migration, and invasion. In contrast, we found no evidence of P-cadherin/N-cadherin junctions. Importantly, our analysis establishes that heterotypic junctions not only transmit forces, but also trigger mechanotransduction pathways. This finding raises the possibility that, similarly to the case of homotypic junctions57, E-cadherin/N-cadherin junctions regulate signaling pathways downstream of a physical force. In this connection, an E-cadherin/N-cadherin junction between cancer cells and osteogenic cells was observed to promote Akt signaling55, although it was not linked to the application of physical force. A similar role to heterophilic E-cadherin/N-cadherin contacts may be fulfilled by homophilic N-cadherin junctions in tumor cells that have gained N-cadherin expression (Supplementary Figure 8a). Future work should address the prevalence of heterotypic E-cadherin/N-cadherin adhesions in vivo, and study mechanotransduction pathways downstream of this interaction.
Besides enabling adhesion, force transmission and invasion, the heterotypic junction also triggered repolarization of the CAFs favoring their migration away from the spheroid. Repolarization away from a cell-cell contact was first reported in the late 50’s and it is
Europe PMC Funders Author Manuscripts
commonly termed CIL23,24,58,59. CIL involves transient force transmission through homophilic N-cadherin junctions, followed by cell repolarization, junction dissociation and cell repulsion23,60. In contrast with the case of N-cadherin, force transmission through homophilic E-cadherin junctions mediates adhesion but does not trigger CIL25. Our observations show that the cadherin/N-cadherin junction exhibits features of both E-cadherin and N-E-cadherin homophilic junctions. Similarly to N-E-cadherin homophilic junctions, the E-cadherin/N-cadherin junction mediates repolarization so as to create a leading edge on the opposite side of the cell-cell contact. Unlike N-cadherin homophilic junctions, however, the E-cadherin/N-cadherin junction is not disrupted by force application and it enables cells to migrate collectively for several hours. Thus, unlike classical CIL, our results unveil a mechanism in which the asymmetric expression of different cadherins enables cells to retain adhesion while controlling front/rear polarization of the leading cell. This dual mechanism of ongoing repulsion of CAFs by cancer cells and physical coupling of the cancer cells to the CAFs can explain the persistent and collective outward migration of fibroblasts and cancer cells (Supplementary Figure 8b – yellow arrows indicate directional guidance and orange arrows with border points of force transmission).
FIB-SEM analysis of heterotypic contact zones revealed a complex interface between cancer cells and CAFs, possibly suggesting a diversity of molecular interactions between the two cell types. It is likely that contact-mediated interactions at the cancer cell-CAF interface trigger numerous changes in cell signaling; indeed Eph-Ephrin signaling has been reported following heterotypic tumor-stroma contact15. We also observed nectins and afadin at heterotypic contact sites and afadin depletion prevented CAF re-polarization.
Our finding that impairing the E-cadherin/N-cadherin interaction abrogates cancer cell invasion highlights the potential of targeting this interaction to interfere with the dissemination of cancers that metastasize while retaining epithelial characteristics. The absence of such junctions in normal tissue where E-cadherin and N-cadherin expressing cells are separated by a basement membrane makes its targeting particularly appealing. While it may be problematic to disrupt E-cadherin or N-cadherin, the nectin/afadin axis may represent a relatively specific target. To conclude, we show that a physical force applied through a heterophilic E-cadherin/N-cadherin junction enables the cooperative invasion of CAFs and cancer cells through a double mechanism: CAFs favor invasion of cancer cells by pulling them away from the tumor, while cancer cells further enhance their spread by polarizing CAF migration away from the tumor.
Methods
Cell cultureHuman vulval CAFs61 were isolated from patient tissue samples and immortalized by pBABE-Hygro-HTERT retroviral transfection. Stably labeled CAFs were obtained by using a lentiviral CAGAP-mcherry construct. CAFs were cultured in DMEM supplemented with 10% FCS and 1% insulin–transferrin–selenium (Invitrogen, #41400-045) and 100 U/ml penicillin, 100 μg/ml streptomycin. A431 are a human epidermoid carcinoma cell line described in ATCC collection. A431 cells are cells were grown in DMEM supplemented with 10% FCS, 100 U/ml penicillin, 100 μg/ml streptomycin. Primary human lung
Europe PMC Funders Author Manuscripts
fibroblasts from 3 adenocarcinoma patients were cultured as previously described62,63 in DMEM-based culture medium supplemented with 10% FBS. Lung CAFs were obtained with the informed patient consent and with the approval of the Ethics Committees of the Universitat de Barcelona and the Hospital Clínic. Three days before experiments, lung CAFs and lung normal fibroblasts were pre-activated with 2.5 ng/ml of TGF-β1 (R&D Systems) to render a phenotype similar to that found in vivo62. H1437 cells were grown in RPMI supplemented with 10% FCS, 100 U/ml penicillin, 100 μg/ml streptomycin. VSCC4 and VCAF4 were isolated from a vulval squamous cell carcinoma patient following Research Ethics Committee approval 15/EE/0151and OCAF2 were isolated from an oral squamous cell carcinoma patient following Research Ethics Committee approval CCR 2924 (St Mary’s REC). FaDu cells are pharynx SCC cell line described in ATCC collection. Cell lines used in this study are not listed in the database of commonly misidentified cell lines maintained by ICLAC, and they were not authenticated. Cell lines were tested for mycoplasma
contamination. Stable cell lines
E-cadherin, P-cadherin, E-/P-cadherin double, and α-catenin CRISPR-Cas9 A431 cells were generated as follows. Gene-specific guide RNA (gRNA) and Cas9 expression vectors were purchased from Santa Cruz Biotechnology or constructed by designing gRNA using gRNA designing tool (Feng Zhang’s lab). Plasmids with different gRNA sequences targeting E-cadherin, P-cadherin or α-catenin were transfected together into A431 cells using Xtremegene HP DNA transfection reagent (Roche) according to the manufacturer’s recommendation. 48 hours after transfection, GFP-positive cells were sorted by FACS into 96-well plates for single colony isolation. Target gene deleted clones were screened by western blot with E-cadherin, P-cadherin or α-catenin antibody, and insertion/deletion (InDel) of the target sites was analyzed by sequencing of genomic DNA using the following primers: E-cadherin seq 1 forward: GCTCTGAGGAGTGGTGCATT, E-cadherin seq 1 reverse: GATCCCCAAATCTGCGTAAA, E-cad seq 2 forward:
ACTGTGCCCAGTCGAGAAGT, E-cadherin seq 2 reverse:
GATTCAGTCCCAGACGGTGT, P-cadherin seq 1: CCTCGTGGCGCTGGACCAAT, α-catenin seq 1: CTGTGTAACAAGAGGCTCCAA.
E-cad-Ruby-WT or E-cad-Ruby-W2A expressing plasmids were transfected into A431-EcadKO cells using Lipofectamine 2000 according to the manufacturer’s recommendation. Forty-eight hours after transfection, cells started to be selected by G418. After 2 weeks of selection, cells with Ruby signal were sorted and collected by FACS.
α-catenin -mCherry-WT or -ΔVBS lentiviral plasmid was transfected into 293FT cells together with plasmids encoding RRE, REV and VSVG using ProFection Mammalian Transfection System-Calcium Phosphate (Promega) according to the manufacturer’s recommendation. Medium was changed 24 hours after transfection. After another 24 hours of incubation, viral supernatant was collected and purified by passing through 0.4 μm filter, and added to A431-αCatKO cells. Seventy-two hours after transfection, cells started to be selected by puromycin for 2 days. Selected mCherry positive cells were then sorted and collected by FACS.
Europe PMC Funders Author Manuscripts
To generate CAFs stably expressing N-cadherin-GFP, CAFs were infected with N-cad-GFP containing lentiviral vector which was produced by transfecting lentiviral plasmid as well as VSVG, RRE and REV encoding plasmids into 293FT cells. Seventy-two hours after infection, CAFs were selected by puromycin. After 2 days of selection, the cells were sorted for GFP and collected by FACS.
Characterization of all stable cell lines can be found in Supplementary Figure 4. 2D spheroid assay
By using an Ultra Low Attachment 96-well round-bottomed plate (Corning, NY) a cell suspension at concentration of 0.5×10⁴ A431 cells per well was cultured in a total volume of 200µl of complete medium. After 2 days of culture, 500µm diameter spheroids were seeded on the Fibronectin-coated polyacrylamide gel overnight at 37ºC. After spheroid attachment on the TFM substrate, a suspension of CAFs (0.3×10⁴ cells/well) was added. CAFs were then allowed to attach before the beginning of experiments.
siRNA and transfections
CAFs and A431 cells were cultured in standard conditions and transfected using
Lipofectamine RNAiMAX Reagent (Life Technologies, #13778-075). Cells were plated at 60% confluence and subjected to transfection the following day using 50 picomoles of a pool of 3 siRNAs and used 72 hours after transfection. siRNA was purchased from Life Technologies and sequences are listed below: N-cadherin, Gene: CDH2, siRNA: #s2771, #s2772, #s2773, sequence 5’-3’:
GUGCAACAGUAUACGUUAAtt,GGGUAAUCCUCCCAAAUCAtt,GAACAUAUGUGAU GACCGUtt, siRNA CT Negative control siRNA, #4390843, Afadin, Gene: MTTL4, siRNA: #144142, # 144143, #144144, sequence 5’-3’: CCUGAUAUGCGAAUGGCUGUtt,
GGUGGUUAUGAAACGACGGtt, CCUCUAGUUGUACAACUGAtt, Cadherin 11, Gene: CDH11 siRNA: #s2798, #s2799, #s2800, sequence 5’-3’:
CGACAGAUUUUUCACUAUUtt, CCACCAAAGUUUCCGCAGAtt,
GAAUCCUGAUGGUAUCAAUtt. To visualize N-cadherin in CAFs and E-cadherin in A431 cells during time lapse experiments, unless stated otherwise cells were transfected with the N-cadherin-EGFP Plasmid (Addgene, #18870) and E-cadherin Ruby Plasmid (from Kurt Anderson’s lab) respectively two days before experiments using the Neon transfection device according to the manufacturer’s instructions (Invitrogen).
QRT-PCR
QRT-PCR was used to determine the expression of mRNAs of interest relative to a control mRNA. Platinum SYBR Green qPCR SuperMix-UDG with Rox (Invitrogen) was used in conjunction with a 7900HT Fast Real-Time PCR system (Applied Biosystems). Primer sequences: E-cadherin: Forward TCACCACTGGGCTGGACCGA, Reverse
TACAGCCTCCCACGCTGGGG, P-cadherin: Forward TTCCGCTGTAGCCGCAAGGC, Reverse GTTGAGGCCCCAGCGAACCC, N-cadherin: Forward
TCAAACACAGCCACGGCCGT, Reverse CGGTCTGGATGGCGAACCGT.
Europe PMC Funders Author Manuscripts
3D invasion assay
A431 and CAF cells were removed from the cell culture dishes with trypsin and re-suspended in sterile 0.25% methylcellulose solution in DMEM. The cellulose solution contained a 1:1 ratio of A431 and CAF cells at a concentration of 1×10⁶ cells per ml. 20 μl droplets were plated onto the underside of a 10 cm culture dish and allowed to form spheroids in a 37 °C incubator overnight. The spheroids were then embedded in a collagen I/ matrigel gel mix at a concentration of approximately 4 mg/ml collagen I and 2 mg/ml Matrigel (BD Bioscience) in 24-well glass-bottomed cell culture plates (MatTek) on a 37C hot block. The gel was incubated for at least 30 min at 37°C with 5% CO2. The gel was covered with DMEM media containing 10 % FCS. 60 hours later, the spheroids embedded in the gel were washed with PBS then fixed for 20 min at room temperature with 4% paraformaldehyde. The spheroids were then imaged with an inverted Zeiss LSM780 at a magnification of 10×, 20× and 63×. 100-150 μm of z stack images were collected and image stacks were processed by ZEN software (Carl Zeiss) to yield maximum-intensity
projections.
Polyacrylamide gel preparation
Polyacrylamide gels (PA) with a Young’s modulus of 6 kPa were prepared as described previously64 Briefly, of a solution containing of 7.5% acrylamide (BioRad, #161-0140), 0.06% bis-acrylamide (BioRad,#161-0140), 0.5% ammonium persulphate, 0.05% tetramethylethylenediamine, 1.4% of 200-nm-diameter green fluorescent carboxylate-modified beads (Invitrogen, #F8811) was prepared and allowed to polymerize. The thickness of the polymerized gel was set as approx. 100µm height by using 12µl drop of the
polyacrylamide solution covered by a 12mm glass coverslip. After polymerization, the gel surface was activated with Sulfo-SANPAH (Thermo-Scientific) and coated with 40µg/ ml of Fibronectin (Sigma, # F0895) overnight.
Immunostainings
Cells were fixed with 4% paraformaldehyde for 10 min and permeabilized in 0.1% Triton X-100 for 10 min. Cells were blocked in 1% BSA for 1 hour before being incubated for 2 hour with primary antibodies. After incubation 2 hours with the appropriate fluorescence-conjugated secondary antibodies, cells were washed and mounted in Mowiol reagent. Images were acquired with a Nikon C1Si confocal microscope with a spinning disk confocal unit (CSU-W1, Yokogawa), a Zyla sCMOS camera (Andor) and a 60× objective oil
immersion (NA=1.42). Tissue section sample preparation
Human head and neck squamous cell carcinoma samples were collected under ethical approval CCR 2924 (St Mary’s REC) and stained as previously described65. Briefly, fresh frozen sections were fixed in 4% paraformaldehyde, permeablised in 0.2% TX100, and stained with the following antibodies: anti-E-cadherin monoclonal antibody (HECD-1 Crick Institute hybridoma cell services), anti-β-catenin (Santa Cruz #sc7963), anti-p120catenin (BD Biosciences #610133), anti-Afadin (Atlas Ab # HPA030212, anti-αSMA (Sigma #A2547), anti-active integrin β1 (9EG7 BD Pharmingen #556048), and anti-fibronectin
Europe PMC Funders Author Manuscripts
(Sigma #F3648). Section were mounted using MOWIOL reagent and imaged using a Zeiss LSM 780.
Antibodies, drugs and reagents
The primary antibodies used were: anti-E-cadherin monoclonal antibody (HECD-1, Crick Institute hybridoma cell services), anti-N-cadherin monoclonal antibodies (clone 014, Sino Biological, #11039-H08H or clone 8C11, Thermo Scientific, #MA1-2002), anti-P-cadherin monoclonal antibody (clone 6A9, Upstate MerckMillipore, #05-916), anti-β-catenin monoclonal antibody (clone 14, BD Transduction Laboratories, #610153), anti-β-catenin polyclonal antibody (Thermo Scientific, #71-2700), anti-β-catenin monoclonal antibody (Santa Cruz Biotechnology, #sc7963), anti-Cadherin-11 monoclonal antibody (CadherinOB, Thermo scientific, clone 16A, #MAI-06306), blocking antibody anti- E-cadherin
monoclonal antibody (DECMA-1, Sigma, #U3254). anti-Nectin3 polyclonal antibody (C-19, Santa cruz biotechnology, #sc-14806), anti-Nectin2 monoclonal antibody (clone B-C12, abcam, #ab27344), anti-Afadin polyclonal antibody (anti-MLLT4, Sigma, #HPA030212), anti-alpha-catenin monoclonal antibody (clone (15D9), Enzo life science, #ALX-804-101-C100), anti-Vinculin polyclonal antibody (phospho Y821, abcam, #ab 61071), Alexa fluor 647 Phalloidin (Thermo fischer scientific, #A22287), anti-active beta1 integrin (BD Pharmingen #556048), anti-fibronectin (SIGMA, #F3648), anti-actin (SIGMA, #a3853), anti-alpha smooth muscle actin (SIGMA, #A2547). The secondary antibodies used for immunofluorescence were: Alexa Fluor 647 anti-rabbit (Life Technology. #A-21245) or Alexa Fluor 488 anti-rabbit (Life Technology. #A-21206), Alexa Fluor 488 anti-mouse (Life Technology. #A-11029) or Alexa Fluor 555 anti-mouse (Life Technology. #A-21424) and were diluted 1:400. Ethylene glycol-bis(2-aminoethylether)-N,N,N',N'-tetraacetic acid (EGTA), (Sigma, #E4378-10G). Methylcellulose 4000, (Sigma-Aldrich, #M0512). Western blotting
Protein expression levels were measured using western blotting. Cells were lysed with Laemmli 1X (Sigma) containing 2.5% β-mercaptoethanol (Biorad) and heated at 95ºC for 5 min. Next, cell lysates were loaded to 4-20% polyacrylamide gels (Bio-Rad) for
electrophoresis. Proteins were then transferred to a nitrocellulose membrane (Whatman, GE Healthcare Life Sciences), which was blocked with 5% dry milk, Tris buffer saline, 0.2% Tween, and incubated with primary antibodies (overnight at 4ºC) followed by Horseradish-peroxidase-coupled secondary antibodies (Jackson, #715-035-151),1h at room temperature. Bands were revealed using the LumiLight kit (Roche) or with Luminata Classico (EMD Millipore) and bands were detected by ImageQuant LAS4000 (GE Healthcare Life Sciences). Quantification of the band intensity was performed with Image J software. The quantified data were normalized to GAPDH expression and are expressed as the average of three independent experiments (mean ± SD). Beta-tubulin or GAPDH were used as an endogenous loading controls. Anti-E-cadherin mouse monoclonal antibody (clone: HECD-1, Crick Institute hybridoma cell services) and Anti-P-cadherin rabbit polyclonal antibody (cat No.: 2130, Cell Signaling Technology), anti-Afadin polyclonal antibody (anti-MLLT4, Sigma, #HPA030212), anti-N-cadherin monoclonal antibodies (clone 014, Sino Biological, #11039-H08H or clone 8C11, Thermo Scientific, #MA1-2002), anti-Cadherin-11
Europe PMC Funders Author Manuscripts
monoclonal antibody (CadherinOB, Thermo scientific, clone 16A, #MAI-06306), anti-beta tubulin monoclonal antibody (Sigma, #T7816) were used.
Magnetocytometry
Bead pulling experiments were performed using magnetic tweezers as previously
described19,66. Briefly, 4.47 µm diameter ferromagnetic beads with carboxyl surface groups (Spherotech, Lake Forest, IL) were covalently coated with a 32µg/ml solution of purified E-cadherin–Fc (Creative Biomart, #CDH1-274H), P-E-cadherin–Fc (R&D Systems, #861-PC) or N-cadherin–Fc (Creative Biomart, #CDH2-315H) proteins. Beads were first washed with Na phosphate buffer (0.1 M, pH 8), incubated with 32 μg/ml of the Fc-tagged proteins for 5 h at 4ºC and then with crosslinking buffer for 1 h (25 mM DMP, 0.2 M triethanolamine, pH 8.2). The protein-coated beads were allowed to settle on a 70% confluent monolayer of cells for 30 min before starting the experiment. To measure the extent of reinforcement, a pulsatory force of 1Hz and 0.1 nN was applied to beads attached to cells for 4 min. The force exerted by the tweezers was calibrated from the velocity of beads in liquids of known viscosity measured as a function of the tip-bead distance and applied current, as previously described66,67. Bead movement in response to the pulsatory force was tracked using a custom-made tracking software. Stiffness of the cell–bead contact was calculated as the ratio between the amplitude of the applied force and that of the observed bead oscillation. The magnetic force generated by the magnet is restricted to the close proximity of the magnet tip66. The number of beads probed per cell was limited to two (generally only one). For β-catenin, P-cadherin or E-cadherin recruitment mediated by N-cadherin magnetic coated beads were measured using magnetic twisting cytometry as previously described19,21. For bead detachment assays, the tip of the magnetic tweezers device was used to apply a constant force of 0.5nN for 1 min on the beads attached to the cells. Then, the percentage of beads still attached to cells after force application was calculated as previously described66. For bead detachment assay with blocking antibody E-cadherin, A431 were incubated 2 hours with cell media containing 64 μg/ml (1/500 dilution) DECMA-1 antibody then washed with normal media and incubated with the beads.
Time lapse acquisition
For 2D spheroid assays, multidimensional acquisitions were performed 30 min after CAFs seeding on the attached spheroid. Fluorescence and bright field images were obtained every 10 min during at least 10 hours. Acquisitions were performed on an automated inverted microscope (Nikon Eclipse Ti, ×10 lens) equipped with thermal, CO2 and humidity control, using MetaMorph (Universal Imaging) software.
For time lapse acquisition of mixed CAFs and A431 cells, a ratio of 1:1 of the two cell types was seeded on a glass bottom well plate and allowed to adhere overnight. The following day, time lapse imaging was performed. To observe the E-cadherin/N-cadherin dynamics at the spheroid edges, spheroids of A431 cells expressing E-cadherin-Ruby were prepared as described above and seeded overnight on 6-well glass bottom plates. The following day, a solution of 0.5×10⁴ CAFs expressing N-cadherin-GFP were deposited on the glass bottom well plate containing the attached spheroid. Acquisitions were performed 7 hours after CAF seeding. For time lapse acquisition during EGTA treatment, CAFs stably expressing
Europe PMC Funders Author Manuscripts
cadherin-GFP were mixed overnight with A431 cells stably expressing E-cadherin-Ruby on glass coverslips (Ratio 1:1). After 10 minutes of acquisition, the EGTA solution was added to the medium (final concentration: 4mM). After 4 min incubation, the medium containing EGTA was washed three times with normal medium upon acquisition. Time lapse imaging on glass substrate was performed with a Nikon C1Si confocal microscope with a spinning disk confocal unit (CSU-W1, Yokogawa), a Zyla sCMOS camera (Andor) and a ×60 objective oil immersion (NA=1.42) or using a ×40 objective, 1.3 NA oil Plan-Apochromat immersion lens on LSM 710 Zeiss confocal microscope.
Traction force microscopy
Traction forces were computed using Fourier-transform traction microscopy with finite gel thickness as previously described29. Force unbalance was computed as the traction integral over the area occupied by the cell. For this purpose, masks were generated based on the CAF fluorescence images. To measure baseline noise, the same procedure was performed on a cell free region.
Velocities and curvature analysis, contact time duration of the spheroid edge by CAFs Velocities and curvature were obtained as previously described29. CAF trajectories were tracked using the Manual Tracking plug-in from ImageJ. At each time point, CAFs in contact with the spheroid were analyzed. For each CAF the mean cell velocity and edge curvature within a range of 40 μm centered in the CAF were computed. This process was repeated on the same number of random positions over the spheroid contour (excluding CAF positions). Quantification of velocity of individual CAFs displayed in Supplementary Figures 4n and 4q were made and analyzed using the Manual Tracking and Chemotaxis Tool plug-ins from ImageJ. For quantification of velocity in 3D ECM, CAFs transfected as previously described with siRNA control or siRNA N-cadherin or control A431 cells or A431-EcadKO cells were mixed in 12-well bottom glass plate to a solution of ECM as previously described to a final density of 3×10³ cell per gel. 24 hours after polymerization of the gel time lapse imaging (1 acquisition/15 min with bright field imaging) was acquired with a Nikon C1Si confocal microscope with a spinning disk confocal unit (CSU-W1, Yokogawa), a Zyla sCMOS camera (Andor) and a ×10 objective. Tracking of cells was performed with Image J manual tracking plug-in over around 30 slides and cell velocity was calculated as the accumulated distance/total time acquired.
Gel contraction assay
CAFs or normal fibroblasts were mixed with a solution of ECM previously described to a final density of 7×10⁴ cells/gel and seeded in 24-bottom glass well plate. After 1 hour of gel polymerization cell culture media was added to the gels. Measurement of the percentage of contraction of the gel was performed using Polygon selection function in Image J by taking the initial area of the gel as reference (D0, day 0). Gel contraction was then quantified 24 hours and 48 hours after polymerization (D1=day 1, D2=day 2). For each condition, for each independent experiment gels were analyzed in triplicate.
Europe PMC Funders Author Manuscripts
Measurement of heterotypic contact time
An amount of 25,000 A431 cells (E-cadherin-Ruby or α-catenin-mCherry) and 30,000 N-cadherin-GFP CAFs were seeded into each side of 2-well culture insert (ibidi) on a glass bottom dish and cultured for 24h. Then the insert was removed and complete culture medium was added. Fourteen hours later, the medium was changed to phenol red-free DMEM with 10% FBS and 1% ITS. Time-lapse images of Ruby/mCherry and GFP signals at A431-CAF contact sites were acquired at 5 min intervals using a ×40 objective, 1.3 NA oil Plan-Apochromat immersion lens on LSM 710 Zeiss confocal microscope. The quantification of life-time of E-cadherin/N-cadherin contact was based on fluorescent colocalization at A431-CAF interfaces. Three classes of duration time were defined: longer than 60 min (>60), between 30 to 60 min (30-60) and less than 30 min (<30).
Statistics
Unless otherwise specified, statistical comparisons were then performed by using parametric t-tests or non-parametric Mann-Whitney’s test. Unless otherwise specified, all data shown are mean ±s.e.m. Statistical differences between distributions were performed using the Kolmogorof-Smirnov test or Chi square test as indicated in figure legends.
Super-resolution Optical Imaging
For STORM imaging cells were seeded and immunostained as described above. Images were acquired using a Nikon N-STORM 4.0 system configured for total internal reflection fluorescence (TIRF) imaging. Excitation inclination was tuned to adjust focus and to maximize the signal-to-noise ratio. Fluorophores were excited illuminating the sample with the 647 nm (~160 mW), and 488 nm (~80 mW) laser lines built into the microscope. Fluorescence was collected by means of a Nikon ×100, 1.4NA oil immersion objective and passed through a quad-band-pass dichroic filter (97335 Nikon). Images were recorded onto a 256×256 pixel region (pixel size 160 nm) of a sCMOS camera (Hamamatsu). Alexa647 and Alexa488 channels were recorded sequentially and absence of cross-talk under these conditions verified. Samples were kept in OxEA buffer for STORM imaging as previously described68. Single molecule localization sequences were analyzed with the STORM plugin of NIS element Nikon software. Structured Illumination Microscopy was performed using a Zeiss ELYRA system as previously described69.
Intravital imaging
An amount of 3-5×10⁵ cells (1:1 mixture of vCAF2b-YPet and A431-mCherry) were injected intradermally in the ear of a Nu/Nu mouse in PBS + 50% matrigel in a volume of 10μl with an insulin syringe. At 4 and 7 days post-injection the animal was anaesthetised (isoflow) for intravitial imaging and the ear immobilised with tape to prevent movement artefacts. Imaging was performed using the Inverted Zeiss LSM 780 multiphoton laser scanning confocal microscope in lambda mode with the 561nm 1P-laser and the 2P-laser at 930nm followed by spectral unmixing with Zen software.
Mice were female and between 6-12 weeks old. Experiments were carried out under Home Office Project Licence 70/8380, which passed ethical review by the LRI Animal Welfare Ethical Review Board in 2014. No statistical method was used to predetermine sample size.
Europe PMC Funders Author Manuscripts
The experiments were not randomized. The Investigators were not blinded to allocation during experiments and outcome assessment.
Electron microscopy
For Transmission Electron Microscopy (TEM), cells were fixed in 4% paraformaldehyde/ 2.5% glutaraldehyde in 0.1 M phosphate buffer (pH 7.4), following incubation in reduced osmium tetroxide for 1 hour followed by 1% tannic acid in 0.05 M sodium cacodylate for 45 minutes. Ultra-thin sections were cut on a UCT ultramicrotome (Leica Microsystems UK) and stained with lead citrate before being examined in a JEOL 1010 microscope and imaged with a Bioscan CCD (Gatan UK). For Focused Ion Beam Scanning Electron Microscope (FIB-SEM) A431 cells and CAF spheroids were prepared and imaged as described previously70. Briefly, a Zeiss NVision 40 FIB-SEM was used to image the volume of interest. The sample was embedded in resin with a heavy metal stain added to provide electron contrast. A focused beam of ions was used to remove thin layers of material from the block-face, allowing sequential SEM imaging at 50nm intervals through the volume.
Supplementary Material
Refer to Web version on PubMed Central for supplementary material.
Acknowledgments
We thank Natalia Castro for technical assistance, Johan de Rooij for plasmids, and Soledad Pérez-Amodio for dermal fibroblasts, Noemi Reguart and Marta Gabasa for lung fibroblasts, and Andreas Schertel (Zeiss) for assistance with the FIB-SEM. This work was supported by the Spanish Ministry of Economy and Competitiveness (BFU2012-38146 to XT, BFU2011-23111 to PR-C, IJCI2014-19843 to AL), the Generalitat de Catalunya (2014-SGR-927 to XT), and the European Research Council (StG-CoG-616480 to XT), Obra Social “La Caixa”, Marie-Curie action (CAFFORCE 328664 to AL), and EMBO Long-term fellowship (EMBO ALTF 1235-2012 to AL), a Career Integration Grant within the seventh European Community Framework Programme
(PCIG10-GA-2011-303848 to PR-C), Fundació la Marató de TV3 (project 20133330 to PR-C), and AXA research fund (LA). ES, EA, AW, and SD are funded by the Francis Crick Institute which receives its core funding from Cancer Research UK (FC001144), the UK Medical Research Council (FC001144), and the Wellcome Trust (FC001144). TK is funded by Marie-Curie action (HeteroCancerInvaison # 708651) and the Japanese Strategic Young Researcher Overseas Visits Program for Accelerating Brain Circulation.
References
1. Cheung KJ, Gabrielson E, Werb Z, Ewald AJ. Collective invasion in breast cancer requires a conserved basal epithelial program. Cell. 2013; 155:1639–1651. [PubMed: 24332913] 2. Friedl P, Locker J, Sahai E, Segall JE. Classifying collective cancer cell invasion. Nat Cell Biol.
2012; 14:777–783. [PubMed: 22854810]
3. Fischer KR, et al. Epithelial-to-mesenchymal transition is not required for lung metastasis but contributes to chemoresistance. Nature. 2015
4. Zheng X, et al. Epithelial-to-mesenchymal transition is dispensable for metastasis but induces chemoresistance in pancreatic cancer. Nature. 2015
5. Gaggioli C, et al. Fibroblast-led collective invasion of carcinoma cells with differing roles for RhoGTPases in leading and following cells. Nat Cell Biol. 2007; 9:1392–1400. [PubMed: 18037882]
6. Harney AS, et al. Real-Time Imaging Reveals Local, Transient Vascular Permeability, and Tumor Cell Intravasation Stimulated by TIE2hi Macrophage-Derived VEGFA. Cancer Discov. 2015; 5:932–943. [PubMed: 26269515]
Europe PMC Funders Author Manuscripts
7. Kalluri R, Zeisberg M. Fibroblasts in cancer. Nat Rev Cancer. 2006; 6:392–401. [PubMed: 16572188]
8. Olumi AF, et al. Carcinoma-associated fibroblasts direct tumor progression of initiated human prostatic epithelium. Cancer Res. 1999; 59:5002–5011. [PubMed: 10519415]
9. Conklin MW, Keely PJ. Why the stroma matters in breast cancer: insights into breast cancer patient outcomes through the examination of stromal biomarkers. Cell Adh Migr. 2012; 6:249–260. [PubMed: 22568982]
10. Allinen M, et al. Molecular characterization of the tumor microenvironment in breast cancer. Cancer Cell. 2004; 6:17–32. [PubMed: 15261139]
11. Oh E-Y, et al. Extensive rewiring of epithelial-stromal co-expression networks in breast cancer. Genome Biol. 2015; 16:128. [PubMed: 26087699]
12. Orimo A, et al. Stromal fibroblasts present in invasive human breast carcinomas promote tumor growth and angiogenesis through elevated SDF-1/CXCL12 secretion. Cell. 2005; 121:335–348. [PubMed: 15882617]
13. Pietras K, Pahler J, Bergers G, Hanahan D. Functions of paracrine PDGF signaling in the proangiogenic tumor stroma revealed by pharmacological targeting. PLoS Med. 2008; 5:e19. [PubMed: 18232728]
14. Räsänen K, Vaheri A. Activation of fibroblasts in cancer stroma. Exp Cell Res. 2010; 316:2713– 2722. [PubMed: 20451516]
15. Astin JW, et al. Competition amongst Eph receptors regulates contact inhibition of locomotion and invasiveness in prostate cancer cells. Nat Cell Biol. 2010; 12:1194–1204. [PubMed: 21076414] 16. Takai Y, Miyoshi J, Ikeda W, Ogita H. Nectins and nectin-like molecules: roles in contact
inhibition of cell movement and proliferation. Nat Rev Mol Cell Biol. 2008; 9:603–615. [PubMed: 18648374]
17. Liu Z, et al. Mechanical tugging force regulates the size of cell-cell junctions. Proc Natl Acad Sci U S A. 2010; 107:9944–9949. [PubMed: 20463286]
18. Ng MR, Besser A, Brugge JS, Danuser G. Mapping the dynamics of force transduction at cell-cell junctions of epithelial clusters. Elife. 2014; 3:e03282. [PubMed: 25479385]
19. Bazellières E, et al. Control of cell-cell forces and collective cell dynamics by the intercellular adhesome. Nat Cell Biol. 2015; 17:409–420. [PubMed: 25812522]
20. Buckley CD, et al. Cell adhesion. The minimal cadherin-catenin complex binds to actin filaments under force. Science. 2014; 346 1254211.
21. Barry AK, et al. α-catenin cytomechanics--role in cadherin-dependent adhesion and mechanotransduction. J Cell Sci. 2014; 127:1779–1791. [PubMed: 24522187]
22. Abercrombie M. Contact inhibition and malignancy. Nature. 1979; 281:259–262. [PubMed: 551275]
23. Davis JR, et al. Inter-cellular forces orchestrate contact inhibition of locomotion. Cell. 2015; 161:361–373. [PubMed: 25799385]
24. Huttenlocher A, et al. Integrin and cadherin synergy regulates contact inhibition of migration and motile activity. J Cell Biol. 1998; 141:515–526. [PubMed: 9548728]
25. Scarpa E, et al. Cadherin Switch during EMT in Neural Crest Cells Leads to Contact Inhibition of Locomotion via Repolarization of Forces. Dev Cell. 2015; 34:421–434. [PubMed: 26235046] 26. Tanaka M, Kuriyama S, Aiba N. Nm23-H1 regulates contact inhibition of locomotion, which is
affected by ephrin-B1. J Cell Sci. 2012; 125:4343–4353. [PubMed: 22718351]
27. Maruthamuthu V, Sabass B, Schwarz US, Gardel ML. Cell-ECM traction force modulates endogenous tension at cell-cell contacts. Proc Natl Acad Sci U S A. 2011; 108:4708–4713. [PubMed: 21383129]
28. Tambe DT, et al. Collective cell guidance by cooperative intercellular forces. Nat Mater. 2011; 10:469–475. [PubMed: 21602808]
29. Trepat X, et al. Physical forces during collective cell migration. Nat Phys. 2009; 5:426–430. 30. Vedula SRK, et al. Epithelial bridges maintain tissue integrity during collective cell migration. Nat
Mater. 2014; 13:87–96. [PubMed: 24292420]
Europe PMC Funders Author Manuscripts
31. Nieman MT, Kim JB, Johnson KR, Wheelock MJ. Mechanism of extracellular domain-deleted dominant negative cadherins. J Cell Sci. 1999; 112(Pt 1):1621–1632. [PubMed: 10212155] 32. Katsamba P, et al. Linking molecular affinity and cellular specificity in cadherin-mediated
adhesion. Proc Natl Acad Sci. 2009; 106:11594–11599. [PubMed: 19553217]
33. Vendome J, et al. Structural and energetic determinants of adhesive binding specificity in type I cadherins. Proc Natl Acad Sci U S A. 2014; 111:E4175–84. [PubMed: 25253890]
34. Thomson S, et al. Epithelial to mesenchymal transition is a determinant of sensitivity of non-small-cell lung carcinoma non-small-cell lines and xenografts to epidermal growth factor receptor inhibition. Cancer Res. 2005; 65:9455–9462. [PubMed: 16230409]
35. Tabdili H, et al. Cadherin-dependent mechanotransduction depends on ligand identity but not affinity. J Cell Sci. 2012; 125:4362–4371. [PubMed: 22718345]
36. Weber GF, Bjerke MA, DeSimone DW. A mechanoresponsive cadherin-keratin complex directs polarized protrusive behavior and collective cell migration. Dev Cell. 2012; 22:104–115. [PubMed: 22169071]
37. Le Duc Q, et al. Vinculin potentiates E-cadherin mechanosensing and is recruited to actin-anchored sites within adherens junctions in a myosin II-dependent manner. J Cell Biol. 2010; 189:1107– 1115. [PubMed: 20584916]
38. Yonemura S, Wada Y, Watanabe T, Nagafuchi A, Shibata M. α-Catenin as a tension transducer that induces adherens junction development. Nat Cell Biol. 2010; 12:533–542. [PubMed: 20453849] 39. Huveneers S, et al. Vinculin associates with endothelial VE-cadherin junctions to control
force-dependent remodeling. J Cell Biol. 2012; 196:641–652. [PubMed: 22391038]
40. Twiss F, et al. Vinculin-dependent Cadherin mechanosensing regulates efficient epithelial barrier formation. Biol Open. 2012; 1:1128–1140. [PubMed: 23213393]
41. Ikeda W, et al. Tage4/Nectin-like molecule-5 heterophilically trans-interacts with cell adhesion molecule Nectin-3 and enhances cell migration. J Biol Chem. 2003; 278:28167–72. [PubMed: 12740392]
42. Perl A-K, Wilgenbus P, Dahl U, Semb H, Christofori G. A causal role for E-cadherin in the transition from adenoma to carcinoma. Nature. 1998; 392:190–193. [PubMed: 9515965] 43. Vleminckx K, Vakaet L, Mareel M, Fiers W, Van Roy F. Genetic manipulation of E-cadherin
expression by epithelial tumor cells reveals an invasion suppressor role. Cell. 1991; 66:107–119. [PubMed: 2070412]
44. Egeblad M, Nakasone ES, Werb Z. Tumors as organs: complex tissues that interface with the entire organism. Dev Cell. 2010; 18:884–901. [PubMed: 20627072]
45. McMillin DW, Negri JM, Mitsiades CS. The role of tumour-stromal interactions in modifying drug response: challenges and opportunities. Nat Rev Drug Discov. 2013; 12:217–228. [PubMed: 23449307]
46. Mueller MM, Fusenig NE. Friends or foes - bipolar effects of the tumour stroma in cancer. Nat Rev Cancer. 2004; 4:839–849. [PubMed: 15516957]
47. Condeelis J, Pollard JW. Macrophages: obligate partners for tumor cell migration, invasion, and metastasis. Cell. 2006; 124:263–266. [PubMed: 16439202]
48. Erez N, Truitt M, Olson P, Arron ST, Hanahan D. Cancer-Associated Fibroblasts Are Activated in Incipient Neoplasia to Orchestrate Tumor-Promoting Inflammation in an NF-kappaB-Dependent Manner. Cancer Cell. 2010; 17:135–147. [PubMed: 20138012]
49. Hanahan D, Coussens LM. Accessories to the crime: functions of cells recruited to the tumor microenvironment. Cancer Cell. 2012; 21:309–322. [PubMed: 22439926]
50. Apostolopoulou M, Ligon L. Cadherin-23 mediates heterotypic cell-cell adhesion between breast cancer epithelial cells and fibroblasts. PLoS One. 2012; 7:e33289. [PubMed: 22413011] 51. Omelchenko T, et al. Contact interactions between epitheliocytes and fibroblasts: formation of
heterotypic cadherin-containing adhesion sites is accompanied by local cytoskeletal reorganization. Proc Natl Acad Sci U S A. 2001; 98:8632–8637. [PubMed: 11447275] 52. Ounkomol C, Yamada S, Heinrich V. Single-cell adhesion tests against functionalized
microspheres arrayed on AFM cantilevers confirm heterophilic E- and N-cadherin binding. Biophys J. 2010; 99:L100–2. [PubMed: 21156120]
Europe PMC Funders Author Manuscripts
53. Straub BK, et al. E-N-cadherin heterodimers define novel adherens junctions connecting endoderm-derived cells. J Cell Biol. 2011; 195:873–887. [PubMed: 22105347]
54. Volk T, Cohen O, Geiger B. Formation of heterotypic adherens-type junctions between L-CAM-containing liver cells and A-CAM-L-CAM-containing lens cells. Cell. 1987; 50:987–994. [PubMed: 3621349]
55. Wang H, et al. The osteogenic niche promotes early-stage bone colonization of disseminated breast cancer cells. Cancer Cell. 2015; 27:193–210. [PubMed: 25600338]
56. Fagotto F. The cellular basis of tissue separation. Development. 2014; 141:3303–3318. [PubMed: 25139853]
57. Benham-Pyle BW, Pruitt BL, Nelson WJ. Cell adhesion. Mechanical strain induces E-cadherin-dependent Yap1 and β-catenin activation to drive cell cycle entry. Science (80-. ). 2015; 348:1024– 1027.
58. Abercrombie M, Heaysman JE. Observations on the social behaviour of cells in tissue culture. I. Speed of movement of chick heart fibroblasts in relation to their mutual contacts. Exp Cell Res. 1953; 5:111–131. [PubMed: 13083622]
59. Carmona-Fontaine C, et al. Contact inhibition of locomotion in vivo controls neural crest directional migration. Nature. 2008; 456:957–961. [PubMed: 19078960]
60. Theveneau E, et al. Chase-and-run between adjacent cell populations promotes directional collective migration. Nat Cell Biol. 2013; 15:763–772. [PubMed: 23770678]
61. Calvo F, et al. Mechanotransduction and YAP-dependent matrix remodelling is required for the generation and maintenance of cancer-associated fibroblasts. Nat Cell Biol. 2013; 15:637–646. [PubMed: 23708000]
62. Puig M, et al. Matrix stiffening and β1 integrin drive subtype-specific fibroblast accumulation in lung cancer. Mol Cancer Res. 2015; 13:161–173. [PubMed: 25280968]
63. Vizoso M, et al. Aberrant DNA methylation in non-small cell lung cancer-associated fibroblasts. Carcinogenesis. 2015
64. Serra-Picamal X, et al. Mechanical waves during tissue expansion. Nat Phys. 2012; 8:628–634. 65. Hidalgo-Carcedo C, et al. Collective cell migration requires suppression of actomyosin at cell–cell
contacts mediated by DDR1 and the cell polarity regulators Par3 and Par6. Nat Cell Biol. 2011; 13:49–58. [PubMed: 21170030]
66. Roca-Cusachs P, Gauthier NC, Del Rio A, Sheetz MP. Clustering of alpha(5)beta(1) integrins determines adhesion strength whereas alpha(v)beta(3) and talin enable mechanotransduction. Proc Natl Acad Sci U S A. 2009; 106:16245–16250. [PubMed: 19805288]
67. Kollmannsberger P, Fabry B. High-force magnetic tweezers with force feedback for biological applications. Rev Sci Instrum. 2007; 78:114301. [PubMed: 18052492]
68. Nahidiazar L, et al. Optimizing Imaging Conditions for Demanding Multi-Color Super Resolution Localization Microscopy. PLoS One. 2016; 11:e0158884. [PubMed: 27391487]
69. Madsen CD, et al. STRIPAK components determine mode of cancer cell migration and metastasis. Nat Cell Biol. 2014; 17:68–80. [PubMed: 25531779]
70. Armer HEJ, et al. Imaging Transient Blood Vessel Fusion Events in Zebrafish by Correlative Volume Electron Microscopy. PLoS One. 2009; 4:e7716. [PubMed: 19893745]
Europe PMC Funders Author Manuscripts
Figure 1. CAFs exert pulling forces on cancer cells
(a) Illustration of the 3D invasion assay (CAF, red; A431, green). (b) Confocal image of a spheroid (1:1 mixture of CAFs and A431 cells) after 60 hours of invasion. CAFs (red) led collective strands of A431 cells (green). Image representative of 6 samples. Scale bar, 100µm. (c) Magnified view of the strand highlighted in b. Scale bar, 20µm. (d) Illustration of the 2D migration assay. (e) A spheroid of A431 cells (unlabeled) 10 hours after CAF seeding (red). Image representative of >10 samples. Scale bar, 100µm. (f) Magnified view of the strand highlighted in panel e. (g) The incident angle (α) is defined as the angle between