UNIVERSITA’ DEGLI STUDI ROMA TRE
SCUOLA DOTTORALE IN GEOLOGIA DELL’AMBIENTE E DELLE RISORSE (SDiGAR)
Sezione Geologia Dell'Ambiente e Geodinamica XXVIII CICLO
PhD Candidate
Daniele La Marra
Longer vs shorter-term behavior of
Mauna Loa Volcano, Hawaii
Supervisor
Prof. Valerio Acocella
Reviewers
Dr. Yosuke Aoki
University of Tokyo
Co-supervisors
Prof. Maurizio Battaglia
Dr. Michael P. Poland
Dr. Carolina Pagli
University of Pisa
Head of the Doctoral School
Contents
Table of Contents:
Acknowledgements ... I
Abstract ... III
Chapter 1 Introduction ... 1
Chapter 2 Mauna Loa and its tectonic context ... 3
2.1 Tectonic setting ... 3
2.2 Mauna Loa ... 9
Chapter 3 Manuscript 1: Fissure distribution at Mauna Loa (Hawaii) as an
example to understand shallow magma transfer at volcanoes ... 12
Abstract ... 12
1. Introduction ... 13
2. Structure and activity of Mauna Loa ... 14
3. Methods ... 17
4. Results ... 19
4.1.1 Flank slip without dike opening (Models 1and 2) ... 21
4.1.2 Dike opening throughout the NERZ and SWRZ, without and ...
with flank motion (Models 3 and 4) ... 22
4.1.3 Dike opening along the entire NERZ without and with flank ...
motion Models 5 and 6) ... 23
4.1.4 Deep dike opening along the NERZ without and with flank
motion (Models 7 and 8) ... 25
4.1.5 Dike opening along the entire SWRZ without and with flank
motion (Models 9 and 10) ... 26
5. Discussions ... 28
6. Conclusions ... 31
Chapter 4
Manuscript 2: Deformation history of Mauna Loa (Hawaii) from 2003
to 2014 through InSAR data: understanding the longer-term processes ... 32
Abstract ... 32
1. Introduction ... 33
2. Mauna Loa ... 34
3. Methods ... 36
4. InSAR Measurements ... 40
5. Modeling of InSAR Measurements ... 44
6. Discussions ... 48
7. Conclusions ... 52
Chapter 5 Conclusions ... 53
Acknowledgements
Acknowledgements
First of all I would like to thank my supervisor Valerio Acocella giving me the great opportunity to work together and for her guidance and patience throughout the development of this project. I thank him also for his confidence in my abilities and her continued encouragement throughout my studies.
My efforts have been generously supported by the fellowship "Fondo Giovani", without their financial backing none of this would have been possible. I also thanks the Roma Tre University to given me this opportunity.
Thank you to Pof. Maurizio Battaglia for his important contribution to my work and for sharing with me his long experience on the geophysics.
Special thanks go to Dr. Michael P. Poland for providing me the opportunity to research and work at the Hawaiian Volcano Observatory about the Mauna Loa. I deeply thank you for welcoming me to the observatory immediately as a family person. In particular, I am grateful to him for having consistently supported and helped in all my PhD.
I also thanks Dr. A. Miklius and Dr. F. Trusdell (HVO-USGS) for their contribution in my work.
For the stimulating discussions, I thank Dr. F. Trusdell, Dr. P. Okubo, Dr. M. Patrik and Dr. Loren Antolik.
I am grateful to Dr. Michal Poland, Dr. F. Trusdell, M. Patrick and Dr. L. Antolik for the field trip on the Mauna Loa and Kilauea volcanoes and for their teachings.
I am deeply grateful to the HVO volunteer program (USGS) that has provided me accommodation and transport for six months at the Hawaiian National Park (HVO). Thank you to Dr. P. Lundgren for providing me the codes to process the InSAR time series.
I would like to thank my reviewers Dr. Carolina Pagli and Dr. Yosuke Aoki, who improved this thesis with every edit.
I would also like to express my gratitude to my committee members Acocella Bellatreccia, Cipollari, Corrado, Cosentino, Della Ventura, Faccenna. Funiciello, Gliozzi, Kotsakis, Mattei, Mazza, Molin, Romano, Rossetti, Salvini, Tuccimei.
I would also like to thank my examiners Prof. Vincenzo Pascucci, Prof. Massimiliano Zattin and Dr. Luca Caricchi for taking the time out of their busy schedules to read and analyze my thesis.
Special thanks go to others PhD students of Roma Tre University for their friendship, help and support. In particular I thanks Daniele Trippanera, Adriano Nobile, Riccardo Di Lorenzo, Umberto Susta and Silvia Campagnola.
I am infinitely grateful to Fabrizio, Enrico, Ernesto, Stefano, Pierfrancesco, Giuseppe for their friendship, moral support over the years.
Lastly, a special and deeper thanks go to my girlfriend Monika for her continued help, support and for having given birth to my daughter Elisa. Moreover, I would like to thank my my mother Milena, my grandmother Emilia and my sister Simona, for their never failing support. I could never thank you enough for all the help you provided.
Abstract
Abstract
Almost all eruptions are preceded by periods of unrest characterized by anomalies including seismicity, deformation, and degassing of the volcano. Understanding unrest allows one to unravel the behavior and operating principles within a volcano, which is an intermediate and fundamental step to forecast eruptions. Surface deformation is a crucial indicator of the unrest state of a volcano. Geodetic (InSAR, GPS, Tilt, Leveling, EDM) and seismic data characterized recent very short periods (up to a very few years) of unrest at Mauna Loa(Hawaii). However, a medium-term (decades) and a longer (thousands of years or more) reconstruction of the volcano’s evolution are lacking. Mauna Loa has a summit caldera, from which two well-developed rift zones depart, and minor radial eruptive fissures (only on the NW flank), whereas the SE flank is unstable.
I first studied the selective distribution of the radial fissures, and thus of shallow magma transfer, on the NW flank of Mauna Loa, using a numerical modelling approach. The modelling was devoted at understanding the conditions controlling the selective distribution of the radial fissures, on the longer-term (thousands of years). I simulated quiescent periods, with instability (of very few cm/yr) on the SE flank only; then I simulated volcano unrest with shallower and/or deeper magma intrusions along the rift zones that override the flank motion or, if the latter increases(for large flank earthquakes), become similar. The results suggest that the selective occurrence of the radial fissures may be explained by the competition between two processes: a) dike intrusion along the rift zones (especially along the NE Rift), promoting the development of radial dikes along the NW flank; b) flank slip, inhibiting the development of the radial dikes on the SE flank. The opening of a kinked rift zone promotes the local circumferential extension necessary to promote the feeding of radial fissures by dikes on the NW flank. An analysis of the historical radial eruptions at Mauna Loa in the last 200 years shows how these are immediately preceded by eruptions along the rift zones, confirming the modeling results.
I then used the InSAR technique to obtain the time series of deformation of Mauna Loa in order to understand the mean-term (last decade) magmatic processes. I exploited the SBAS technique, using SAR images from ENVISAT (descending and ascending orbits; 2003 - 2010) and COSMO-SkyMed (descending and ascending orbits; 2012 - 2014), to study a decade of deformation at Mauna Loa. These data have been calibrated with the GPS data available at the HVO (Hawaii Volcano Observatory).
The results show a long-term inflation of the volcano from 2003 to 2014, reaching a peak of deformation on the summit area between mid-2004 to end-2005 and then slowing down. Within this frame, I was able to identify five main periods with approximately linear deformation behavior. The inversion of the deformation data in these periods suggests the repeated, though not constant, intrusion of one or more dikes below the summit and upper Southern Rift Zone. The episodes with larger dike intrusion coincides with an acceleration of the slip flank of the SE flank of the volcano. Such a continuous injection of magma along the rift zones is a distinctive behavior of Mauna Loa and, with the possible exception of the nearby Kilauea, it has not been observed at any other volcano over the time span of decades. It is proposed that continuous, even though not constant, flank instability of the SE flank of Mauna Loa may promote semi-continuous intrusions, provided magma supply is ready.
In synthesis, on the mean-term the magma plumbing system of Mauna Loa appears characterized by the repeated dike intrusions. These, if active over longer time spans (centuries) may activate the entire rift zones, especially the kinked NERZ, promoting the development of radial dikes on the NW flank of the volcano.
Keywords: shield volcano, rift zones, dike, flank instability, Mauna Loa, InSAR,
Chapter 1 Introduction
Chapter 1
Introduction
The most important challenge for modern volcanology is to forecast eruptions; this involves the evaluation, with some degree of confidence, of the likely hazard from an impending eruption (e.g., Sparks, 2003). Fortunately, almost all eruptions are preceded by anomalous, usually elevated seismicity, deformation, and gas emission of the volcano called unrest and usually lasting from a few hours to several years. Commonly reported forms of unrest are local earthquake swarms, uplift, subsidence, tilt, ground fissuring, changes in the gravity field, changes in the temperature of soil, water or gas, and changes in fumarolic activity (Newhall and Dzurisin, 1988, and references therein; Sandri et al., 2004; Moran et al., 2011; Acocella et al., 2015). All eruptions are thus preceded by unrest, which may show variable features from volcano to volcano and even within the same volcano. However, much unrest, even when accompanied by dramatic variations in the monitoring parameters, has not been followed by any eruption, as for example at Campi Flegrei (Italy) during 1982-1984, or at Long Valley (California) during 1978-2005. Since only some unrest culminates in an eruption (e.g., Newhall and Dzurisin, 1988; Sparks et al., 2012; Phillipson et al., 2013), unrest represents a necessary but not sufficient condition to have an eruption. Thus, unrest increases the probability of an eruption, but does not push that probability to 1.0. Understanding unrest is not only important to forecast impending eruptions, but also allows one to unravel the behavior and operating principles within a volcano, which is the fundamental and intermediate step to forecast eruptions.
Surface deformation is a crucial indicator of the unrest state of a volcano. Volcanoes can be monitored and studied using geophysical methods (Tilt, Leveling, EDM, Gravimetry), including seismic and geodetic measurements (GPS and InSAR) providing information regarding the location and dynamics of subsurface magma (Schmincke, 2010; Dzurisin, 2007). In particular, these methods merged with a mathematical approach (analytical and numerical modeling) are especially useful for determining the geometry of subsurface magma storage and volume changes over
time. These methods have developed rapidly since the 1980s thanks to satellite-based technologies (Decker et al., 2008). In the early-1990s, the new space-satellite-based surface deformation monitoring technique called Interferometric Synthetic Aperture Radar (InSAR) was introduced in the Earth sciences. Using InSAR, several surface deformation processes can be studied in unparalleled spatial resolution, including earthquakes, flank instabilities, subsidence from lava accumulation, lava flow activity and/or unrest/eruptions (e.g., Poland, 2007; Poland, 2010; Poland et al., 2012; Casu et al., 2009; Amelung et al., 2007; Pepe et al., 2010; Baker and Amelung, 2012). Radar images (SAR) from ENVISAT satellite (European Space Agency) have been used for operational InSAR monitoring of Hawaiian Volcanoes by HVO since 2003. Other SAR images came from RADARSAT-1 (Canadian Space Agency), ALOS (Japanese Space Agency), TerraSAR-X (German Space Agency and Cosmo-SkyMED (Italian Space Agency). This radar technique allow detecting centimeter to millimeter scale deformation of significant portions of a volcanic edifice with respect other geodetic methods (e.g. GPS, where the spatial covering depends from the number of GPS stations). In particular, the availability of large radar image archives allows recognizing and measuring the evolution of the ground deformation with a high density of measurements, over time spans in the order of a decade or more.
Geodetic measurements, together with geophysical and geochemical data, allowed in the last twenty years to constrain the volcanic behavior and features of the magmatic plumbing systems of many volcanoes, including Kilauea (the most studied and known in the world) and the neighbor Mauna Loa. In particular, geodetic (InSAR, GPS, Tilt, Leveling, EDM) and seismic data have been used to characterize recent periods of unrest at Mauna Loa. These studies, however, are focused on relatively short-term processes (up to a very few years) and a longer-term reconstruction of the volcano’s evolution is lacking.
This thesis aims to study Mauna Loa using the recent monitoring (InSAR) and modeling (numerical modeling) techniques considering both the long- (thousands of years or more) and the short-term processes (the last decade).
Chapter 2 Mauna Loa and its tectonic context
Chapter 2
Mauna Loa and its tectonic context
2.1 Tectonic setting
The Hawaiian plume is a continuous low velocity anomaly from the TBL to the surface. Its shallowest part may consist of discrete portions, diapirs, plume lets or
filaments, with radius ~101 km and length ~102 km. Ascending mantle diapirs may be
shared by the differential motion of the lithosphere and the underlying upper mantle. The shallow plume highlights a melt-rich zone 110 to 155 km beneath Hawaii. The
101 km wide axial region of the plume is a mixture of recycled subducted components
and primitive lower mantle materials, implying vertical heterogeneity. The remainder of the plume, outside the axial region, is less heterogeneous but distinct from upper
mantle (Clague and Dalrymple, 1987; Ihinger, 1995; Farnetani and Hoffmann, 2010;
Rychert et al., 2013).
The Hawaiian-Emperor volcanic chain is the surface manifestation of the plume, nearly 6000 km long and consisting of at least 107 volcanoes with volume of ~1
million km3. Individual seamount segments along the chain may represent the
topographic expression of discrete diapirs from a single lower mantle plume (Fig. 2.1). The chain is age progressive, with active volcanoes at the SE end, and 75-80 Ma volcanoes at the NW end. The bend between the Hawaiian and Emperor chains
reflects a major change in Pacific plate motion at ~50 Ma (Clague and Dalrymple,
1987; Sharp and Clague, 2006). Age-distance data along the chain reflect minor
deviations from an overall linear trend, suggesting variations of volcanic propagation. Volume calculations highlight an increase in the hot spot activity in the last 30 Ma and, in particular, in the last 1 Ma (Vidal and Bonneville, 2004; Robinson and Eakins, 2006; Poland et al., 2012).
The Hawaiian volcanoes undergo progressive subsidence as they move further from the hot spot, becoming guyots (drowned islands). The subsidence results from the thermal aging of the oceanic lithosphere (becoming older westwards) and
additional aging after the thermal resetting induced by the hot spot. Superimposed is the significant subsidence caused by the load of the lithosphere due to the growing volcanoes.
This causes the lithosphere to sag and the Hawaiian Ridge to subside. Most volcanoes have subsided 2-4 km since reaching the sea surface, while their bases have subsided 5-8 km, so that about half of the upbuilding of the volcanoes is reduced by subsidence; the bulk of the subsidence is complete ~1 Ma after initiation of volcanism on the sea floor. Much of the Hawaiian Swell is underplated (Clague and Dalrymple, 1987; Moore, 1987; Leahy et al, 2010).
Fig. 2.1 – Bathymetric map showing the Hawaiian and Emperor Seamount chains and Hawaiian Islands in the northwest Pacific Ocean. Inset shows relief map of the Island of Hawai‘i, with the five volcanoes that make up the island. Arrow indicates plate motion velocity in millimeters per year (after Gripp and Gordon, 2002).
Chapter 2 Mauna Loa and its tectonic context
Volcanic centres on the Hawaiian Ridge align along two or more curved loci roughly parallel to the ridge and ~40 km apart, forming the "Loa" and "Kea" subchains, with geochemical variations reflecting preferential sampling of two distinct sources of deep mantle material (Weis et al., 2011). These loci mark the edges of downbending of the two sides of the lithospheric subsidence trough, where fracturing conducts magma to the surface. Both the rejuvenated onshore and the Hawaiian arc offshore volcanism can be explained by the flexing and rupture of the oceanic lithosphere, producing focused magmatic fluxes over an area two to ten times the eruption area (Moore, 1987; Bianco et al., 2005).
Hawaiian volcanoes consist of a small proportion of intrusions (<30% by volume), implying that the islands are predominately built extrusively. This building occurs during four major growth stages. The earliest is the submarine alkalic pre-shield
stage: the alkalic composition derives from a nascent magma-transport system and
less extensive melting at the plume periphery. This subsequent tholeiitic shield stage
accounts for >95% of the volume and may be ~1 Ma long. This marks the time when
a volcano is near or above the hot spot and its magma supply system is robust. Volcanism wanes as volcanoes move away from the hot spot, passing into the postshield stage. Shallow magma reservoirs (1–7 km depth) cannot be sustained, as magma supply lessens, but smaller reservoirs at 20–30 km depth persist. The rate of extrusion diminishes by a factor of 10 and the composition of lavas becomes more alkali as the degree of melting diminishes; therefore, a cap of alkalic basalt and associated differentiates covers the shield. After several Ma of erosion, alkalic rejuvenated-stage lava may erupts from isolated vents as the volcanoes override the
flexure created by loading the new shield volcano. Five Hawaiian volcanoes have
seen rejuvenated-stage volcanism following quiescent periods that ranged from 2.0 to <0.5 Ma. Hawaiian volcanoes have also been modified by giant landslides. Seventeen discrete slides formed in the past 5 Ma have been identified around the
main Hawaiian Islands (Lipman and Calvert, 2011; Flinders et al., 2013).
The volcanoes of the Hawaiian Islands become progressively younger southeastwards, from Kaui (3.9-5.8 Ma) to Hawaii (<1 Ma), with the main shield stage of a volcano becoming essentially complete before the next volcano rose above the sea. Hawaii, the largest of the Hawaiian Islands, consists of five coalesced and
overlapping volcanoes formed in the last 1 Ma, experiencing minor erosion: Kohala, Hualalai, Mauna Kea, Mauna Loa and Kilauea. Hawaii has grown at an average rate
of ~0.02 km2/yr for the past 600 ka and is presently close to its maximum size (Fig.
2.2). Kohala completed shield building at ~245 ka, Hualalai and Mauna Kea at 130 ka. The volcanoes require ~600 ka to grow from the ocean floor to the end of shield building, arriving at the ocean surface about midway (Peterson and Moore, 1987; Moore and Clague, 1992). Mauna Kea, the highest volcano, last erupted at ~3.6 ka, passing through into the post-shield stage and producing a cap of lava burying the original shield. It is uncertain if a summit caldera existed; westerly, southerly and easterly rifts are suggested by the alignment of cones (Clague and Dalrymple, 1987). Mauna Loa is the largest volcano, showing shield stage tholeiitic lava mostly issued from the summit caldera and SW and NE rift zones. Eruptive activity ranges from 700 ka at least to 1984 (Fig. 2.2). The slowing of the eruptive in the last 100 ka and the discovering of 15-20 ka alkalic submarine lavas suggest the nearing of the end of the tholeiitic shield-building stage. The current summit magma system includes at least two interconnected reservoirs, with one centred beneath the south caldera margin and the other elongated along the caldera axis (Poland et al., 2013).
Kilauea is the youngest and most active volcano of Hawaii. It consists of shield-stage tholeiitic lava issued from the summit caldera and the east and SW rift zones since ~100 ka. Supply to Kilauea’s shallow magmatic system averages about 0.1
km3/yr, but fluctuates on timescales of months to years (Fig. 2.2). Much of its present
caldera dates from the 18th century, even though an earlier collapse occurred about 1500 years ago. Whether or not magma is present within the deep rift zone, which extends from beneath the shallower rift at ~3 km depth to the base of the volcano at ~9 km depth, remains an open question, but it is likely that most magma entering Kilauea must pass through the summit reservoir system before entering the rift zones (Clague and Dalrymple, 1987; Holcomb, 1987; Langenheim and Clague, 1987; Okubo et al., 1997; Poland et al., 2013).
The active submarine volcano of Loihi, 30 km SE of Hawaii, shows the latest activity of the Hawaiian hop spot. Loihi has formed along a NNW-SSE striking rift, ~30 km long and 3 km high (Fig. 2.2). The summit has a caldera-like depression, hosting two pit craters with a near-surface summit magma chamber.
Chapter 2 Mauna Loa and its tectonic context
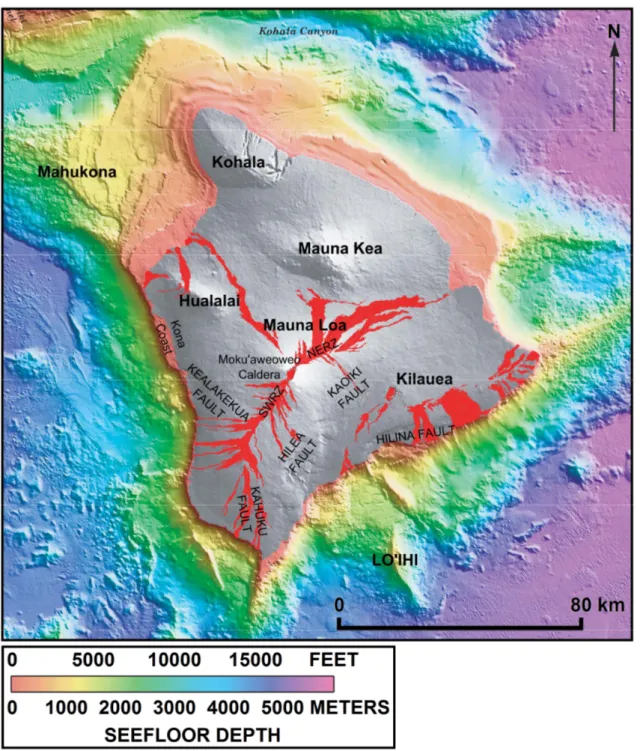
Fig. 2.2 – Map of the Island of Hawai‘i and surrounding ocean floor. Labels show the location of volcanoes, rift zones and fault zones while the red areas show the historical lava flows in the last 200 yr (after Eakins et al., 2003).
The volcano taps a relatively primitive part of the plume, producing a wide range of magma compositions reflecting higher degrees of partial melting as it drifts toward the hotspot centre (Garcia et al., 2006).
Rift zones are integral structural elements of Hawaiian volcanoes, consisting of a narrow (<2 km) and long (up to >100 km) area of focused volcanic and tectonic activity, becoming more diffuse as volcanic activity declines. The rift zones thus include spatter cones, spatter ramparts, pit craters, grabens, faults, extension fractures and fissures. At depth of 3 to 9 km, they may be underlain by a thick, near-vertical dike-like magma system, where dikes are usually intruded laterally from a central magma reservoir, propagating for tens of km without erupting (Delaney et al., 1990). The orientation of the rift zones depends on regional and local stress pattern. Long eastern-trending rift zones of Hawaiian volcanoes may follow regional fractures in oceanic crust activated by arching of the Hawaiian swell in front of the propagating hotspot. At volcanoes that grew on the flank of an already existing edifice, the orientation of rift zones is determined by the gravitational stress field influenced by the buttressing effect of the older volcano, as at Mauna Loa and Kilauea (Fiske and Jackson, 1972; Lipman and Calvert, 2011). Loihi does not follow this behavior, as its NNW-SSE trending rift zone suggests a formation beyond the gravitational influence of the adjacent older volcanoes, probably influenced by the flexure of the lithosphere (Garcia et al., 2006).
The gravitational stress on the volcano flanks develops large-scale on-shore and off-shore sliding, related to the activity of the rift zones. The M=7.2 earthquake at Kilauea on 1975 was probably related to strain accumulated throughout the south flank from dikes intruded in the rift zone (Swanson et al., 1976). However, the earthquake itself resulted from abrupt southward movement of the south flank across the underlying oceanic crust, activating the Hilina-Pali fault system. Such faulting not only provides a means for the flanks to adjust continuously to intrusions, but also generates the stress patterns needed to constrain future dikes to propagate along the rift axis. Therefore, rift intrusion and lateral spreading are major contributors to volcano growth (Peterson and Moore, 1987; Dieterich, 1988). During its early growth, Mauna Loa is also inferred to have undergone volcano spreading, activating the Kaoiki–Honuapo fault system (an analog of the Hilina fault system on Kilauea. Cumulative deformation of Mauna Loa’s south flank during growth of Kilauea since 200–300 ka involved >10 km of seaward spreading, displacing the rift zones of Kilauea while its deep plumbing system and summit magma reservoir remained
Chapter 2 Mauna Loa and its tectonic context
nearly fixed. Such an evolution of Kilauea accounts for several features, including the currently arcuate geometry of the rift zones (Lipman et al., 2006).
2.2 Mauna Loa
Mauna Loa, the largest active volcano on Earth, covering more than half the Island of Hawai'i and rising to 4,169 meters above sea level, is characterized by the effusive eruptions with lava fountains and lava flows with low viscosity, high temperature and low gas content (Fig. 2.2). These eruptive products constrain the shape of a shield volcano with low slope angles (12-20°). Mauna Loa volcano hosts the Moku’aweoweo summit caldera from witch two elongated rift zones radiate: the Northeast Rift Zone (NERZ) and the Southwest Rift Zone (SWRZ) (Fig. 2.2). Most of Mauna Loa’s eruptions begin with lava fountains from a series of fissure vents in the summit region and then often migrate to vents down either rift zone. These rift are the reflections of past dike intrusions. A more diffuse pattern of radial fissure vents is present on the northwest flank of the volcano. (Walter and Amelung, 2006; Amelung, 2007; Rubin, 1990).
Over the past 3,000 years Mauna Loa has erupted lava flows, on average, every 6 years. Since 1832, Mauna Loa has erupted 39 times producing only tholeitic lavas (Wanless et al., 2006) with the last two eruptions in 1975 and 1984, averaging one eruption every 5 years. All historically recorded Mauna Loa eruptions started in the summit area to spreading subsequently to the rift zones.
A 50-km-long system of normal faults from Hilea, Kaoiki to Honuapo area, extends across the south flank of Mauna Loa (Lipman, 1980; Fig. 2.2). This fault zone marks the boundary with the neighbor Kilauea. Mauna Loa has been characterized by repetitive dike intrusions accommodated by lateral spreading and slip on the decollement thrust fault at the base of the volcano associated with large earthquakes (Walter and Amelung, 2006). During interseismic periods, as from 1997 to 2002, the SE flank of Mauna Loa moves SE of 1-1.5 cm/yr (Miklius et al., 2005).
Compared to the widely monitored and studied Kilauea, for which a large literature is available(Poland et al., 2014 and references therein), Mauna Loa is much less knownand only a few works described its activity in the last 15 years, moreover focusing on limited time spans (e.g. Amelung et al., 2007; Walter and Amelung, 2006; Casu et al, 2009; Okubo and Wolfe, 2008; Pepe at al., 2010).
The distribution of earthquakes in the last decades shows an asismic region beneath the southeast margin of Moku'āweoweo caldera. This asismic zone suggests a possible magma chamber at more than 4 Km depth beneath the southeast margin of Moku'āweoweo caldera (Okubo, 1995; Poland, 2015). The location of this reservoir is consistent with geodetic data between 1977-81, indicating a source of inflation approximately 4 km deep (Decker et al., 1983; Lockwood et al., 1987; Poland, 2015). This is broadly consistent also with geodetic data during and after the last 1984 eruption, suggesting a source at about 3.5 km depth beneath the southeast margin of the caldera (Johnson, 1995; Miklius et al., 1995; Poland, 2015). In addition, the GPS stations on the SE flank suggest a seaward motion of about 4 cm/yr in the 1990s (Poland, 2015) and 1-1.5 cm/yr in the 1997-2002 (Miklius et al., 2005; Miklius and Cervelli, 2003; Poland, 2015). An inflation episode started in May 2002 (Miklius et al., 2005; Miklius and Cervelli, 2003) with a fast increase in the deformation rate of both flanks in mid-2004 (Miklius, et al., 2005). The best-fit models located a magma chamber under the southeastern caldera margin at 4.7-km depth below the summit with a radius of 1.1 km and a shallow dike extending the length of the caldera and into both rift zones, with most opening at 4–8 km depth (Amelung et al., 2007; Poland, 2015);
Overall, the eruptive fissures, the lava flows distribution and geochemistry and petrologic data suggest that eruptions of Mauna Loa come the from summit caldera, rift zones and additional minor radial fissures; in particular, the radial eruptive fissures are found only to the NW flank of Mauna Loa; the geochemistry of lava flows erupted from these radial vents not belonging to the rift zones have identified both primitive high-Mg lava (Riker et al., 2009) (e.g. the eruption in 1859) as well as evolved alkalic lava (Wanless et al., 2006). If the source magmas rise from the main magmatic system of Mauna Loa, the most primitive magmas (tholeiitic) erupt overlapping the most recent volcanic products. The composition of the lava flows erupted from the
Chapter 2 Mauna Loa and its tectonic context
radial vents suggests a possible second magma plumbing system that bypass the summit plumbing system connecting directly the evolved magmas from the magma chamber to the surface; conversely period with an increasing of magma supply allow primitive magmas to erupt (Poland et al., 2015 and reference therein). In addition, most of the deformation analysis has limited to short periods (a very few years), as for example single unrest and/or eruptions periods (Casu et al., 2009; Amelung et al., 2007; Pepe et al., 2010; Shirzaei et al., 2013; Miklius and Cervelli, 2003). This short-term deformation allowed inferring the transient features of the magmatic sources, but without constraining any longer-term evolution of these sources, also to understand the longer-term behavior of the volcano.
The primary goal of this thesis to give a contribute trying to solve these problems using different approaches. Following this introduction, we present two papers representing the results of our research: 1) "Fissure distribution at Mauna Loa (Hawaii) as an example to understand the longer-term shallow magma transfer at volcanoes"; 2) "Deformation history of Mauna Loa (Hawaii) from 2003 to 2014 through InSAR data”, to understand the shorter-term processes".
In the first study we used a numerical modeling approach to simulate dike intrusions along the rift zones and the flank seaward motion to correlate the stress distribution changes with past radial dikes erupted only on the NW flank of Mauna Loa. In the second study we mapped the last decade surface deformation of Mauna Loa volcano, Hawai'i, using the synthetic aperture radar images available for both Envisat and Cosmo-SkyMED (CSK) satellites from January 2003 to middle 2014 (with the lack of data between September 2010 and March 2012). The time series of deformation have been computed and interpreted in terms of recent volcanic activity. The deformation data have been used to constraint the temporal evolution of the magmatic system on the medium-term.
Chapter 3
Manuscript 1
Fissure distribution at Mauna Loa (Hawaii) as an example to understand shallow magma transfer at volcanoes
La Marra1 D., Acocella1 V., Trusdell2 F. A.
1
Department of Science, Roma Tre University, Largo S.L. Murialdo, 1, 00146 Rome, Italy
2
U.S. Geological Survey, Hawaiian Volcano Observatory, 51 Crater Rim Road, Hawai`i National Park, HI 96718-0051, U.S.A.
Abstract
Mauna Loa volcano (Hawaii) has a distinctive feature, it is characterized by minor radial eruptive fissures (not related to the two main rifts) on the NW flank only. This study tries to explain such a selective distribution of vents, and thus of shallow magma transfer. To this aim, we run numerical models with different amount of opening of the two rift zones of Mauna Loa, as well as different amount of slip on its SE flank. Our results suggest that the occurrence of the radial fissures may be explained by two competing processes: rift intrusion (especially along the NE Rift), promoting the development of radial dikes along the NW flank, and flank slip, inhibiting the development of the radial dikes on the SE flank. The opening of the two non-parallel main rift zones of Mauna Loa promotes the local extension necessary to develop the radial dikes on the NW flank. A general model for the development of a third branch of radial rift, which may be also applied to Mt. Etna and some volcanoes on the Canary Islands, is proposed.
Chapter 3 Manuscript 1
1. Introduction
Understanding magma ascent and extrusion at volcanoes is a crucial step to properly evaluate the hazard associated with volcano unrest. Eruptions may be fed by dikes, as observed at numerous active volcanoes worldwide (Acocella and Neri, 2009, and references therein). Therefore, to improve our understanding of magma transport and eruption, and associated consequences, it is fundamental to advance knowledge of dike propagation.
The general mechanisms of dike propagation have been the subject by many authors in the past decades (e.g., Anderson, 1936; Ode, 1957; Pollard, 1973; Pollard and Muller, 1976; Delaney et al., 1986; Maccaferri et al., 2011; Rivalta et al., 2015 and reference therein). The orientation of a dike is controlled by the direction of the principal stresses, with the dike orthogonal to the least compressive stress (e.g. Nakamura, 1977; Rubin and Pollard, 1988). This relation is best demonstrated in absence of prominent relief, as in flat rift zones along divergent plate boundaries (Iceland, portions of Afar). The presence of a volcanic edifice, with relief, complicates this simple dependence on the regional tectonic setting, introducing significant deviations from expected patterns. Loading by the edifice focuses the stresses above the center of a magma chamber, promoting the development of a central vent system (Pinel and Jaupart, 2003). In addition, dikes and/or fissure eruptions at many volcanic edifices show characteristic radial and/or, subordinately circumferential patterns (e.g. Chadwick and Howard, 1991; Takada, 1997), suggesting control by a local stress field imposed by a pressurized magma reservoir and/or the load of the edifice. In particular, the latter effect becomes predominant with increasing volcano height (McGuire and Pullen, 1989; Acocella and Neri, 2009). The location and orientation of the dikes may be also controlled by the shape of the edifice (Fiske and Jackson, 1972), or the presence of scarps along the volcano slopes, commonly produced by sector collapses (e.g. McGuire and Pullen, 1989; Tibaldi, 2003). Therefore, while dike propagation in areas without prominent relief is usually controlled by tectonics, the propagation of dikes within the volcanic edifice depends also upon the shape and topography of the edifice, as well as the stress conditions within shallow magma reservoirs.
Most volcanic edifices, independently of their morphology, structure and composition, are characterized by radial eruptive fissures, usually departing downslope from the volcano summit. The dikes feeding these fissures are usually
controlled by a stress field characterized by a concentric 3pattern and a radial
horizontal component of 1, imposed by the gravitationaly load of the edifice
(Acocella and Neri, 2009). However, some volcanoes show a selective distribution of these eruptive fissures, as Mauna Loa. Mauna Loa, despite holding two main rift zones, is characterized by minor radial eruptive fissures on the NW flank and a lack of fissures on the SE flank. This study uses numerical models to investigate this distribution in order to understand control factors. Our results suggest that the radial fissures on Mauna Loa may be explained by the competition between rift intrusion, promoting the development of radial dikes along the NW flank, and flank slip, inhibiting the development of radial fissures on the SE flank.
2. Structure and activity of Mauna Loa
Mauna Loa, the largest active shield volcano on the Island of Hawai'i, hosts the Moku’aweoweo summit caldera, from which two elongated rift zones depart: the Northeast Rift Zone (NERZ) and the Southwest Rift Zone (SWRZ) (Fig. 3.1). The boundary with the nearby Kilauea volcano, to the SE, is characterized by the development of a 50 km long system of NE-SW trending normal faults (the Kaoiki-Honuapo Fault System; Fig. 3.1) (Lipman, 1980; Lipman et al., 2006). The rifts on Mauna Loa are the result of dike intrusions accompanied by the instability of the SE flank of the volcano and of the neighbouring Kilauea caused by slip along a low angle decollement thrust fault, inward dipping at the base of the volcano (Walter and Amelung, 2006; Plattner et al., 2013).
Most of Mauna Loa’s eruptions begin with lava fountains from the summit area and then often migrate to vents down either rift zones. Since 1832, Mauna Loa has erupted 39 times with the last eruption in 1984, averaging one eruption every about 5 years (Wanless et al., 2006).
Chapter 3 Manuscript 1
In particular 38% of historical eruptions occurred in the summit area, 25% occurred along the SWRZ, 31% occurred along the NERZ and the 6% of eruptions occurred from radial fissures in the NW flank (Lockwood and Lipman, 1987; Trusdell, 1995; Barnard, 1995; Walter and Amelung, 2006).
Therefore, in addition to the predominant magmatic activity along the rift zones, Mauna Loa also shows a minor activity along radial eruptive fissures on the NW flank (Trusdell, 1995). Forty-four out radial vents which were active over the past 2,000 years on Mauna Loa are localized outside the rift zones and summit region (Lockwood and Lipman, 1987; Wanless et. al, 2006). The three most recent radial eruptions have occurred on the north and west flanks in 1852, 1859 and 1877. The 1859 eruption on the NW flank is one of the most voluminous eruptions in the last 200 years, feeding for ~300 days a 51 km long lava flow. Moreover, the eruptive fissures focus on the NW flank, with a striking radial distribution with regard to the volcano summit. Conversely, eruptive fissures are absent on the SE flank, where on the lower portion of the slope, the fissures are mainly parallel to the NE-SW boundary with Kilauea (Fig. 3.1).
Fig. 3.1 – Shaded-relief map of Hawaii showing: locations of all historical lava flows from 1832 to 1950 (in red); eruptive fissures (blue lines); faults (black lines). Labels show the location of the volcanoes (Mauna Loa and Kilauea), the rift zones (NERZ and SWRZ) and active fault areas while the inset shows the location.
There is a statistical association between earthquakes and eruptions at Mauna Loa (Walter and Amelung, 2006). The historical records provide evidence that the 17 eruptions and 15 earthquakes (with magnitude near 6) occurred in 12 eruption-earthquake sequences: eruptions at the SWRZ and eruption-earthquakes in the Hilea/Kona area and eruptions at the NERZ and earthquakes at the Kaoiki area (Fig. 3.1). Earthquakes focus along the basal decollement (the contact between the volcanic edifice and the pelagic sediments overlying the oceanic crust, at 8–12 km depth), and focal mechanisms suggest low-angle thrust-faults. These latter appear to be inward-dipping toward the volcano due to its load (Walter and Amelung, 2006, and references therein). Geodetic data have been repeatedly highlighting the SE displacement of the SE flank of Mauna Loa. While this is usually in the order of 1-1.5 cm/yr in periods without magmatic activity (Miklius and Cervelli, 2003), it may reach ~1 m transient periods of flank slip at the neighbour Kilauea volcano, as during the 1975 M7.2 Kalapana earthquake (Denlinger and Okubo, 1995;Lipman et al., 1985, 2006). Thus, the combined seismic and deformation data are consistent with a processes of seaward gravitational displacement of the entire SE flank of Hawai‘i, encompassing the edifices of both Mauna Loa and Kilauea, largely occurring along a basal decollement trust faults. The recent studies showed that the decollement dips toward Mauna Loa at ~5° with depth of 8–12 km under the west flank of Mauna Loa, 12–14 km beneath the summit caldera and rift zones and 8–11 km under the SE flank of the volcano (Walter and Amelung, 2006; Hill and Zucca, 1987; Got and Okubo, 2003; Wolfe et al., 2004; Klein et al.,1987; Lipman et al., 2006).
Chapter 3 Manuscript 1
3. Methods
We used a numerical modelling approach (finite element method - FEM) based on the resolution of Partial Different Equations (PDEs). The finite element method allows considering 1D, 2D and 3D problems and to introduce complexities, as topography, heterogeneities, gravity forces and others. Our FEM model is implemented using the
Structural Mechanics module of COMSOL Multiphysics 4.2a version
(www.comsol.com).
To investigate the relationships between flank movement (due to the underlying decollement fault), dike intrusions along the rift zones and radial eruptions at Mauna Loa, we simulate the structural-magmatic interactions using a 3D model of the island. The crust is modelled as an elastic medium (width and length 180 km, depth 110 km), divided in 2 sub-domains with decreasing elements size to achieve a gradual refining of the mesh towards the centre of the model (Fig. 3.2). The large size of the model avoids interferences caused by the model's far-filed boundaries.
The elastic constants of the medium are taken from previous studies (Walter and Amelung, 2006). We used a Poisson’s ratio = 0.25 and a Young’s module E =70 GPa. The boundary conditions are set as free surface at the top, and roller at the bottom and sides of the model.
We simulate the decollement fault in Kaoiki area and the dikes in rift zones (NERZ and SWRZ) as mechanical discontinuities. The decollement fault is approximated by a 20 km long and 10 km wide plane dipping 5° to the NW, that slips towards the SE to simulate the flank motion (Fig. 3.2).
The NERZ and the SWRZ are modelled as two rectangular cavities 10 km long, 5 m wide, and 8 km deep, departing from the summit and striking N38°E and N73°E, respectively (Fig. 3.2). The choice of using the opening of a rectangular cavity to model a dike intrusion was based on the comparison with the analytical model by Okada (1992) providing a good agreement between numerical and analytical solutions. The rifts portions are divided in shallow (from the surface to 4 km deep - the depth refers to the volcano summit) and deep, from 4 to 8 km of depth.
A tensile dislocation, or opening, of 0.6 m, consistent with the mean thickness of the dikes inferred during historical eruptions (Walker, 1987; Johnson, 1995; Walter and Amelung, 2006), is applied to the vertical sides of the rift zones. The comparison between analytical and numerical solutions from a vertical planar tensile dislocation showed an overestimation of tensile stresses on the tips of the cavity (dike). This overestimation represents a numerical singularity which it is extended up to a distance of 150-500 meters from the dike tips. The rock modeled numerically cannot break so this creates artefacts that we do not consider valid in our results.
Fig. 3.2 – Three-dimensional FE model: (a) Geometry of subdomains, rifts (shallow NERZ in orange; deep NERZ in red; shallow SWRZ in dark orange; deep SWRZ in dark red; the position of the summit is indicated by the blue triangle and decollement fault by the light blue surface; (b) mesh used in the model.
We included the topography and bathymetry of the island using a 30 m resolution DEM (provided by USGS-HVO), covering a 220 km high and 350 km long area, with an elevation between -5648 and 4169 meters (Fig. 3.3).
(B) (A)
Chapter 3 Manuscript 1
Fig. 3.3 – Tree-Dimensional FE model with topography and bathymetry of the island built using Comsol Multiphysics.
4. Results
4.1 Modelling results
Here we investigate how earthquakes along the decollement fault and intrusions along the rift zones could encourage or discourage the development of radial dikes on the NW and SE flanks of the volcano. Our models simulate intrusions (deeper dikes) and eruptions (shallower dikes)along the NERZ and/or SWRZ and/or slip along the decollement. During periods of quiescence, at Mauna Loa there is only deformation of the SE flank, on the order of a very few cm/yr (1-1.5 cm/yr). Conversely, during unrest the vertical and horizontal deformation due to magma intrusion overrides the flank motion or, in the case the latter increases, becomes of the same order of magnitude.
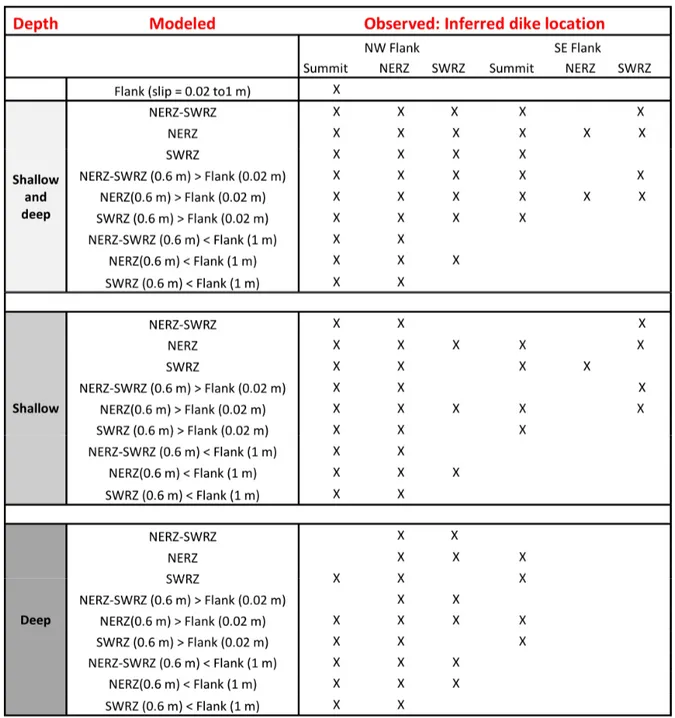
As a result, we tried to model intrusions and flank instability using different ratios between dike opening (shallow and deep dikes along the NERZ and/or SWRZ) and flank seaward slip along the basal decollement. We run several models; the overall results are summarized in Table 3.1. Below we focus on the most representative models.
Table 3.1 – Results of dike opening/flank slip interaction for different conditions of the location and opening of the dikes and decollement slip rate. The crosses indicate the possibility to have radial vents on the NW flank of the Mauna Loa for each model.
Chapter 3 Manuscript 1
4.1.1 Flank slip without dike opening (Models 1 and 2)
Here we simulate only the motion along the decollement fault below the Kaoiki area. We first simulate a motion of 2 cm/yr in the SE direction, equivalent to a flank motion at the surface of ~1 cm/yr, as detected from GPS data during quiescence periods (Model 1). This motion creates local conditions of positive maximum tensile
stress (3) mainly on the SE flank and in correspondence of the rift tips (Fig. 3.4a).
The orientation of the maximum tensile stress along the rift zones is normal to the SWRZ direction, and oblique to the NERZ and the area of the NW flank next to the summit caldera. In the latter part of the volcano the stress vectors are parallel or slightly oblique to the rift trace, suggesting that it may be possible to develop radial
dikes. However, the magnitude of 3 is generally <0.1 MPa, a value too small to
promote any radial dike emplacement (Fig. 3.4a).
We then simulate a major flank slip of 1 meter, equivalent to that due to an important earthquake, as the M6.2 one occurred in 1983 below the Kaoiki area (Klein and Wright, 2000; Walter and Amelung, 2006) along the decollement fault (Fig. 3.4b). The stress distribution shows the same conditions of local stresses as of Model 1, except for the rift tips where the stresses locally increase >1 MPa, suggesting the possibility to open the rift tips. However, on the flanks, radial dikes are not promoted.
Fig.3.4 – Model 1 and Model 2: Configuration of the Maximum Tensile Stress 3 [MPa] at the
surface resulting from: (A) flank slip of 0.02 m; (B) flank slip of 1 m. Red lines represent the rift traces; the red star represents the position of the summit caldera; the black square represents the position of decollement fault plane.
4.1.2 Dike opening throughout the NERZ and SWRZ, without and with flank motion (Models 3 and 4)
Model 3 is characterized by dike intrusions throughout the NERZ and SWRZ, from 8 km of depth to the surface, with a tensile opening of 0.6 m; no flank slip is imposed
(Fig. 3.5a). The dike opening causes a positive maximum tensile stress 3>1 MPa in
correspondence of the rift tips. Important localized positive 3 changes are shown at
the beginning of the NERZ, to the north of the caldera, and along the summit and the
SWRZ, on the NW flank (Fig. 3.5a). Here 3is parallel or subparallel to the rifts and
the stress magnitude is >0.5 MPa. Both conditions encourage the development of radial dikes, in particular at the beginning of the NERZ. Imposing a flank slip of 1 cm/yr at the surface, given by a slip of 2 cm/yr along the decollement below the SE flank, does not alter the overall pattern.
Chapter 3 Manuscript 1
Fig. 3.5 – Model 3 and Model 4: Configuration of the Maximum Tensile Stress 3 [MPa] at the
surface resulting from a dike opening (0.6 m) along the NERZ and SWRZ: (A) no flank slip imposed; (B) flank slip of 1 m. Red lines represent the rift traces; the red star represents the position of the summit caldera; the black square represents the position of decollement fault plane.
Model 4 has the same boundary conditions as model 3, but in addition it shows major flank slip (of 1 meter, simulating a M 6 earthquake) along the decollement fault
below the Kaoiki area (Fig. 3.5b). Part of the pattern of 3 distribution and intensity
are similar to model 2, as for example on the NW flank. However, the area on the SE
flank undergoes a significant increase(1-2 MPa) in the 3 component, along a NW-SE
direction and perpendicular of the rift traces, caused by the slip along the decollement fault. This condition inhibits the development of radial dikes on the SE flank (Fig. 3.5b).
4.1.3 Dike opening along the entire NERZ without and with flank motion (Models 5 and 6)
Model 5 is characterized by dike intrusion only along the NERZ, from 8 km depth to the surface, with an opening of 0.6 m; no flank slip is imposed (Fig. 3.6a).
The opening promotes a maximum tensile stress >1 MPa in correspondence to the rift tips and, to a lesser extent (>0.5 MPa),at the beginning of the NERZ and along
the upper NW flank (Fig. 3.6a), where 3 is parallel to the rift traces. These conditions
encourage the development of radial dikes on the upper NW flank. Imposing a flank slip of 1 cm/yr at the surface (given by a slip of 2 cm/yr along the decollement below the SE flank), does not alter the overall pattern.
Model 6 has the same boundary conditions as model 5, but in addition it shows major flank slip (1 meter) along the decollement fault below the Kaoiki area. Under
the latter condition, the SE flank undergoes a significant increase (1-2 MPa) in the 3
component, along a NW-SE direction and perpendicular of the rift traces. This condition inhibits the development of radial dikes on the SE flank (Fig. 3.6b).
Fig. 3.6 – Model 5 and Model 6: Configuration of the Maximum Tensile Stress 3 [MPa] at the
surface resulting from a dike opening (0.6 m) along the NERZ: (A) no flank slip imposed; (B) flank slip of 1 m. The red lines represent the rift traces; the red star represents the position of the summit caldera; the black square represents the position of decollement fault plane.
Chapter 3 Manuscript 1
4.1.4 Deep dike opening along the NERZ without and with flank motion (Models 7 and8)
Model 7 is characterized by the intrusion of a dike only along the NERZ, from 4 to 8 km depth from the summit, with a tensile opening of 0.6 m; no flank slip is imposed (Fig. 3.7a). Dike opening triggers a positive maximum tensile stress >1 MPa in
correspondence of the NERZ tip. High 3 variations (>0.5 MPa) occur at the
beginning of the NERZ and along the upper NW flank (Fig. 3.7A). However, here the
3 direction is usually orthogonal or highly oblique to both rifts. This condition does
not encourage the development of radial dikes to the NW of the NERZ, except for its
upper portion, to the north of the caldera. The 3 distribution on the SE flank may
locally promote the development of radial dikes immediately to the south of the caldera (Fig. 3.7a). Imposing a flank slip of 1 cm/yr at the surface does not alter the overall pattern.
Model 8 has the same boundary conditions as model 7, but in addition it shows major flank slip (1 meter) along the decollement fault below the Kaoiki area (Fig. 3.7b). Under the latter condition, the SE flank undergoes a significant increase (1-2
MPa) in the 3 component, along a NW-SE direction and perpendicular of the rift
traces. This condition inhibits the development of radial dikes on the SE flank (Fig. 3.7b). On the intermediate NW flank, the development of radial dikes is slightly
Fig. 3.7 – Model 7 and Model 8: Configuration of the Maximum Tensile Stress 3 [MPa] at the
surface resulting from a deep dike opening (0.6 m) along the NERZ: (A) no flank slip imposed; (B) flank slip of 1 m. Red lines represent the rift traces; the red star represents the position of the summit caldera; the black square represents the position of decollement fault plane.
4.1.5 Dike opening along the entire SWRZ without and with flank motion (Models 9 and 10)
Model 9 is characterized by dike intrusion only along the SWRZ, from the surface to 8 km deep, without any flank slip (Fig. 3.8a). This induces a moderate increase in
3 immediately to the north of the rift zones: moreover, 3is partly parallel or
subparallel to NERZ and the upper SWRZ (Fig. 3.8a). Imposing a flank slip of 1 cm/yr at the surface does not alter the overall pattern.
Model 10 has the same boundary conditions as model 9, but in addition it shows major flank slip (1 m) along the decollement fault below the Kaoiki area (Fig. 3.8b). Under the latter condition, the SE flank undergoes a significant increase (1-2 MPa) in
Chapter 3 Manuscript 1
This condition inhibits the development of radial dikes on the SE flank and moderately promotes the development if radial dikes on the northern part of the NERZ (Fig. 3.8b).
The intrusion of deep dikes along the SWRZ does not alter significantly the above described pattern and is therefore not included here. However, we stress that the intrusion of shallow dikes (<4 km depth) along the SWRZ induces a minor increase
(<0.4 MPa) of the 3 component, which becomes locally parallel and subparallel to
the rift (to the north and to the south of the caldera), moderately enhancing the development of radial dikes. An additional major slip (1 m) along the decollement
below the SE flank induces only a minor (<0.4 MPa) increase of the 3 component,
parallel to the rift, to the north of the caldera.
Fig. 3.8 – Model 9 and Model 10: Configuration of the Maximum Tensile Stress 3 [MPa] at the
surface resulting from a dike opening (0.6 m) along the SWRZ: (A) no flank slip imposed; (B) flank slip of 1 m. Red lines represent the rift traces; the red star represents the position of the summit caldera; the black square represents the position of the decollement fault plane.
5. Discussions
The models have shown the following features: 1) the slip of the SE flank alone, either of 2 cm/r or 1 m/yr, inhibits the development of any radial dike on Mauna Loa,
particularly on the SE flank, characterized by a NW-SE oriented 3 (Models 1 and 2;
Fig. 3.4); 2) the intrusion throughout (from the bottom to the summit) both rifts promotes the development of radial dikes, mostly on the NW flank and, to a minor extent, also on the SE flank. This pattern is independent of the depth of the intrusion (shallow versus deep dike emplacement) and of any minor displacement (1 cm/yr) of the SE flank (Models 3 and 4; Fig. 3.5); 3) the opening of the NERZ always (deeper and/or shallower) promotes the development of radial dikes on the NW flank (Models from 5 to 8; Fig. 3.6 and 3.7); 4) the opening of the SWRZ does not directly promote the development of radial dikes; however, it promotes the opening of the NERZ and thus, indirectly the opening of dikes (Models 9 and 10; Fig. 3.8).
These results suggest that the development of the radial eruptive fissures, focused on the NW flank of Mauna Loa, is related to the intrusive activity along the NERZ and, subordinately, the SWRZ. The repeated intrusion of dikes along these rift zones may create favourable conditions to the propagation of the dikes, feeding the observed radial fissures at the surface. Indeed, provided that the rifts are repeatedly intruded, the development of the radial fissures of the NW flank may be also explained under any slip (from 1 cm/yr to 1 m/yr) of the SE flank. However, any possibility to develop minor radial fissures on the SE flank (as in Model 2) becomes drastically hindered by any slip (minor or major) of the SE flank. Indeed, the few eruptive fissures on the SE flank are orthogonal to the direction of the slip,
consistently with the NW-SE direction of the 3 trajectories. The importance of
developing rift zones (and thus dike complexes) parallel to the contact between two overlapping volcanoes and characterized by a different amount of spreading was previously highlighted by Walter et al., (2006). Our models confirm these results for the SE flank of Mauna Loa, but at the same time also explain the development of radial fissures on the NW flank.
Chapter 3 Manuscript 1
intrusion, promoting the development of radial dikes along the NW flank, and flank slip, inhibiting the development of the radial dikes on the SE flank.
Moreover, the possibility of creating radial fractures may be related to the non-parallel configuration of the two rift zones of Mauna Loa: in fact, the angle between the two opening rift zones promotes tangential extension on the outer NW flank (where the angle between the two rift zones is ~210°) and tangential compression on the inner SE flank (where the angle between the two rift zones is ~150°) (Fig. 3.9). On the inner flank, the compression is also associated with the radial extension created by the slip of the flank, thus further inhibiting the development of any radial dike. On the outer flank, the extension may promote the development of radial fissures (as at Mauna Loa) or, under favourable conditions (possibly related to high magma productivity from an open summit conduit, see below), even the development of a third radial rift zone, at high angle with regard to the first two ones; the latter condition has been for example inferred for the Anaga volcano, Canary Islands (Walter et al., 2005).
Fig. 3.9 – Conceptual model of rift-opening induced extension on the outer flank and compression in the inner flank of the volcano.
This process may explain the development of the triple armed rift volcanoes, as often observed at the younger Canary Islands volcanoes, as La Palma, El Hierro and Tenerife (Carracedo, 1999).These triple armed rifts have been previously explained as related to regional tectonics, or the hot spot activity (Carracedo, 1996; Martì et al., 1996), or even the growth and coalescence of nearby volcanic edifices (Walter, 2003). We suggest that these triple armed rifts may also derive from the activity of two originally non-parallel radial branches, which may promote the development of a third branch on their outer flank (where the angle between the rifts is higher). Another possible example of important volcano experiencing such an evolution is Mt. Etna (Italy), characterized by the frequent activity of two main rift zones (the NE and S rifts) and the rare activity of the third and less developed W Rift (Allard et al., 2006, and references therein). Mt. Etna also shows further similarities to Mauna Loa: in fact, the configuration of the two main rift zones on both volcanoes are similar, and both volcanoes are characterized by significant flank slip on the inner flank (where the angle between the rifts is <180°; Lipman et al., 2006; Walter and Amelung, 2006; Solaro et al., 2010). Thus, the development of the W Rift at Mt. Etna may be considered as a more mature condition of development of the radial eruptive fissures on the outer flank of the volcano (as observed at Mauna Loa), due to the activity of the two main rift zones. A difference between the radial fissures of Mauna Loa and the more developed third rift branch at Mt. Etna and some of the Canary Islands may be related to a more efficient mechanism of magma transfer in the upper portion of the edifices at Etna, Tenerife, El Hierro and La Palma. This more efficient mechanisms may be related to the presence of an open summit conduit, from which the magma is transferred laterally along the rift zones and the radial fissures (e.g. Allard et al, 2006; Soriano et al., 2008; and references therein).
Our proposed model for the rift-induced activity and growth of eruptive fissures on basaltic volcanoes may be thus applicable to several edifices, including Mauna Loa, Etna and some volcanoes of the Canary Islands. However, any wider applicability
should take into account for the fact that the here described 3 stress trajectories may
significantly vary, even at a depth of some hundreds of km within the volcanic edifice. This has been shown comparing the active and dissected portions of Mt. Etna and Vesuvio, as well as using analogue models (Acocella et al., 2009).
Chapter 3 Manuscript 1
This suggests that any applicability of our model to eroded volcanoes, characterized by deeper dike patterns than those observed through the eruptive fissures at the surface, may provide significant discrepancies to our model and, as such, considered carefully.
6. Conclusions
Our results suggest that the selective occurrence of the radial fissures on Mauna Loa may be explained by the competition between two processes: a) rift intrusion (especially along the NE Rift), promoting the development of radial dikes along the NW flank; b) flank slip, inhibiting the development of the radial dikes on the SE flank.
In particular, the opening of the two non-parallel main rift zones of Mauna Loa promotes the local circumferential extension necessary to develop the radial dikes on the NW flank; on the SE flank, the same opening, together with the flank slip, creates radial extension and circumferential compression, inhibiting the development of radial fissures.
Similar features are observed also at other important basaltic volcanoes, as at Mt. Etna and on the Canary Islands, suggesting a model of more general applicability. This model explains the development of radial eruptive fissures (and possibly, also minor rift zones) through the activity of the two main non-parallel rift zones of a volcano.
Chapter 4
Manuscript 2
Deformation history of Mauna Loa (Hawaii) from 2003 to 2014 through InSAR data: understanding the longer-term processes
La Marra1 D., Poland2 M., Acocella1 V., Battaglia3,4 M., Miklius5 A.,
1
Department of Science, Roma Tre University, Largo S.L. Murialdo, 1, 00146 Rome, Italy
2
U.S. Geological Survey, Cascades Volcano Observatory, 1300 SE Cardinal Ct., Vancouver, WA 98683-9589, U.S.A.
3
Volcano Science Center, U.S. Geological Survey, 345 Middlefield Rd, Menlo Park CA 94025, U.S.A.
4
Department of Earth Science, Sapienza University of Rome, Piazzale Aldo Moro, 5, 00185 Rome, Italy
5
U.S. Geological Survey, Hawaiian Volcano Observatory, 51 Crater Rim Road, Hawai`i National Park, HI 96718-0051, U.S.A.
Abstract
Geodesy allows detecting the deformation of active volcanoes, improving our understanding of magmatic processes. This becomes particularly efficient when time series are available and volcanoes can be monitored on decade scale, and not only during a specific event. Here we exploit the SBAS technique, using SAR images from ENVISAT (descending track 200 and ascending track 365; 2003 - 2010) and COSMO-SkyMed (descending and ascending orbits; 2012 - 2014), to study a decade of deformation at Mauna Loa (Hawaii). We also used data from 24 continuous GPS sites, allowing us to compare the InSAR time-series to ground-based measurements.
Chapter 4 Manuscript 2
Our results show a phase of inflation at the volcano from 2003 to 2014, reaching a peak of up to 11 cm/yr on the summit area between mid-2004 to mid-2005 and then slowing down. Within this frame, we were able to identify five main periods of range increase/decrease with approximately linear deformation behavior. The inversion of the deformation data in each of the five periods suggests the repeated, though not constant, intrusion of one or more dikes below the upper Southern Rift Zone. Such a behavior is distinctive of Kilauea and it has been proposed that continuous flank instability, at both Mauna Loa and Kilauea, may promote frequent intrusions in an active volcano.
Key words: Numerical model, radial fissure, dikes, flank slip, Mauna Loa
1. Introduction
Modern geodetic techniques, including Global Positioning System (GPS) and space borne Interferometric Synthetic Aperture Radar (InSAR), allow detecting centimetre to millimetre scale deformation of a volcanic edifice. Geodesy is an invaluable tool for monitoring and understanding the relations between deformation and magmatic activity.
In particular, the availability of large geodetic InSAR archives allows identifying and measuring the deformation of an entire volcanic edifice, at high spatial and temporal resolution. By exploiting large InSAR archives we can obtain incremental and average deformation rates over a long time periods (decades; e.g. Solaro et al., 2010) as well as isolate rapidly evolving events of unrest, such as eruptions (e.g. Vilardo et al., 2010; Pedersen et al., 2006; Richter et al., 2013; Poland, 2007)
However, understanding the deformation of a volcano outside short windows of sudden deformative events provides important clues in defining its dynamic behaviour.


![Fig. 3.5 – Model 3 and Model 4: Configuration of the Maximum Tensile Stress 3 [MPa] at the](https://thumb-eu.123doks.com/thumbv2/123dokorg/2833878.4626/30.892.137.798.129.550/fig-model-model-configuration-maximum-tensile-stress-mpa.webp)
![Fig. 3.6 – Model 5 and Model 6: Configuration of the Maximum Tensile Stress 3 [MPa] at the](https://thumb-eu.123doks.com/thumbv2/123dokorg/2833878.4626/31.892.134.801.517.927/fig-model-model-configuration-maximum-tensile-stress-mpa.webp)
![Fig. 3.7 – Model 7 and Model 8: Configuration of the Maximum Tensile Stress 3 [MPa] at the](https://thumb-eu.123doks.com/thumbv2/123dokorg/2833878.4626/33.892.135.833.141.589/fig-model-model-configuration-maximum-tensile-stress-mpa.webp)
![Fig. 3.8 – Model 9 and Model 10: Configuration of the Maximum Tensile Stress 3 [MPa] at the](https://thumb-eu.123doks.com/thumbv2/123dokorg/2833878.4626/34.892.139.801.515.933/fig-model-model-configuration-maximum-tensile-stress-mpa.webp)

