Brain insulin resistance impairs hippocampal
synaptic plasticity and memory by increasing GluA1
palmitoylation through FoxO3a
Matteo Spinelli
1
, Salvatore Fusco
1,2
, Marco Mainardi
1
, Federico Scala
1
, Francesca Natale
1
, Rosita Lapenta
3
Andrea Mattera
1
, Marco Rinaudo
1
, Domenica Donatella Li Puma
1
, Cristian Ripoli
1
, Alfonso Grassi
3
,
Marcello D
’Ascenzo
1
& Claudio Grassi
1,4
High-fat diet (HFD) and metabolic diseases cause detrimental effects on hippocampal
synaptic plasticity, learning, and memory through molecular mechanisms still poorly
understood. Here, we demonstrate that HFD increases palmitic acid deposition in the
hip-pocampus and induces hippocampal insulin resistance leading to FoxO3a-mediated
over-expression of the palmitoyltransferase zDHHC3. The excess of palmitic acid along with
higher zDHHC3 levels causes hyper-palmitoylation of AMPA glutamate receptor subunit
GluA1, hindering its activity-dependent traf
ficking to the plasma membrane. Accordingly,
AMPAR current amplitudes and, more importantly, their potentiation underlying synaptic
plasticity were inhibited, as well as hippocampal-dependent memory. Hippocampus-speci
fic
silencing of Zdhhc3 and, interestingly enough, intranasal injection of the palmitoyltransferase
inhibitor, 2-bromopalmitate, counteract GluA1 hyper-palmitoylation and restore synaptic
plasticity and memory in HFD mice. Our data reveal a key role of FoxO3a/Zdhhc3/GluA1 axis
in the HFD-dependent impairment of cognitive function and identify a novel mechanism
underlying the cross talk between metabolic and cognitive disorders.
DOI: 10.1038/s41467-017-02221-9
OPEN
1Institute of Human Physiology, Università Cattolica Medical School, 00168 Rome, Italy.2San Raffaele Pisana Scientific Institute for Research, Hospitalization
and Health Care, 00163 Rome, Italy.3Department of Chemistry and Biology, University of Salerno, 84084 Salerno, Italy.4Fondazione Policlinico Gemelli,
00168 Rome, Italy. Correspondence and requests for materials should be addressed to S.F. (email:[email protected])
123456789
H
ippocampal synaptic plasticity plays a central role in
cognitive function
1. During learning and memory,
activity-dependent functional plasticity causes structural
changes that are essential for the acquisition of new information
2.
This is well exemplified by the long-term potentiation (LTP)
paradigm, a cellular correlate of learning and memory
3, in which
glutamate released following high-frequency stimulation of
pre-synaptic terminals induces N-methyl-
D-aspartate (NMDA)
receptor/CaMKII signaling activation and recruitment of
α-amino-3-hydroxy-5-methyl-4-isoxazolepropionic acid (AMPA)
receptors at the postsynaptic site, thereby enhancing the
ampli-tude of excitatory postsynaptic currents (EPSCs)
4.
Post-translational modifications have emerged as critical
reg-ulators of synaptic transmission and plasticity
5,6. In particular,
phosphorylation and palmitoylation of both NMDA and AMPA
receptor (NMDAR and AMPAR) subunits control stability,
trafficking, protein–protein interaction, and synaptic expression
of glutamate receptors (GluRs) in the central nervous system
7–9.
Phosphorylation and palmitoylation are labile and reversible
modifications that can be dynamically controlled by extracellular
and environmental stimuli
10,11.
Recently, emerging attention has been devoted to the impact of
nutrients and diet on neuronal network development and
activ-ity
12. Experimental models of overnutrition and metabolic
dis-eases (e.g., obesity and insulin resistance) show severe learning
and memory defects
13. High-fat diet (HFD) is the most
com-monly used experimental model of metabolic disease, causing
both peripheral insulin resistance and detrimental effects on brain
function
14, but the molecular mechanisms underlying the impact
of nutrient excess on cognitive function are still poorly
understood.
Palmitic acid is the most abundant fatty acid in the brain and,
importantly, palmitoylation consists of a covalent attachment of a
palmitate molecule to proteins
15. Protein palmitoylation is
finely
regulated by a class of enzymes, the protein acyl transferases
(PATs)
containing
an
aspartate-histidine-histidine-cysteine
(DHHC) domain
16. However, so far no information is available
on whether: (i) HFD affects synaptic protein palmitoylation and
(ii) this molecular mechanism underlies cognitive function
alterations associated with brain insulin resistance.
Here, we demonstrate that HFD-induced brain insulin
resis-tance causes LTP and memory impairment due to the
accumu-lation of palmitic acid and increased expression/activation of
zDHHC3 leading to hyper-palmitoylation of GluA1 in the
hip-pocampus. In vitro stimulation of hippocampal neurons with
both insulin and palmitic acid reproduces the in vivo molecular
changes, affects the recruitment of GluA1 to the synaptic
mem-brane, and inhibits AMPA currents at glutamatergic synapses
under both basal conditions and following LTP protocols.
Moreover, hippocampus-selective silencing of zDHHC3 or
overexpression of the palmitoylation-deficient GluA1 mutant
rescue the synaptic plasticity deterioration induced by insulin
resistance. Finally, mice treatment with the palmitoylation
inhi-bitor 2-bromopalmitate (2-BP) abolishes the detrimental effects
of HFD on learning and memory. These data suggest that
aber-rant GluA1 palmitoylation plays a critical role in hippocampal
synaptic plasticity impairment and cognitive decline observed in
experimental models of metabolic diseases.
Results
HFD induces brain insulin resistance and LTP impairment.
Epidemiological and experimental evidence indicate that HFD, in
addition to causing peripheral metabolic changes including
insulin resistance and fatty acid deposition, impairs hippocampal
plasticity
17, 18. To investigate the mechanism underlying the
impairment of hippocampal synaptic plasticity in HFD mice and
to determine the role of hippocampal insulin signaling in these
alterations, we performed electrophysiological, behavioral, and
metabolic analyses in C57BL/6 mice after 6 weeks of HFD or
standard diet (SD).
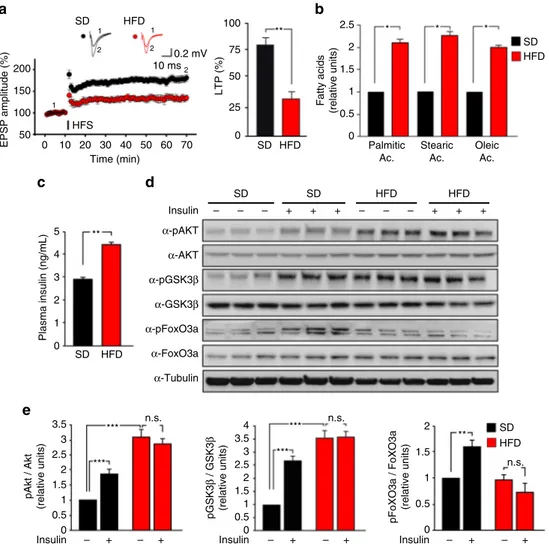
In a
first cohort of mice, we found that LTP induced at the
CA3-CA1 hippocampal synapses by high-frequency stimulation
(HFS) was significantly reduced in slices from HFD mice (33.5 ±
6.4% vs. 81.3
± 6.6%; Fig.
1
a). Accordingly, HFD impaired
hippocampus-dependent learning and memory assessed by the
novel object recognition (NOR) and Morris water maze (MWM)
tests. HFD mice showed less preference for the novel object than
controls (Supplementary Fig.
1
a). Moreover, HFD significantly
increased the latency to
find the hidden platform during the
training of MWM and reduced the time spent in the target
quadrant during the probe test (Supplementary Fig.
1
b,c). Next,
we evaluated hippocampal fatty acid concentrations and the
insulin plasma levels in a second cohort of mice. Hippocampi of
HFD mice showed higher contents of palmitic (+111
± 8%),
stearic (+128
± 7%), and oleic (+94% ± 12%) acids than controls
(Fig.
1
b). Moreover, higher plasma levels of insulin were found in
HFD mice (4.42
± 0.13 ng mL
−1vs. 2.93
± 0.08 ng mL
−1; Fig.
1
c),
in accordance with their peripheral insulin resistance. To test the
hippocampal insulin sensitivity of HFD mice, we assessed
phosphorylation of both Akt and its main downstream effectors,
GSK3β and FoxO3a, 30 min after intranasal injection of insulin.
We observed increased phosphorylation levels of Akt, GSK3β,
and FoxO3a following insulin injection in controls (Fig.
1
d,e).
Conversely, in the hippocampi of HFD mice aberrant insulin
signaling was found, consisting of basal hyper-phosphorylation of
both Akt and GSK3β kinases (pAkt Ser
473: + 210
± 23%; pGSK3β
Ser
9: + 251
± 31%) and loss of insulin-dependent phosphorylation
of Akt, GSK3β, and FoxO3a (pFoxO3a Ser
253) (F
3.28
= 52.35 for
AKT Ser
473, SD
vehvs. SD
insp
= 0.00039, SD
vehvs. HFD
vehp
=
0.00019; F
3.28= 36.03 for GSK3β Ser
9, SD
vehvs. SD
insp
= 0.00011,
SD
vehvs. HFD
vehp
= 0.00096; F
3.28= 53.72 for pFoxO3a Ser
253,
SD
vehvs. SD
insp
= 0.0011; Fig.
1
d,e). These data indicated that
impaired synaptic plasticity and memory were associated with
altered insulin signaling and increased fatty acid deposition in the
hippocampi of HFD mice.
HFD increases GluA1 palmitoylation and zDHHC3 expression.
Many studies have shown that post-translational modifications of
GluR subunits, such as palmitoylation and phosphorylation, play
critical roles in the regulation of synaptic plasticity
19–21. An
intriguing hypothesis was that an excess of metabolic factors, such
as insulin and palmitic acid, could impinge on palmitoylation of
GluRs. Therefore, we
first analyzed the palmitoylation of NMDA
and AMPA glutamate receptor subunits in the hippocampi of SD
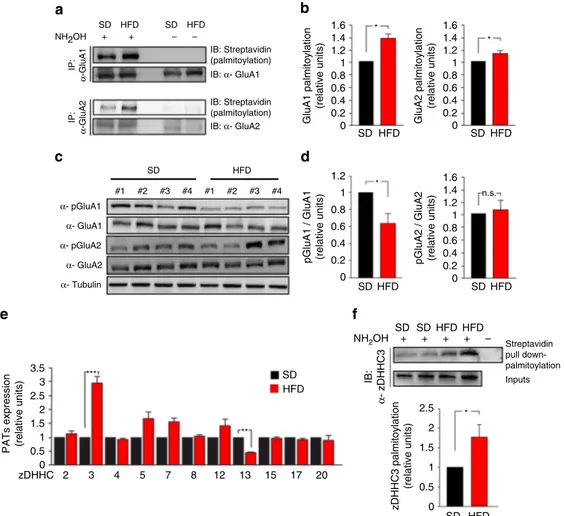
and HFD mice by acyl-biotin exchange (ABE) assay. HFD mice
exhibited
increased
palmitoylation
of
both
GluA1
and
GluA2 subunits of AMPAR (+ 40
± 6.1% and + 18 ± 3.5%,
respectively, vs. SD; Fig.
2
a, b). Conversely, no changes in
pal-mitoylation levels of NMDA or other glutamate receptor
sub-units, as well as of PSD95, were observed (Supplementary Fig.
2
a,
b). Accordingly, GluA1 phosphorylation at serine 845 (pGluA1
Ser
845), an activation site negatively regulated by palmitoylation,
was significantly inhibited in the hippocampi of HFD mice (−38
± 3.7% vs. SD; Fig.
2
c, d). Instead, GluA2 phosphorylation at
serine 880 (pGluA2 Ser
880) was not affected by the dietary
regi-men (Fig.
2
c, d).
Protein palmitoylation is primarily regulated by zinc
finger
DHHC-type palmitoyl transferases (ZDHHCs)
22. We examined
the expression of the main zDHHCs (2, 3, 4, 5, 7, 8, 12, 13, 15, 17,
20) triggering palmitoylation of synaptic proteins including both
AMPAR and NMDAR subunits. zDHHC3 was the only PAT
transcriptionally upregulated in the hippocampi of HFD mice (+
196
± 22%; Fig.
2
e). Moreover, the activity of zDHHC3 is
finely
regulated by its autopalmitoylation
23. In the hippocampus of
HFD mice we found increased levels of palmitoylated zDHHC3
(Fig.
2
f). Collectively, our ex vivo data suggested that HFD
heightened GluA1 palmitoylation through a dual mechanism: (i)
increased availability of the substrate, i.e., the palmitic acid and
(ii) enhanced expression and palmitoylation of the
palmitoyl-transferase zDHHC3.
IPA transcriptionally enhances GluA1 palmitoylation. To
identify the molecular mechanism underlying the HFD-induced
GluA1 hyper-palmitoylation, we set up an in vitro model of
neuronal insulin resistance resembling the metabolic and
mole-cular changes observed in vivo. Based on our data suggesting that
both insulin and palmitic acid are critical for the development of
insulin resistance, we cultivated hippocampal neurons for 24 h
with either insulin (20 nM) alone or a cocktail of both insulin and
palmitic acid (20 nM and 0.2 mM, respectively, hereafter named
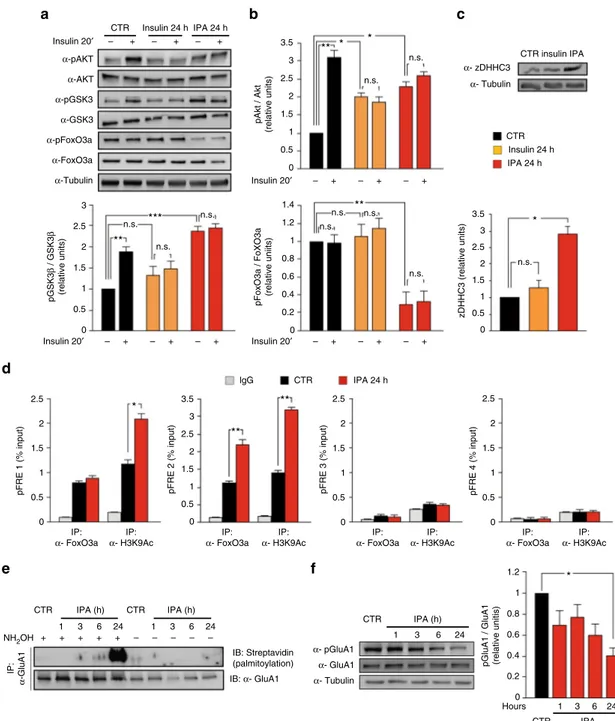
IPA) and analyzed the insulin signaling. Both protocols of insulin
resistance abolished insulin-mediated phosphorylation of Akt and
GSK3β, but only IPA treatment induced the inhibitory
hyper-phosphorylation of GSK3β at Ser
9(+139
± 10%; Fig.
3
a, b).
Interestingly, IPA was also the only protocol able to downregulate
the inhibitory phosphorylation of FoxO3a (−70 ± 12%; Fig.
3
a, b),
leading to the hyper-activation of the transcription factor (F
3.32=
35.55 for AKT Ser
473, CTR
vehvs. CTR
insp
= 0.002, CTR
vehvs.
INS
vehp
= 0.02, CTR
vehvs. IPA
vehp
= 0.018; F
3.32= 57.88 for
GSK3β Ser
9, CTR
veh
vs. CTR
insp
= 0.009, CTR
vehvs. IPA
vehp
=
0.0003; and F
3.32= 11.63 for pFoxO3a Ser
253, CTR
vehvs. IPA
vehp
= 0.006). More importantly, chronic stimulation with IPA, but
not insulin alone, enhanced the expression of zDHHC3 at the
protein level (+190
± 20%; F
5.14= 43.16, CTR vs. IPA p = 0.013;
Fig.
3
c).
SD HFD 1 2 1 2 10 ms 0.2 mV 100 75 ** LTP (%) 50 25 0 SD HFD 0 0.5 1 1.5 2 2.5 * * * SD HFD Oleic Ac. Stearic Ac. HFD HFD SD SD Insulin ** SD HFD 0 1 2 3 Plasma insulin (ng/mL) 4 5 α-pAKT α-AKT α-pGSK3β α-GSK3β α-pFoxO3a α-FoxO3a α-Tubulin n.s. n.s. SD HFD *** *** n.s. *** ** 4 pGSK3 β / GSK3 β (relative units) pFoXO3a / FoXO3a (relative units) 3.5 3 2.5 2 1.5 1 0.5 0 2 1.5 1 0.5 0 *** 3.5 3 2.5 2 1.5 1 0.5 0 – + – Insulin Insulin pAkt / Akt (relative units) + – + – + Insulin – + – + + + + – – – + + + – – – Palmitic Ac. Fatty acids (relative units) 2 1 HFS 70 60 50 40 30 Time (min) 50 100 150 200 EPSP amplitude (%) 0 10 20c
d
e
a
b
Fig. 1 HFD impairs synaptic plasticity, induces insulin resistance, and increases palmitic acid levels in the hippocampus. a Time course of LTP at CA3-CA1 synapses induced by HFS delivered at time 10 (line) in hippocampal slices obtained from mice fed with SD (n = 12 slices) or HFD (n = 9 slices) for 6 weeks. Results are expressed as percentages of baseline fEPSP amplitude (=100%). Insets show representative fEPSPs at baseline (1) and during the last 5 min of LTP recording (2). Traces are averages offive consecutive responses at the time points indicated with 1 and 2. On right, bar graphs of LTP observed during the last 5 min in SD and HFD mice (statistics by unpaired Student’s t-test). b Relative amounts of fatty acid (measured by GC-FID analysis) extracted from hippocampi of SD (n = 9) and HFD (n = 8) mice (statistics by unpaired Student’s t-test). c Insulin plasma levels of SD and HFD mice measured by ELISA performed in duplicate (n = 10 mice per group; statistics by unpaired Student’s t-test). d Immunoblot analysis revealing increased phosphorylation of Akt Ser473and GSK3β Ser9and abolished responsiveness to insulin injection in the hippocampi of HFD mice. Samples were harvested from two independent experiments.e Densitometry of phospho-proteins (shown in d) normalized to both the corresponding total protein and tubulin (n = 6 per group; statistics by two-way ANOVA and Bonferroni post hoc). Data are expressed as mean± standard error of the mean (SEM). *p < 0.05; ** p < 0.01; ***p < 0.001; n.s. not significant. See also Supplementary Fig.1
To better characterize the insulin resistance-dependent
upre-gulation of PAT, we investigated the hypothesis that FoxO3a
transcriptionally regulated zDHHC3. Notably, nutrients
mod-ulate FoxO3a interaction with chromatin remodelers and its
transcriptional activity
24–26. Bioinformatic analysis of the mouse
zDHHC3 locus (NC_00075.6) revealed the presence of several
putative FoxO responsive elements (pFRE) both upstream and
downstream of the transcription start site (pFRE1 containing:
−2929, −2713, −2696, and −2685; pFRE2 including: −1148; pFR3
containing: +11,067 and +11,363; and pFRE4 including: +12,116).
Chromatin immunoprecipitation from hippocampal neuron
extracts revealed that FoxO3a bound two of these genomic
regions (pFRE1 and pFRE2), and the recruitment on the sequence
pFRE2 was significantly increased by IPA treatment (+103 ± 12%;
Fig.
3
d). Accordingly, IPA increased the transcriptional activation
marker lysine 9 histone 3 acetylation on the same regulatory
sequences (+75
± 11% on pFRE1; +129 ± 8% on pFRE2; Fig.
3
d).
Next, we asked whether IPA could impinge on GluA1
palmitoylation similarly to HFD. Treatment of hippocampal
neurons with IPA (for 1–24 h) induced a time-dependent increase
of GluA1 palmitoylation (Fig.
3
e) along with inhibition of
pGluA1 Ser
845, but no changes in total GluA1 protein amounts
(F
3.47= 4.42, CTR vs. IPA
24hp
= 0.018; Fig.
3
f). These results
indicated that IPA reproduced in vitro the effects of HFD on both
AMPAR GluA1 subunit palmitoylation/phosphorylation and
zDHHC3 expression.
IPA affects GluA1 localization and AMPA currents. To reveal
the biological and functional outcome of IPA-dependent GluA1
hyper-palmitoylation, we investigated the subcellular localization
of GluA1 and recorded AMPAR-mediated postsynaptic currents.
To determine the surface vs. intracellular protein localization, we
harvested hippocampal neurons with or without the addition of
IB: Streptavidin (palmitoylation) IB: α- GluA1 IB: Streptavidin (palmitoylation) IB: α- GluA2 HFD SD #1 #2 #3 #4 #1 α- pGluA1 α- pGluA2 α- GluA1 α- GluA2 α- Tubulin #2 #3 #4 1.2 1 * 0.8 SD HFD SD HFD SD NH2OH + SD HFD + + HFD + – Streptavidin pull down-palmitoylation Inputs 2.5 2 1.5 1 0.5 0 SD HFD zDHHC3 palmitoylation (relative units) * SD HFD 20 17 15 13 12 8 7 5 4 3 *** ** 3.5 3 2.5 2 1.5 1 0.5 0 zDHHC PATs expression (relative units)2
IB:
α
- zDHHC3
pGluA1 / GluA1 (relative units) pGluA2 / GluA2 (relative units) 0.6 0.4 0.2 0 1.2 1.4 1.6 n.s. 1 0.8 0.6 0.4 0.2 0 SD HFD SD HFD 1.6 1.4 1.2 * * SD HFD SD HFD GluA1 palmitoylation (relative units) GluA2 palmitoylation (relative units) 1 0.8 0.6 0.4 0.2 0 1.6 1.4 1.2 1 0.8 0.6 0.4 0.2 0 – – + + NH2OH IP: α -GluA1 IP: α -GluA2
e
f
c
d
b
a
Fig. 2 HFD increases palmitoylation and inhibits phosphorylation of GluA1. a Palmitoylation of GluA1 and GluA2 was examined in the hippocampus of SD and HFD mice using a modified biotin switch assay (ABE, see "Acyl-biotinyl exchange assay" section in Methods). Immunoblot showing palmitoylated (acyl-biotinyl exchanged and detected by streptavidin) GluR (top) and total immunoprecipitated protein (bottom). Samples without NH2OH are negative
controls.b Densitometry of palmitoylated GluA1/total immunoprecipitated GluA1 (left,n = 6) and palmitoylated GluA2/total immunoprecipitated GluA2 ratio (right,n = 4; statistics by Mann–Whitney test). c Immunoblots of hippocampal homogenates revealing reduced phosphorylation of GluA1 at serine 845 (pGluA1 Ser845) in HFD mice, and unchanged phosphorylation of GluA2 at serine 880 (pGluA2 Ser880). Samples were harvested from two independent experiments.d Densitometry of pGluA1 Ser845(left) and pGluA2 Ser880(right) blots normalized to both the corresponding total protein and tubulin (n = 10 mice per group; statistics by unpaired Student’s t-test). e Expression of zDHHC 2, 3, 4, 5, 7, 8, 12, 13, 15, 17, and 20 mRNA, assessed by Real-Time qPCR. Gene expression was normalized to actin. Data represent mean values obtained fromfive mice for each group; experiments were performed in triplicate (statistics by unpaired Student’s t-test). f Immunoblots showing palmitoylation (Streptavidin pull down-palmitoylation also named “proteomic ABE”, see Methods) (top) and expression (middle) of zDHHC3 in the hippocampus of SD and HFD mice. Samples without NH2OH are negative
controls. Densitometry (bottom) of palmitoylated zDHHC3/total protein (n = 6; statistics by Mann–Whitney test). Data are expressed as mean ± s.e.m. *p < 0.05; **p < 0.01; n.s. not significant. See also Supplementary Fig.2
the membrane impermeant cross-linking reagent bis
(sulfo-succinimidyl) suberate (BS
3). BS
3is a cross-linking agent that
forms clusters of GluR subunits expressed on the cell surface
27.
The following SDS-PAGE assay revealed an abundance of GluA1
cytoplasmic monomers (indicated with [C]) and a significant
decrease of plasma membrane receptor tetramers containing
GluA1 (indicated with [S]) in neurons stimulated with IPA ([C]
+ 48.5
± 6.7% and [S] −26.8 ± 5.6% vs. control; Fig.
4
a, b). We
also performed GluA1 immunostaining without membrane
per-meabilization in order to specifically detect the fraction of
receptors localized on the membrane. Accordingly, upon IPA
treatment, surface GluA1 content notably decreased in neurites
(−44%; Fig.
4
c and Supplementary Fig.
3
c), whereas GluA1
fluorescence intensity increases in the Golgi apparatus (+25%;
CTR Insulin 24 h IP: α- FoxO3a IP: α- H3K9Ac IP: α- FoxO3a IP: α- H3K9Ac IP: α- FoxO3a IP: α- H3K9Ac IP: α- FoxO3a IP: α- H3K9Ac Insulin 20′ Insulin 20′ 3.5 3 2.5 2 1.5 n.s. n.s. α- zDHHC3 CTR insulin IPA CTR Insulin 24 h IPA 24 h * n.s. n.s. n.s. n.s. 1.4 1.2 pFoxO3a / FoXO3a (relative uniits) 1 0.8 0.6 0.4 0.2 0 – + 2.5 2pFRE 1 (% input) pFRE 2 (% input) pFRE 3 (% input)
1.5 1 0.5 0 3.5 ** ** lgG CTR IPA 24 h 2.5 3 1.5 2 0.5 1 IPA (h) CTR IPA (h) NH2OH IP: α -GluA1 1 + + + + + – – – – – 3 6 24 1 3 6 24 IB: Streptavidin (palmitoylation) IB: α- GluA1 α- GluA1 α- pGluA1 α- Tubulin 1 3 6 24 1.2 1 * 0.8
pGluA1 / GluA1 (relative unitis)
0.6 0.4 0.2 Hours 1 3 6 24 IPA CTR 0 IPA (h) CTR CTR 0 2.5 1.5 2 0.5 1 0 pFRE 4 (% input) 2.5 1.5 2 0.5 1 0 – + – * + Insulin 20′ – + – + – + Insulin 20′ – + – + – + n.s. ** 3.5 3 2.5 2 zDHHC3 (relative units) 1.5 1 0.5 0 3 2.5 2 ** *** n.s. n.s. n.s. pGSK3 β / GSK3 β (relative units) 1.5 1 0.5 0 α- Tubulin * * ** pAkt / Akt (relative units) 1 0.5 0 α-pAKT α-AKT α-pGSK3 α-GSK3 α-pFoxO3a α-FoxO3a α-Tubulin IPA 24 h + + + – – –
e
f
d
a
b
c
Fig. 3 Insulin and palmitic acid (IPA) transcriptionally induce zDHHC3 and affect palmitoylation and phosphorylation of GluA1 in hippocampal neurons. a Immunoblots of pGSK3β Ser9and pFoxO3a Ser253after 24 h of insulin or IPA treatment and upon acute stimulation with insulin.b Densitometry of pAkt Ser473(top), pGSK3β Ser9(bottom, left), and pFoxO3a Ser253(bottom, right) blots, normalized to both the corresponding total protein and tubulin;
experiments were performed in triplicate (statistics by two-way ANOVA and Bonferroni post hoc).c Immunoblots (top) and densitometry (bottom) of zDHHC3 expression after insulin or IPA treatment; experiments were performed in triplicate (statistics by one-way ANOVA and Bonferroni post hoc).d Chromatin immunoprecipitation assays of FoxO3a binding to and histone H3 lysine 9 acetylation (H3K9Ac) of putative FoxO3a responsive elements (pFRE) around the zDHHC3 promoter in hippocampal neurons treated with vehicle (CTR) or IPA (statistics by Mann–Whitney test). Data represent mean values of three independent experiments.e Immunoblots of palmitoylated GluA1 (top) and total immunoprecipitated protein (bottom) in hippocampal neurons. Samples without NH2OH are negative controls. The experiment was repeated three times with similar results.f Immunoblots of pGluA1 Ser845
(left) and densitometry of pGluA1 Ser845normalized to both total GluA1 and tubulin (right). The experiment was repeated three times (n = 3, statistics by
Supplementary Fig.
3
d). IPA did not aspecifically inhibit the
antibody hybridization as demonstrated by GluA1
immuno-fluorescence in permeabilized neurons (Supplementary Fig.
3
a).
Next, we investigated whether IPA impaired the binding of
GluA1 with synaptic protein complexes. IPA reduced the
interaction of GluA1 with the synaptic scaffold protein PSD95
(−79 ± 4.1%; Fig.
4
d and Supplementary Fig.
3
b). IPA treatment
did not affect the total amount of both GluA1 and PDS95, but
rather decreased the stoichiometry of the binding, suggesting
either lower affinity between the two proteins or reduced
co-CTR α- GluA1 α- Tubulin BS3 IPA CTR IPA 1.2 * 1.6 1.4 1.2 1 0.8 0.6 0.4 0.2 0 Cell surface GluA1 Intracellular GluA11 0.8 0.6 0.4 0.2 0 + + – – [S] [C] 250 kDa 110 kDa CTR IPA CTR IPA * CTR IP: α-GluA1 α- PSD95 α- Actin α- GluA1 α- PSD95 α- Actin α- GluA1 CTR 1 nA IPA 120 n.s. n.s. n.s. n.s.n.s. *** n.s. ** 100
AMPAR response (% of control) 80 60 40 20 0 120 100 NMDAR response (% of control) 80 60 40 20 0 120 100 mEPSC frequency (% of control) 80 60 40 20 0 120 100 mEPSC amplitude (% of control) 80 60 40 20 0
IOA CTR IPA IOA CTR IPA IOA
Tot. Lys. IPA IPA CTR Phalloidin PSD95 GluA1 GluA1 Merge DIC IP: IgG – + – IPA 100 ms 1 nA 100 ms 20 pA 1 s CTR CTR cLTP α- pGluA1 α- GluA1 α- Tubulin – + – + IPA IPA 2 1.5
pGluA1 / GluA1 (relative units) 1 0.5 0 cLTP – + CTR IPA – +
IOA CTR IPA IOA CTR IPA IOA CTR IPA IOA
n.s. * **
a
b
c
d
e
f
g
h
localization in the synaptic membrane. In keeping with the latter
possibility, we observed a markedly lower interaction of GluA1
with actin (−74 ± 3.2%; Fig.
4
d and Supplementary Fig.
3
b).
In addition, we examined GluA1 and PSD95 co-localization by
double immunostaining experiments in neurons in which F-actin
was labeled with
fluorescent phalloidin to visualize dendritic
processes. IPA reduced GluA1/PSD95 co-localization (Fig.
4
e)
without affecting PSD95 total amount at the synapse
(Supple-mentary Fig.
3
e) nor PSD95 palmitoylation (Supplementary
Fig.
3
f). Collectively, co-immunoprecipitation and
immunofluor-escence experiments indicated that the IPA-induced GluA1
hyper-palmitoylation inhibited its synaptic membrane
localiza-tion. Finally, we studied the impact of IPA on glutamatergic
synaptic transmission by whole-cell patch-clamp recordings in
autaptic hippocampal neurons. After 24-hour treatment with
IPA, AMPAR-mediated EPSCs were significantly lower than
controls (−44.0 ± 4.3%; F
2.59= 4.971, p = 0.009; Fig.
4
f). In
keeping with molecular data pointing to specific
hyper-palmitoylation of AMPAR subunits, NMDA response was not
significantly affected by IPA treatment (Fig.
4
f). The spontaneous
miniature EPSC (mEPSC) amplitude, but not their frequency, was
markedly reduced upon IPA stimulation (−34.8 ± 6.1%; F
2.58=
6.766, p
< 0.001; Fig.
4
g), consistent with the reduced AMPAR
density at the postsynaptic site. To check the specificity of the
effects of palmitic acid on synaptic function we treated autaptic
hippocampal microcultures with a cocktail of insulin and oleic
acid (IOA). After 24-h treatment with IOA, we did not observe
any significant changes in evoked AMPAR-mediated and
NMDAR-mediated currents (Fig.
4
f), mEPSCs (Fig.
4
g), nor
did we detect any modification of GluA1 palmitoylation with
ABE assay (Supplementary Fig.
3
g). These
findings focused our
attention on the critical role of IPA-dependent AMPAR
post-translational changes (i.e., increased GluA1 palmitoylation) in the
insulin resistance-related synaptic dysfunction.
Recruitment of AMPARs at the postsynaptic site is a pivotal
determinant of LTP at excitatory synapses
28.To investigate the
effects of IPA on the activity-dependent phosphorylation of
GluA1, we used a chemical LTP protocol (cLTP) that reportedly
enhances surface expression of GluA1-containing AMPARs in
neurons
29. After confirming the increased pGluA1 Ser
845upon
cLTP in our experimental model (Supplementary Fig.
3
h), we
tested the effects of IPA on AMPAR subunit activation. IPA
treatment markedly reduced basal GluA1 Ser
845phosphorylation
and, most importantly, abolished its cLTP-dependent
enhance-ment (F
3.86= 65.62, CTR
NTvs. CTR
cLTPp
= 0.007; CTR
NTvs.
IPA
NTp
= 0.014; Fig.
4
h), thus suggesting that IPA-dependent
unbalance of GluA1 palmitoylation/phosphorylation ratio affects
the activity-dependent changes underlying synaptic plasticity.
zDHHC3 silencing prevents HFD-induced cognitive deficits.
To demonstrate the causative role of zDHHC3/GluA1 pathway in
the synaptic plasticity deficit induced by insulin resistance, we
performed LTP experiments in hippocampal organotypic slices
biolistically transfected with plasmid-encoding shRNA for
zDHHC3. LTP at CA3-CA1 synapses was virtually abolished by
24-h IPA treatment in control slices (+14.6
± 18.4%, shCTR
IPAvs.
160.5
± 23.8%, shCTR
VEH; Fig.
5
a). Silencing of
palmitoyl-transferase did not per se affect the LTP magnitude at CA3-CA1
synapses, but it abolished the IPA-dependent LTP impairment
observed in controls (+161.9
± 35.4%, shzDHHC3
IPAvs. 156.8
±
42.9%, shzDHHC3
VEH; F
3.15= 6.234, shCTR
VEHvs. shCTR
IPAp
= 0.0005; Fig.
5
a). Moreover, to deeply investigate the critical role
of zDHHC3-mediated hyper-palmitoylation in HFD-dependent
cognitive impairment, we specifically inhibited the expression of
palmitoyltransferase in mice fed with SD or HFD by
intra-hippocampal injection of lentivirus harboring shRNA against
zDHHC3 (LV-shzDHHC3) (Supplementary Fig.
4
a). Food
con-sumption and effect of diet on body weight, both monitored
weekly, were comparable between controls (injected with control
shRNA, LV-shCTR) and LV-shzDHHC3 mice (Supplementary
Fig.
4
b), indicating that neither feeding behavior nor gross energy
metabolism were affected in mutant mice. We next checked the
levels of zDHHC3 in the hippocampus of animals. HFD induced
the expression of zDHHC3 in LV-shCTR mice similarly to
non-injected mice (+38.06%, Supplementary Fig.
4
c). Conversely,
LV-shzDHHC3 mice showed reduced levels of palmitoyltransferase
in the hippocampus after both dietary regimens (Supplementary
Fig.
4
c). The silencing was specifically localized at the
hippo-campus as indicated by non-detectable difference of zDHHC3
expression in the neocortex of LV-shzDHHC3 mice
(Supple-mentary Fig.
4
d). Strikingly, LV-shzDHHC3 mice were resistant
to the HFD-dependent cognitive impairment. In particular, in the
NOR test, preference for the novel object was clearly impaired by
HFD in LV-shCTR mice but not in the LV-shzDHHC3 mice
(57.5% vs. 66.9% in shCTR mice, 65% vs. 65.3% in
LV-shzDHHC3 mice; F
3.008= 6.35, LV-shCTR
SDvs. LV-shCTR
HFDp
= 0.0055; LV-shCTR
SDvs. LV-shzDHHC3
HFDp
= 0.34; Fig.
5
b),
confirming the pivotal role of zDHHC3 in the detrimental effect
of nutrient overload on this cognitive task. Moreover,
LV-shzDHHC3 animals fed HFD showed learning curves similar to
both LV-shzDHHC3 mice and controls fed SD during the
training phase of MWM and spent less time to reach the platform
than LV-shCTR mice fed HFD starting from the second day of
the training (F
3.008= 9.81 for day 2, F
3.008= 5.74 for day 3, and
F
3.008= 7.02 for day 4; LV-shCTR
SDvs. LV-shzDHHC3
HFDp
>
0.05 in all days; Fig.
5
c). Accordingly, LV-shzDHHC3 mice fed
HFD remembered the platform location during the probe test of
MWM and spent significantly more time in the target quadrant
Fig. 4 IPA affects synaptic localization of GluA1 and AMPA currents in hippocampal neurons. a Immunoblots of control (–) and BS3cross-linked (+) surface exposed receptors upon treatment with vehicle (CTR) or IPA showing cytoplasmic GluA1 monomers (C) and surface subunit tetramers including GluA1 (S).b Densitometry of both cell surface (left) and intracellular (right) GluA1 fractions normalized to tubulin; the experiment was repeated six times (statistics by Mann–Whitney test). c Immunofluorescence analysis of surface GluA1 in hippocampal neurons. A magnification is shown in the box (right); scale bar= 5 μm. d Immunoblots of GluA1 interaction with both PSD95 (top) and actin (middle). On bottom, cell lysates probed with α-PSD95, α-actin, and α-GluA1. The experiment was repeated four times. e Confocal images of immunofluorescence double staining of neurites upon IPA treatment. PSD95 (fuchsia) and GluA1 (green) immunoreactivity are merged. Neurites are visualized by phalloidin staining and differential interference contrast image (DIC). Arrows show dendritic spines exhibiting co-localization of GluA1 and PSD95; scale bar= 10 μm. f Representative traces (top) and bar graphs showing mean AMPAR (bottom, left) and NMDAR currents (bottom, right) in autaptic neurons exposed to vehicle (CTR), IPA, or insulin and oleic acid (IOA); recordings for AMPAR currents:n = 21 per each group (statistics by one-way ANOVA and Student–Newman–Keuls post hoc). g Representative traces (top) and bar graphs showing mean mEPSC frequency (bottom, left) and amplitude (bottom, right) in autaptic neurons; mEPSC recordings:n = 21 controls, n = 20 IPA, n = 20 IOA (statistics by one-way ANOVA and Student–Newman–Keuls post hoc). h Immunoblots and densitometry of chemical LTP-dependent pGluA1 Ser845in hippocampal neurons. Experiment was repeated four times (statistics by two-way ANOVA and Bonferroni post hoc). Data are shown as mean± SEM *p < 0.05; **p < 0.01; ***p < 0.001; n.s. not significant. See also Supplementary Fig.3
than LV-shCTR mice fed HFD (time in the target quadrant:
F
3.008= 4.87, LV-shCTR
SDvs. LV-shCTR
HFDp
= 0.004;
LV-shCTR
SDvs. LV-shzDHHC3
HFDp
= 0.61; LV-shzDHHC3
HFDvs. LV-shCTR
HFDp
= 0.003; time spent in the 4 quadrants: F
3.008= 7.59 for LV-shCTR
HFD, NE vs. SE p
= 0.83; Fig.
5
d). Notably,
zDHHC3 silencing also abolished both the hyper-palmitoylation
(+ 39.7%; F
4.75= 13.64, LV-shCTR
SDvs. LV-shCTR
HFDp
= 0.013;
LV-shCTR
SDvs. LV-shzDHHC3
HFDp
= 0.11; Fig.
5
e) and the
hypo-phosphorylation (−49.6%; F
3.49= 8.55, LV-shCTR
SDvs.
LV-shCTR
HFDp
= 0.016; Fig.
5
f) of AMPA receptor subunit in the
hippocampi of HFD mice. Moreover, biolistic overexpression of
palmitoylation-deficient GluA1 (GluA1 C585S/C811S), but not
GluA1 wild type (WT), abolished the impairment of LTP induced
by IPA in organotypic slices (F
2.89= 3.128, GluA1 WT
VEHvs.
GluA1 WT
IPAp
= 0.004; Fig.
5
g). Collectively, our
findings point
to the key role of both zDHHC3 overexpression and AMPAR
IP: α - GluA1 IB: Streptavidin (palmitoylation) IB: α- GluA1 α- GluA1 α- Tubulin α- pGluA1 NH2OH sh CTR VEH 1 1 1 1 2 400 250 n.s. n.s. shCTR VEH shCTR IPA shzDHHC3 VEH shzDHHC3 IPA LV-shCTR SD 80 n.s. n.s. ** 70 60 50 Preference index (%) Latency (s) 40 40 30 20 10 0 30 20 10 0 1 2 3 4 1.6 1.4 1.2 1 0.8 GluA1 plamitoylation (relative units)
pGluA1 / GluA1 (relative units) 0.6 0.4 0.2 0 1.2 n.s. n.s. * 1 0.8 0.6 0.4 0.2 0 Training (days) LV-shCTR HFD LV-shzDHHC3 SD ** ** ** LV-shzDHHC3 HFD 45 40 ** ** *** *** *** n.s. n.s. n.s. * n.s. 35 30 25 20 15 10 Time in quadrant (s) 5 0 NE SE SW NW NE SE SW NW NE SE SWNW NE SE SW NW *** 200 150 100 50 0 300 200 100 EPSC amplitude (%) LTP (%) 0 2 2 2 20 ms 100 pA sh CTR IPA sh zDHHC3 VEH sh zDHHC3 IPA Stim 1 0 5 10 15 20 25 30 Time (min) SD HFD SD SD HFDHFD SD SD HFDHFD SD HFD SD HFD SD – – – – + + + + HFD LV-shCTR LV-shzDHHC3 LV-shCTR LV-shzDHHC3 GluA1 WT GluA1 C585S/C811S
VEH IPA VEH IPA 1 1 1 1 2 500 EPSC amplitude (%) 400 300 200 100 0 0 5 10 15 20 25 Time (min) Stim 1 30 2 2 2 25 ms 100 pA 250 n.s. GluA1 WT VEH GluA1 WT IPA GluA1 C585S/C811S VEH GluA1 C585S/C811S IPA n.s. ** 200 150 LTP (%) 100 50 0 LV-shCTR LV-shzDHHC3 2
a
b
c
d
e
f
g
hyper-palmitoylation in the cognitive impairment induced by
HFD.
2-BP rescues synaptic plasticity in mice fed HFD. To get
information potentially useful for the development of
pharma-cological strategies against cognitive decline in metabolic disease,
we tested the effects of the non-specific inhibitor of
S-palmitoy-lation, 2-BP, on synaptic plasticity and cognitive impairment in
our models of brain insulin resistance. In hippocampal
organo-typic slices concurrently treated with IPA and 2-BP LTP was not
significantly different from controls (Supplementary Fig.
5
a).
Notably, 24-h treatment with 5
µM 2-BP alone did not per se
affect the LTP magnitude at CA3-CA1 synapses (Supplementary
Fig.
5
a), nor modified mEPSC frequency, mEPSC amplitude, and
AMPA-mediated current density (mEPSC frequency: 0.71
± 0.17
[n
= 14] and 0.71 ± 0.07 Hz [n = 17], in vehicle-treated and
2-BP-treated slices, respectively, p
= 0.99; mEPSC amplitude: 19.1 ± 2.4
and 15.6
± 1.8 pA, respectively, p = 0.26; AMPA current density:
8.8
± 0.4 and 10.1 ± 0.3 pA pF
−1, p
= 0.48; statistics by unpaired
Student’s t-test.). Strikingly, ABE assay performed on the same
slice preparations showed that 2-BP reverted GluA1
palmitoyla-tion (Supplementary Fig.
5
b). Control experiments showed no
toxicity of 2-BP under our experimental conditions. Specifically,
the percentage of apoptotic neurons after treatment with 5
µM
2-BP for 24 h was not significantly different from controls (16 ±
1.7% [n
= 1886 cells] vs. 14 ± 1.4% [n = 1829 cells], respectively;
Supplementary Fig.
5
c). Thus, 2-BP appeared to be a drug with
the potential to counteract the effects of HFD on brain plasticity.
These
findings prompted us to investigate the in vivo efficacy
of 2-BP. Mice fed for 6 weeks with either SD or HFD were
intranasally injected with saline or 2-BP for the entire duration of
the diet. At the end of dietary regimen, we investigated the effect
of 2-BP on hippocampal synaptic plasticity, learning, memory,
and GluA1 palmitoylation. Interestingly, LTP at CA3-CA1
synapses was completely restored in hippocampal brain slices
obtained from mice treated with HFD + 2-BP (95.8
± 11.3%,
HFD
2-BPmice vs. 33.5
± 6.4%, HFD
VEHmice; F
2.96= 10.03,
SD
VEHvs. HFD
VEHp
= 0.00011 and HFD
2-BPvs. HFD
VEHp
=
0.00028; Fig.
6
a). Moreover, in the NOR test HFD
2-BPmice
showed a significantly higher preference toward the novel object
than HFD
VEHanimals (68.3
± 1.7% vs. 59.2 ± 0.5%; F
3.008= 34.17,
SD
VEHvs. HFD
VEHp
= 9.16 × 10
−7and HFD
2-BPvs. HFD
VEHp
=
8.67 × 10
−6; Fig.
6
b) that was not significantly different from
SD
VEHmice. Additionally, co-administration of 2-BP almost
completely abolished the detrimental effects of HFD during the
training of MWM (day 2: F
3.008= 3.6, SD
VEHvs. HFD
VEHp
=
0.0013, HFD
VEHvs. HFD
2-BPp
= 0.012; day 3: F
3.008= 4.06,
SD
VEHvs. HFD
VEHp
= 0.007, SD
VEHvs. HFD
2-BPp
= 0.44; and
day 4: F
3.008= 15.26, SD
VEHvs. HFD
VEHp
= 1.7 × 10
−3, SD
VEHvs.
SD
2-BPp
= 0.907; HFD
VEHvs. HFD
2-BPp
= 0.00085; Fig.
6
c).
Accordingly, HFD
2-BPmice discriminated the target quadrant
similarly to controls, and they spent there significantly more time
than HFD
VEHanimals (time in the target quadrant: F
3.008= 5.22,
SD
VEHvs. HFD
VEHp
= 0.0009, SD
VEHvs. SD
2-BPp
= 0.175;
SD
VEHvs. HFD
2-BPp
= 0.145; HFD
VEHvs. HFD
2-BPp
= 0.011;
time spent in the four quadrants: F
3.008= 29.02 for SD
VEH, F
3.008= 15.94 for SD
2-BP; F
3.008= 10.96 for HFD
VEHNE vs. SE p
= 0.52,
F
3.008= 19.75 for HFD
2-BP; Fig.
6
d). These
findings indicate that,
in our experimental conditions, 2-BP rescued both hippocampal
synaptic plasticity and hippocampus-dependent memory
impair-ment induced by HFD without affecting LTP, learning, and
memory in SD mice. Finally, GluA1 palmitoylation in
hippo-campal slices obtained from HFD
2-BPmice was significantly lower
than in HFD
VEHslices and not significantly different from
controls (F
3.86= 13.27, SD
VEHvs. HFD
VEHp
= 0.03, SD
VEHvs.
SD
2-BPp
= 0.2, HFD
VEHvs. HFD
2-BPp
= 0.025; Fig.
6
e).
Remark-ably, these results were independent of peripheral effects of 2-BP
on metabolism, as indicated by comparable insulin levels and
weight between HFD
VEHand HFD
2-BPmice (Supplementary
Fig.
5
d).
Discussion
HFD in C57BL/6 mice is a well-established experimental model
of obesity and insulin resistance, almost completely resembling
the hallmarks of metabolic syndrome identified in humans
30. It
also impacts on brain function and affects synaptic plasticity,
learning, and memory through molecular mechanisms that are
still poorly understood
31. Palmitoylation dynamically regulates
neuronal protein localization and synaptic function
32. Essentially,
palmitoylation consists of the covalent binding of a palmitic acid
molecule to a protein, but is unknown whether diet-dependent or
metabolic disease-dependent fatty acid excess can have an impact
on protein palmitoylation and alter synaptic function, learning,
and memory. Here we show that HFD increases palmitic acid
accumulation in the hippocampus of mice (Fig.
1
b), induces
hippocampal insulin resistance (Fig.
1
d, e), and impairs synaptic
plasticity (Fig.
1
a). Insulin has been reported to interfere with
protein palmitoylation in endothelial cells
33and to underlie the
cross talk between metabolic dysfunction and synaptic plasticity
impairment
34. Therefore, our hypothesis was that HFD altered
the palmitoylation of neuronal proteins critically involved in
synaptic plasticity.
We started testing the palmitoylation of AMPAR and NMDAR
subunits because this post-translational modification is known to
regulate their trafficking and insertion to neuronal membrane
during LTP
32. We found that HFD specifically impinges on
Fig. 5 Hippocampal silencing of zDHHC3 abolishes HFD-dependent learning and memory impairment. a Time course (left) of LTP at CA3-CA1 synapses in hippocampal organotypic slices transfected with plasmid-encoding for control shRNA or zDHHC3 shRNA and treated with vehicle (VEH) or IPA for 24 h. Results are expressed as percentages of baseline EPSC amplitude (=100%). Insets (top) show representative EPSC at baseline (1) and during the last 5 min of LTP recording (2). On right, mean LTP values during the last 5 min (n = 7 for each group; statistics by two-way ANOVA and Bonferroni post hoc). b Preference for the novel object of mice fed SD or HFD and injected with lentiviral particles harboring control shRNA (LV-shCTR) or shRNA against zDHHC3 (LV-shzDHHC3) (n = 9 for each group; statistics by two-way ANOVA and Bonferroni post hoc). c Latency to reach the platform (n = 9 for each group; significance is indicated for LV-shCTRHFDvs. all other groups; statistics by two-way ANOVA and Bonferroni post hoc).d Time spent in the four
quadrants during probe test. NE is the target quadrant (n = 9 for each group; statistics by two-way ANOVA and Bonferroni post hoc). e Palmitoylated GluA1 (left, top) and total immunoprecipitated protein (left, bottom) in hippocampi. Densitometry (right) of palmitoylated GluA1/total immunoprecipitated GluA1 ratio (n = 3 per each group; statistics by two-way ANOVA and Bonferroni post hoc). f Immunoblots of pGluA1 Ser845and densitometry of pGluA1
Ser845normalized to both the total GluA1 and tubulin (n = 5 mice per group; statistics by two-way ANOVA and Bonferroni post hoc). g Time course (left) of LTP at CA3-CA1 synapses in hippocampal organotypic slices transfected with plasmids encoding for GluA1 WT or GluA1 C585S/C811S. Results are expressed as percentages of baseline EPSC amplitude (=100%). Insets (top) show representative EPSC at baseline (1) and during the last 5 min of LTP recording (2). On right, mean LTP values during the last 5 min (n = 12 for each group; statistics by two-way ANOVA and Bonferroni post hoc). Data are expressed as mean± SEM *p < 0.05; **p < 0.01; ***p < 0.001; n.s. not significant. See also Supplementary Fig.4
palmitoylation of GluA1 and GluA2, but not other glutamate
receptor subunits (Fig.
2
a, b and Supplementary Fig.
2
a,b), thus
suggesting that HFD-dependent hyper-palmitoylation depends
on specific enzyme activation. HFD transcriptionally induced the
acyltransferase zDHHC3 (which targets GluA1) (Fig.
2
e) and
promoted its palmitoylation (Fig.
2
f) in the hippocampus. To
identify the metabolic signals affecting AMPAR palmitoylation
and deeply investigate their functional outcomes, we set up an
in vitro model of insulin resistance. We found that exposure of
hippocampal neurons to IPA reproduced both the insulin
sig-naling alterations (Fig.
3
a, b) and the overexpression of zDHHC3
(Fig.
3
c) that we observed in the hippocampus of HFD mice. The
critical step seems to be the dephosphorylation/activation of
FoxO3a that regulates the nuclear localization of this
transcrip-tion factor
35. FoxO activity is closely related to the insulin and
fatty acid response in tissues
36,37. We demonstrated that, upon
IPA stimulation, FoxO3a was hypo-phosphorylated (Fig.
3
a) and
it bound more avidly a regulatory sequence on the zDHHC3
promoter (Fig.
3
d). The transcriptional regulation of zDHHC3 by
FoxO3a and its post-translational activation add novel elements
to the complex modulation of synaptic function by insulin
38.
Insulin may directly stimulate AMPA receptor phosphorylation
39and endocytosis
40. Additionally, phosphotidylinositide-3-kinase,
which is the main arm of insulin signaling, increases cell surface
expression of AMPARs along with LTP
41. However, we
demon-strated that application of IPA, but not insulin alone or IOA,
increased both the expression/activation of zDHHC3 (Fig.
3
c)
and the palmitoylation of GluA1 (Supplementary Fig.
3
g).
Col-lectively, this
first set of data indicates that both the increase of
substrate availability (i.e., the palmitic acid) and the increased
activity of zDHHC3 are required for the HFD-related
hyper-palmitoylation of GluA1. We also found that the IPA-dependent
GluA1 hyper-palmitoylation decreased its phosphorylation
(Fig.
3
f) and its surface membrane localization (Fig.
4
a–c),
SD VEH 200 EPSP amplitude (%) 150 100 50 40 40 35 30 25 20 15 10 5 0 NE SE SW NW NE SE SW NW NESE SW NW NE SE SW NW * * *** *** ** ** * *** n.s. n.s. n.s. 30 20 Latency (s) Time in quadrant (s) 10 0 1 2 3 4 Training (days) SD 2-BP IP: α - GluA1 – – – – – – – – + + + + + + + + IB: Streptavidin (palmitoylation) GluA1 palmitoylation (relative units) IB: α- GluA1 NH2OH HFD SD HFD 2.5 * * n.s. 2 1.5 1 0.5 0 2-BP – + – + SD HFD SD 2-BP HFD VEH HFD 2-BP 0 10 20 30 40 50 60 70 250 n.s. 80 70 60 50 40 30 20 10 0 n.s.*** *** n.s. SD VEH SD 2-BP HFD 2-BP HFD VEH n.s.*** *** 200 150 100 LTP (%) Preference index (%) 50 0 2-BP – + – SD HFD + 2-BP – + – SD HFD + Time (min) HFS 1 2 1 2 1 2 1 2 1 2 0.2 mV 10 ms
a
b
c
d
e
Fig. 6 2-BP reverts GluA1 palmitoylation and rescues both synaptic plasticity impairment and memory loss induced by HFD. a Time course (left) of LTP at CA3-CA1 synapses induced by HFS delivered at time 10 (line) in hippocampal slices of mice fed with SD or HFD for 6 weeks and intranasally injected with vehicle or 2-BP (SDVEH, SD2-BP, HFDVEH, HFD2-BP;n = 12 slices per each group). Results are expressed as percentages of baseline EPSP amplitude (=100%).
Insets (top) show representative EPSPs at baseline (1) and during the last 5 min of LTP recording (2). On right, LTP recorded during the last 5 min (statistics by two-way ANOVA and Bonferroni post hoc).b Preference for the novel object in NOR paradigm (n = 9 for each group; statistics by two-way ANOVA and Bonferroni post hoc).c Latency to reach the hidden platform in MWM test (n = 9 for each group; significance is indicated between SDVEHor
HFD2-BPand HFDVEHmice; statistics by two-way ANOVA and Bonferroni post hoc).d Time spent in the four quadrants during probe test of MWM test. NE
is the target quadrant (n = 9 for each group; statistics by two-way ANOVA and Bonferroni post hoc). e Immunoblots (left) of palmitoylated GluA1 (top) and total immunoprecipitated protein (bottom) in hippocampi of SD and HFD mice. On right, densitometry of palmitoylated GluA1/total
immunoprecipitated GluA1 amount ratio (n = 4; statistics by two-way ANOVA and Bonferroni post hoc). Data are expressed as mean ± SEM *p < 0.05; **p < 0.01; ***p < 0.001; n.s. not significant. See also Supplementary Fig.5
thereby inhibiting AMPAR response at the postsynaptic level
(Fig.
4
f, g) under both basal conditions and following
activity-dependent stimulation.
GluA1 delivery to dendritic spines is crucial for LTP
induc-tion
42,43, as also demonstrated by GluA1 knockout mice lacking
LTP
44and showing spatial memory deficits
45. Accordingly, we
showed that LTP at CA3-CA1 synapses was impaired in both
organotypic hippocampal slices treated with IPA and brain slices
obtained from hippocampi of HFD mice (Supplementary Fig.
5
a
and Fig.
6
a, respectively). The genetic blockade of zDHHC3 in
both organotypic brain slices treated with IPA and hippocampi of
HFD mice abolished the LTP (Fig.
5
a) and memory deficits
(Fig.
5
b–d), respectively. More importantly, the overexpression of
GluA1 mutant lacking the palmitoylation sites in organotypic
slices almost completely annulled the detrimental effects of
insulin resistance on synaptic plasticity (Fig.
5
g). In future studies
we plan to validate our
findings in a palmitoylation-deficient
GluA1 mouse model. Finally, treatment of HFD mice with the
non-specific palmitoylation inhibitor, 2-BP, completely rescued
hippocampal synaptic plasticity and memory deficits (Fig.
6
a–e),
thus suggesting the potential efficacy of 2-BP and/or other more
specific drugs targeting zDHHC3 in metabolic-dependent
cog-nitive impairment, as well as in other neurological diseases
associated with altered plasticity involving AMPARs. Certainly,
2-BP may act on numerous targets and modulate the palmitoylation
of several synaptic proteins, leading to changes that may either
promote (in case they occur on GluA1 or GluA2) or inhibit
synaptic plasticity (in case they occur on PSD95 or GABAA
receptor
γ2). The scenario is also more complex because
palmi-toylation of different cysteine residues in the same target may
induce opposite effects (e.g., NR2A or NR2B)
9, and there is
evi-dence that 2-BP may also inhibit depalmitoylating enzymes such
as thioesterases
46. Consequently, it is very difficult to predict the
net result of many, and potentially conflicting, effects exerted by
2-BP on different targets involved in the establishment of LTP.
We cannot rule out that the effects of HFD on hippocampal
synaptic plasticity may partly depend on altered palmitoylation of
other zDHHC3 targets, as suggested by the increased
palmitoy-lation of GabaA Rɣ2 (Supplementary Fig.
2
b,c). Besides affecting
the palmitoylation of several neuronal proteins, 2-BP also induces
other effects including modulation of fatty acid
β-oxidation and
NADPH cytochrome c reductase activity
47]‚48. Collectively, our
findings suggest that both HFD and IPA hinder hippocampal
plasticity and hippocampal-dependent learning and memory by
reducing AMPAR trafficking at synapses because of
zDHHC3-dependent hyper-palmitoylation of GluA1. Our study adds a new
layer to AMPAR and synaptic plasticity regulation by
nutrient-related signals and propose a novel molecular circuitry triggered
by brain insulin resistance and involving
epigenetic/post-trans-lational regulation of zDHHC3, potentially linking metabolic and
neurodegenerative diseases. Emerging evidence suggests that
zDHHCs are associated with several neurological disorders
32.
Future studies are necessary to determine the contribution of
metabolic regulation of protein palmitoylation to the age-related
and diet-related cognitive decline.
Methods
Animals. Male C57BL/6 mice (30–35 days old), derived from Animal Facility of Catholic University, were used and randomly assigned to two feeding regimens: (i) standard diet (SD, control) and (ii) HFD. Different groups of mice were used for each experimental test. Mice were always housed in group (3–5 animals per cage), except after stereotaxic injection when they were singularly housed. All animal procedures were approved by the Ethics Committee of the Catholic University and were fully compliant with Italian (Ministry of Health guidelines, Legislative Decree No. 116/1992) and European Union (Directive No. 86/609/EEC) legislations on animal research. The methods were carried out in strict accordance with the approved guidelines. The animals were housed under a 12-h light-dark cycle at
room temperature (RT: 19–22 °C), fed with their respective diet and water ad libitum and body weight was weekly monitored.
Diet and drug administration. Mice from the same litter were randomly assigned to different experimental groups. Animals were fed with SD or HFD (whose caloric intake was composed by 60% of saturated fatty acids) for 6 weeks. The diets were from Mucedola (Italy). For drug administration experiments, mice were intrana-sally injected with saline or 2-BP (0.125 nMol per nostril, three times per week) for the entire duration of the diet. For western blotting experiments the mice were starved for 14–16 h before intranasal stimulation with insulin.
Ex vivo electrophysiology on hippocampal slices. All experiments were per-formed on 10–11-week-old male C57BL/6 mice as previously described49. Local
field potentials (LFPs) were elicited in the CA1 area by placing a bipolar concentric stimulating electrode (FHCNeural microTargeting Worldwide) in the Schaffer collateral pathway. The electrode was connected to a current stimulus isolator (World Precision Instruments). A low impedance glass pipette (1–2 MΩ) was filled with ACSF and placed immediately below the CA1 stratum pyramidale. Recordings were performed in current clamp I= 0 mode, using a Multiclamp 700B/Digidata 1550 A system (Molecular Devices). First, the input–output relationship was con-structed and the stimulus intensity resulting in 30% of maximal response amplitude was found. After achieving a stable baseline response, LTP was induced by using the high-frequency stimulation protocol (one train of stimuli at 100 Hz, lasting 1 s, repeated four times with an inter-train interval of 10 s). After LTP induction, LFP response amplitude was monitored for at least 60 min. Data were analyzed as previously described49.
Whole-cell patch-clamp recordings on autaptic cultures. Autaptic hippocampal neurons were prepared as previously described50and studied from 14 to 21 DIV. Recordings were considered stable when the series and input resistances, resting membrane potential, and stimulus artifact duration did not change>20%. Recordings were obtained with an Axopatch 200B amplifier (Molecular Devices), and stimulation and data acquisition were performed with a Digidata 1200 series digital interface and Clampex 10.2 software (Molecular Devices). EPSCs were recorded in whole-cell mode during continuous perfusion with Tyrode’s solution containing 4 mM Ca2+, while voltage clamping neurons at−70 mV, with stimuli mimicking action potentials (2 ms at 0 mV) delivered every 20 s. NMDA currents were evoked during continuous perfusion with 4 mM Ca2+, Mg2+-free Tyrode’s
solution containing 10μM of the AMPA receptor blocker NBQX (Tocris Bioscience). mEPSCs were recorded at−70 mV in 60-s epochs. All experiments were performed at RT. Data were analyzed as previously described50.
Hippocampal slice cultures. Hippocampal organotypic slice (350μm) cultures were prepared from postnatal day 4–7 rats through a McIllwain tissue chopper as described by Kim and colleagues51. Plasmids were biolistically transfected into
slices at DIV 4–5 by using Gene-Gun (Bio-Rad, CA, USA). GluA1 plasmids were transfected together with a plasmid enconding enhanced greenfluorescent protein (EGFP) to identify the transfected neurons. LTP experiments were performed 2–4 days later.
ELISA assay. Plasma insulin concentration was determined by using a commer-cially available Elisa kit (Immunological Sciences). Blood samples were collected from the retro-orbital plexus with sterile glass Pasteur pipettes. After centrifuga-tion, plasma was separated, and stored at−80 °C until further use. The assay was performed according to the manufacturer’s instructions.
Sample preparation and GC-FID analysis. Lipid extraction from the brain tissue was carried out according to Bligh and Dyer method52. The hippocampus samples (15 mg) were homogenized in a glass potter and treated with 3 mL of CH2Cl2:
CH3OH mixture (1:2 v/v). Then 1 mL of CH2Cl2and 1 mL of distilled water were
added and the resulting mixture was stirred for 30 s. The organic layer wasfiltered using PTFE microfilters (pore size is 0.45 μm), and the solvent distilled off in vacuum to give a residue of about 2 mg for hippocampus. Finally, a weighted amount of octanoic acid C8:0 (internal standard, IS) was added to the extract. Samples suitable for the GC-FID analysis were prepared by converting the fatty acid (FA) into the corresponding methyl esters (FAME) by treatment of sample (2–15 mg) with 17 % BCl3hexane solution (1 mL) according to the method by
Morrison and Smith53. The hexane solution was left at 90 °C for 1 h, and then concentrated to afinal volume of 0.2 mL before the GC-FID analysis.
The GC-FID analyses were carried out using a Thermo Scientific FOCUS GC equipped with a FID detector, split/splitless injector, and HP-Innowax capillary column (30 m × 0.25 mm I.D., 0.25μm film thickness) from Agilent Technologies. Oven temperature was programmed with a ramp from 100 to 240 °C at 10 °C min
−1and then at 240 °C for 20 min. Injector and detector temperatures were set at 240
and 250 °C, respectively. Helium was employed as carrier gas with aflow rate of 1.7 mL min−1; 1μL aliquots were injected and the split ratio of 1:10 was used. Data acquisition was carried out using Chrom-Card Data System. Identification of the
chromatographic peaks was made by comparing the retention times of commercial standards.
Reagents and standards. Fatty acid standards, namely octanoic acid (C8:0), C8:0 methyl ester, palmitic acid (C16:0), palmitoleic acid, stearic acid (C18:0), oleic acid (C18:1n-9), and Supelco 37 Component FAME Mix were purchased from Sigma-Aldrich. All solvents and reagents used for the sample preparation and fatty acid dosage were from Sigma-Aldrich. Boron Trichloride solution (ca. 17% in Hexane, ca. 1.0 mol per L) was from TCI Europe. 2-bromohexadecanoic acid (2-BP) was from Santa Cruz. For chemical LTP induction, the cells were incubated with strychnine 0.01 mM, picrotoxin 0.05 mM, glycine 0.3 mM, and tetrodotoxin 0.001 mM. Insulin was from Sigma-Aldrich. For in vitro experiments we used: 20 nM insulin, 0.2 mM palmitic acid, 0.2 mM oleic acid, and 5µM 2-BP. Lentiviral par-ticles harboring shRNA against mouse zDHHC3 and shRNA control were from Santa Cruz Biotechnology. Plasmid-encoding for control shRNA,
zDHHC3 shRNA, and EGFP were from Origene. Plasmid-encoding for GluA1 WT and GluA1 C585S/C811S were a gift from Prof. Richard L. Huganir (The Johns Hopkins University, Baltimore, MD).
Western blotting. Cells and tissues were lysed in ice-cold lysis buffer (NaCl 150 mM, Tris-HCl 50 mM pH 8, and EDTA 2 mM) containing 1% Triton X-100, 0.1% SDS, 1 × protease inhibitor cocktail (Sigma-Aldrich), 1 mM sodium orthovanadate (Sigma-Aldrich), and 1 mM sodiumfluoride (Sigma-Aldrich). The cells were incubated for 15 min on ice with occasional vortexing, spun down at 22,000 × g, 4 ° C, and supernatant quantified for protein content (DC protein assay; Bio-Rad). Equal amounts of protein were diluted in Laemmli buffer, boiled, and resolved by SDS-PAGE. The primary antibodies (available in Supplementary Table2) were incubated overnight and revealed with HRP-conjugated secondary antibodies (Cell Signaling Technology Inc., Danvers, MA). Anti GluA1 (from Millipore) and anti-PSD95 (from Cell Signaling) were diluted 1:1000. Protein expression was evaluated and documented by using UVItec Cambridge Alliance. Images shown were cropped for presentation with no manipulations. The uncropped blot scans of these experiments are shown in Supplementary Figs.6–10
Acyl-biotinyl exchange assay. ABE was performed as described by Brigidi et al. with minor changes54. Briefly, cells and tissues were lysed in lysis Buffer A (150 mM NaCl, 50 mM Tris-HCl, 1% NP-40, and 1% Triton X-100, pH 7.5) with 1 × protease inhibitor cocktail Aldrich), 1 mM sodium orthovanadate (Sigma-Aldrich), 1 mM sodiumfluoride (Sigma-Aldrich), and 10 mM of N-ethylmaleimide (NEM, Sigma-Aldrich) freshly prepared. Samples were sonicated for 10 s on ice and spun down at 22,000 × g, 4 °C. After the centrifugation, the supernatant was transferred to a new tube, while a small volume of Buffer A containing 1% SDS was added to the pellet. The samples were again sonicated for 10 s on ice and spun down at 22,000 × g, 4 °C. The novel supernatant was added to the one recovered from thefirst lysis. The lysates were precleared for 30 minutes with empty protein G-sepharose 4B beads (Sigma-Aldrich) before adding 1–2 μg of specific primary antibodies. The samples were incubated overnight at 4 °C with rotating mixer, and then re-incubated with fresh protein G matrix for 3 h at 4 °C. Each sample was split in two halves. One of them was incubated with a buffer containing HAM (Lysis Buffer B: 150 mM NaCl, 50 mM Tris-HCl, 1 M hydroxylamine, 1% NP-40, 1% Triton X-100, and 1 mM biotin-BMCC, pH 7.2). Subsequently, both were incu-bated for 1 h at 4 °C. The samples were briefly washed and incuincu-bated with biotin-BMCC (lysis buffer C: 150 mM NaCl, 50 mM Tris-HCl, 10μM biotin-BMCC, 1% NP-40, and 1% Triton X-100, pH 6.2) for 2 h at 4 °C in a rotating mixer. The samples were then washed once in Buffer B and twice in Buffer A. Beads were finally resuspended in 30 μL of 1 × Laemmli buffer and heated at 90 °C for 5 min. Eluted proteins were resolved using SDS-PAGE and immunoblotting.
A variant of the ABE assay (named“proteomic ABE”) was performed as described by Wan et al.55. Tissues were lysed in a buffer containing 150 mM NaCl, 50 mM Tris, 5 mM EDTA, pH 7.4, 0.2 % SDS, and 1.7 % Triton X-100, with 1 × protease inhibitor cocktail (Sigma-Aldrich) and 10 mM NEM. After 3 chloroform-methanol precipitations, pellets were resuspended in a buffer containing 4% SDS, 0.7 M hydroxylamine and incubated for 1 h at room temperature. After a chloroform-methanol precipitation, the pellets were resuspended in a buffer containing EZ-Link HPDP-Biotin and incubated for 1 h at room temperature. Unreacted HPDP-biotin was removed by chloroform-methanol precipitation and pellets were resuspended in lysis buffer. Samples were diluted to 0.1% SDS and biotinylated proteins were affinity-purified using streptavidin-agarose beads. Beta-mercaptoethanol (1%) was used to cleave HPDP-biotin and release biotinylated proteins from the beads. Proteins were then denatured in sample buffer and analyzed using SDS-PAGE. A list of the antibodies is available in Supplementary Table2. The uncropped blot scans of these experiments are shown in Supplementary Figs.7–11.
Real-time PCR. Quantitative real-time PCR (qRT-PCR) amplifications were per-formed using Power SYBRR Master Mix on AB7500 instrument (Life Technolo-gies) according to the manufacturer’s instructions. The thermal cycling profile featured a pre-incubation step of 94 °C for 10 min, followed by 40 cycles of denaturation (94 °C, 15 s), annealing (55–57 °C, 30 s), and elongation (72 °C, 20 s).
Melting curves were subsequently generated by heating amplified products at 94 °C for 15 s, cooling to 50 °C for 30 s, followed by slow heating to 94 °C in increments of 0.5 °C.
Melting-curve analyses confirmed that only single products had been amplified. All data were analyzed by comparing to the amplification levels of the actin; ROX was used in the SYBR master mix as reference dye. The threshold values determined by the software were used to calculate transcript expression levels employing the cycle-at-threshold (Ct) method. The data are expressed as fold changes (compared to control) for each amplicon, using the 2-ΔΔCt approach. The primer list is shown in Supplementary Table1.
Chromatin immunoprecipitation. Chromatin immunoprecipitation (ChIP) assays were performed as previously described56. Cells lysates were resuspended in 200μl lysis buffer containing 1% SDS, 50 mM Tris-HCl pH 8.0, and 10 mM EDTA and sonicated on ice with six 10-s pulses with a 20-s interpulse interval. Sample debris was removed by centrifugation and supernatants were precleared with protein G-Sepharose 4B beads (Sigma-Aldrich) for 1 h at 4 °C. About 2μg of specific antibody or control IgG were added overnight at 4 °C. Immune complexes were collected by incubation with protein G-Sepharose 4B beads for 2 h at 4 °C. After seven washes, immunoprecipitated complexes were separated from beads by vortexing in 150μL of elution buffer (1% SDS and NaHCO30.1 M; pH 8.0). An aliquot of 13μL of
NaCl were added to the separated lysate and the samples were decross-linked by incubating them overnight at 65 °C. Chromatin fragments were extracted with PCR DNA fragments purification kit (Geneaid). Primers used for zDHHC3 promoter analysis are shown in Supplementary Table1.
PCR conditions and cycle numbers were determined empirically, and each PCR reaction was performed in triplicate. Data are expressed as percentage of input calculated by the“Adjusted input value” method according to the manufacturer’s instructions (Thermo Fisher scientific ChIP analysis). To calculate the adjusted input the Ct value of input was subtracted by 6.644 (i.e., log2 of 100). Next, the percent input of control and IPA samples was calculated using the formula: 100×2
(adjusted input−Ct(ChIP). The percent input of IgG samples was calculated using the
formula 100×2(adjusted input−Ct(IgG).
Co-immunoprecipitation. Cells were lysed in IP buffer (KCl 50 mM, Tris-HCl 50 mM pH 8, EDTA 10 mM, and 1% Nonidet P-40) and part of the lysate was used for total input. The lysates were precleared for 30 min with empty protein G-sepharose 4B beads before being incubated with 1–2 μg of specific antibody or IgG (negative control) and fresh protein G matrix. After 6 h of incubation at 4 °C with rotating mixer, protein G bound immune complexes were collected by centrifugation (22,000 × g, 1 min) and washed six times with IP buffer. Beads werefinally resuspended in 1× Laemmli buffer and boiled for 5 min. Eluted proteins were resolved by SDS-PAGE and immunoblotting. The uncropped blot scans of these experiments are shown in Supplementary Fig.9
Primary cultures of hippocampal neurons. Hippocampal neurons from E17-E19 C57BL/6 mice brains were prepared according to standard procedures57. Briefly,
hippocampal neurons were incubated for 10 min at 37 °C in trypsin-EDTA solu-tion (0.025%/0.01% w/v; Biochrom AG) in 1 × PBS, and tissues were mechanically dissociated at RT with afire polished Pasteur pipette. Cell suspension was har-vested and centrifuged at 600 × g for 5 min. The pellet was resuspended in MEM (Biochrom AG) containing 5% fetal bovine serum, 5% horse serum, 2 mM gluta-mine, 1% penicillin-streptomycin antibiotic mixture (Sigma-Aldrich), and 25 mM glucose. The cells were plated on poly-L-lysine (0.1 mg mL−1; Sigma-Aldrich)
pre-coated wells. After 72 h, medium was replaced again with glutamine-free medium and experiments were performed at 12–14 days in vitro (DIV).
Vitality assay. The percentage of apoptotic cells was evaluated by Vybrant® DyeCycle Violet Kit (Thermo Fisher) using a confocal laser scanning system (A1 MP, Nikon, Tokyo, Japan). A 6-h treatment with 200µM H2O2was used as
positive control.
Immunocytochemistry. Hippocampal neurons werefixed in PBS solution (4% PFA, 4% sucrose, pH 7.4; Sigma-Aldrich) for 15 min at RT. Immunocytochemistry for surface GluA1 staining was performed as described by Leshchyns’ka et al. with minor changes58. Afterfixation, non-specific staining was blocked in 5% normal
goat serum (NGS) at RT for 1 h. Cells were incubated overnight at 4 °C with a primary antibody that recognizes an extracellular epitope of GluA1 (anti GluA1 from Cell Signaling) and then for 90 minutes at RT with the secondary antibody.
To study endogenous GluA1 and PSD95, co-localization of GluA1 and PSD95 and GluA1 accumulated in the Golgi, hippocampal neurons, upon IPA treatment for 24 h, were permeabilized with 0.3% Triton X-100 (Sigma-Aldrich) for 15 min, blocked for 60 min, and then incubated overnight with primary antibodies at 4˚ C (anti GluA1 1:500 from Millipore and anti-PSD95 1:500 from Cell Signaling). Cells were then incubated for 90 min at RT with a mixture of secondary antibodies. To revealfilamentous actin, the cells were incubated with rhodamine-conjugated phalloidin for 30 min at RT. Finally, nuclei were counterstained with 4 ′,6-diamidino-2-phenylindole (DAPI, 0.5μg per mL for 10 min; Thermo Fisher), and