DIPARTIMENTO DI INGEGNERIA AEROSPAZIALE L. Lazzarino
Dottorato di ricerca in Ingegneria Aerospaziale XIXCiclo
Giacomo Valerio Iungo
INVESTIGATION ON THE DYNAMICS OF WAKE
VORTICITY STRUCTURES AND THEIR EXPERIMENTAL
EVALUATION
UNIVERSITÀ DI PISA 1 343 IN SU PREMÆ DIGNITA T ISDottorato di ricerca in Ingegneria Aerospaziale XIXCiclo
INVESTIGATION ON THE DYNAMICS OF WAKE
VORTICITY STRUCTURES AND THEIR EXPERIMENTAL
EVALUATION
I Supervisori Prof. Guido Buresti Prof. Giovanni Lombardi Il Coordinatore Prof. Guido Buresti
Il Candidato
In questo lavoro si `e cercato di dare un contributo alla caratterizzazione delle dinamiche connesse con le strutture vorticose di scia e allo sviluppo di tec-niche di misura e di metodi di correzioni di dati per una corretta valutazione sperimentale delle stesse. L’argomento della presente tesi di dottorato `e co-stituito da due principali progetti: il primo consiste nello studio della scia generata da un prisma di moderato allungamento posizionato trasversalmente rispetto al flusso asintotico, il secondo progetto riguarda l’analisi degli effetti del “wandering” su misure statiche di velocit`a di un vortice d’estremit`a alare. Per quanto riguarda il primo progetto, `e stata realizzata un’estesa campagna di prove riguardante la scia di un prisma a sezione triangolare ed allunga-mento H/w = 3.0 che ha permesso di ottenere una maggiore conoscenza dei meccanismi fisici che danno origine a fluttuazioni del campo di velocit`a e che sono certamente connesse a delle oscillazioni delle strutture vorticose di scia. Una corretta valutazione di tali caratteristiche del flusso `e fondamentale per ridurre l’intensit`a di queste oscillazioni, o in alcuni casi prevenirle. Sono state realizzate delle visualizzazioni, mediante fumo e lama laser, che hanno gene-ralmente confermato le informazioni ottenute da una precedente simulazione LES. Inoltre sono state realizzate una serie di misure mediante sonda anemo-metrica a filo singolo e misure di pressione sulle superfici del modello, e sono stati individuati differenti contributi caratteristici delle fluttuazioni del flusso. Oltre alle fluttuazioni indotte dal distacco alternato di vortici, caratterizzate da un numero di Strouhal St ∼= 0.16, si sono individuate altre componenti con differente energia a seconda della regione del flusso presa in esame. Un contributo a St ∼= 0.05 domina nettamente tutti i segnali di velocit`a acquisiti in prossimit`a del bordo superiore della scia. Questo contributo `e stato asso-ciato ad un’oscillazione verticale, in-fase di una coppia di vortici contro-rotanti generati dagli spigoli anteriori dell’estremit`a libera del prisma. E’ stata indi-viduata, inoltre, una componente intermedia a St ∼= 0.09. Per l’interpretazione del meccanismo fisico che d`a origine a questo contributo `e stata fondamentale l’analisi della simulazione LES. Questa componente `e stata infatti associata alle fluttuazioni di uno strato di vorticit`a trasversale che si distacca dallo spigolo posteriore dell’estremit`a libera. Una volta separato, esso risulta tanto incurvato nella scia da impattare sulla superficie posteriore del modello. Di conseguenza, questo strato di vorticit`a delimita una zona di ricircolo situata immediatamente a valle del modello. Questa morfologia `e stata confermata dalle misure di pressione realizzate sulle facce del modello. Un massimo locale della pressione agente sulla superficie posteriore del modello `e stato infatti riscontrato ad una quota di z/H = 1/3, mentre fluttuazioni a St ∼= 0.09 sono state riscontrate solamente a quote inferiori, ovvero appena fuori dalla zona di ricircolo. Inoltre, le statistiche della frequenza del contributo individuato sono praticamente identiche a quelle relative alla stessa componente ma riscontrate in prossimit`a dello spigolo posteriore dell’estremit`a libera. Da questa analisi ne consegue che molto probabilmente le fluttuazioni riscontrate in queste due dif-ferenti zone sono generate dalla medesima struttura vorticosa, ovvero lo strato di vorticit`a trasversale che si distacca dallo spigolo posteriore dell’estremit`a libera. Dalle visualizzazioni numeriche del campo di vorticit`a si `e osservato
zone alte della scia generando in prossimit`a del piano di simmetria un’azione verticale direttamente sullo strato di vorticit`a trasversale che delimita la zona di ricircolo. Probabilmente `e questa intricata morfologia della scia che d`a origine alle fluttuazioni della zona di ricircolo. Sperimentalmente si `e inoltre osservato che delle modifiche apportate agli spigoli verticali del modello gene-rano una variazione della frequenza del distacco alternato di vortici del tutto analoga a quella prodotta sulla frequenza di oscillazione della zona di ricircolo. Viceversa, non si sono riscontrate variazioni apprezzabili delle fluttuazioni alla frequenza pi`u bassa presenti nella parte alta della scia, il che suggerisce che esse siano essenzialmente connesse ad un’instabilit`a dei vortici assiali che si originano dall’estremit`a del corpo.
Il secondo progetto riguarda lo studio degli effetti del “wandering” sulle misure statiche di un vortice di estremit`a alare e la validazione di metodi per la cor-rezione di tali misure. Il wandering consiste in fluttuazioni non-deterministiche del centro del vortice, le quali fanno si che un vortice caratterizzato mediante misure statiche risulti pi`u diffuso e meno intenso. Sono state effettuate delle simulazioni numeriche del wandering di un vortice di Lamb-Oseen rappre-sentando le posizioni occupate dal centro del vortice mediante una funzione densit`a di probabilit`a bi-normale. Si `e riscontrato che ampiezze di wandering minori del 60% del raggio del vortice sono accuratamente calcolate mediante il rapporto tra RM S della velocit`a tangenziale e il suo gradiente misurato nel centro medio del vortice, ma gli errori aumentano sino al 35% del va-lore effettivo per ampiezze di wandering uguali al raggio del vortice. Inol-tre le simulazioni hanno dimostrato che la posizione degli assi principali del wandering pu`o essere calcolata dal valore opposto del coefficiente di cross-correlazione tra la velocit`a in direzione dell’apertura alare e quella in direzione normale misurato nel centro medio del vortice. Sono stati implementati quat-tro differenti algoritmi per la correzione degli effetti di wandering mediante la deconvoluzione dei campi misurati con la funzione densit`a di probabilit`a che rappresenta il wandering. Le correzioni sono risultate molto accurate per ampiezze di wandering inferiori al 60% del raggio del vortice (errori del 15% della velocit`a tangenziale di picco si raggiungono per ampiezze uguali al raggio del vortice). Successivamente, l’intera procedura per caratterizzare il wander-ing da misure statiche e la correzione dei dati `e stata applicata alle misure di un vortice d’estremit`a generato da una semi-ala N ACA 0012, realizzate mediante una sonda di pressione a cinque fori e mediante una sonda anemo-metrica a tre componenti. Inoltre queste misure sono state confrontate con quelle ottenute mediante la tecnica del “rapid scanning”. Questa tecnica con-siste nell’effettuare le misure facendo ruotare la sonda di pressione attraverso il vortice ad una velocit`a sufficientemente alta da poter considerare il vortice all’incirca fisso durante la traversa. Di conseguenza queste misure possono essere considerate non affette dal wandering. Anche se l’origine del wander-ing non `e stata completamente chiarita, sicuramente esso non `e un fenomeno autoindotto; infatti si `e dimostrato che incrementando l’intensit`a del vortice `e possibile ridurre le ampiezze di wandering. Inoltre, si `e osservato che il wan-dering pu`o essere attenuato incrementando l’incidenza dell’ala, il numero di
di questi parametri. Concludendo, sembra opportuno indicare come principale parametro per il controllo del wandering il rapporto tra l’intensit`a del vortice ed il livello di turbolenza del flusso, poich`e tutti i test sono stati effettuati con le medesime caratteristiche del flusso.
Abstract
The present work gives a contribution to the investigation on the dynamics of wake vorticity structures and to the development of measuring techniques and data correction methods in order to perform their proper experimental evaluation. The topic of this Ph.D. thesis consists of two main projects: sur-vey of the wake generated from a triangular prism of moderate aspect ratio in cross-flow and investigation into the effects of wandering on static velocity measurements of a wing-tip vortex. As for the first subject, a deeper under-standing of the physical mechanisms giving rise to fluctuations of the flow field connected with the wake vorticity structures is reached; this is important not only to predict the features of these fluctuations, but also to prevent their occurrence or reduce their intensity. The velocity fluctuations detected in the wake of a prism having triangular cross-section and an aspect ratio H/w = 3.0 are characterized. Preliminarily, data obtained from a previous Large Eddy Simulation were analysed to gain clues on the wake morphology and the oscil-lations of the wake vorticity structures. Subsequently, flow visualizations with injected smoke and a laser sheet were performed, and generally confirmed the wake characteristics evaluated from the numerical simulation. Single sensor hot-wire anemometer measurements were carried out in the flow field as well as pressure measurements on the free-end and on the rear surface of the model. It is shown that, besides the fluctuations induced by an alternate vortex shed-ding with Strouhal number St ∼= 0.16, further components are present, with different relative intensities in different wake regions. A spectral contribution at St ∼= 0.05 is found to dominate all the velocity signals in the upper-wake and it is attributed to a vertical, in-phase oscillation of a couple of counter-rotating axial vortices detaching from the front edges of the model free-end. An intermediate component is also found, occurring at St ∼= 0.09; the analysis of the previously available LES simulation was fundamental for the interpre-tation of the physical mechanism giving rise to this flow fluctuation, which is associated with the oscillations of a transversal shear layer detaching from the rear edge of the model free-end. Proceeding downstream, it bends downwards into the wake in such a way to be reversed upstream impinging the rear sur-face of the model. Consequently, a recirculation region is delimited by this transversal shear layer. This feature is also assessed from the pressure mea-surements carried out on the model surfaces; indeed, a pressure maximum is ascertained on the rear surface at z/H = 1/3 and fluctuations at St ∼= 0.09 are singled out just at the locations below the recirculation region. Further-more, the statistics of this frequency are comparable to the ones related to the same spectral component singled out in proximity to rear edge of the
free-From the numerical visualizations of the vorticity field it is observed that the fluctuations of the recirculation region are strictly connected with the vortex shedding. Lateral vorticity sheets are dragged in the upper wake generating in correspondence to the wake symmetry plane a direct vertical “action” on the transversal shear layer. Most probably this intricate wake morphology is the physical mechanism giving rise to the oscillations of the recirculation region. Furthermore, it is experimentally assessed that modifications on the vertical edges of the model generate a variation of the vortex shedding frequency com-parable to the one produced on the fluctuation frequency of the transversal shear layer. However, no variations were found in the fluctuations at the lower frequency in the upper part of the wake, which suggests that they are likely to be essentially connected with an instability of the axial vortices originating from the free-end.
The second project is an investigation on the effects of wandering on static measurements of a wing-tip vortex and on the correction of the measured velocity fields. Wandering consists in random oscillations of the vortex core; consequently, vortices evaluated by static measuring techniques appear as more diffuse and weaker than in reality. Numerical simulations of the wandering of a Lamb-Oseen vortex were performed by representing the vortex core locations through a bi-variate probability density function. It was found that wandering amplitudes smaller than 60% of the core radius are well predicted by using the ratio between the RMS value of the azimuthal velocity and its slope measured at the mean vortex centre. With increasing wandering amplitudes the predic-tions become more inaccurate, showing errors of 35% of the actual value for wandering amplitudes comparable to the core radius. Furthermore, from the numerical simulations it was found that the principal axes of wandering are well predicted from the opposite of the cross-correlation coefficient between the spanwise and the normal velocities measured at the mean vortex centre. Four different algorithms were then applied to correct mean velocity fields for wandering smoothing effects. All the methods perform the deconvolution of the mean velocity field with the bi-variate probability density function, that represents the wandering. The methods have the advantage of avoid-ing any assumption or any fittavoid-ing of the mean velocity field. The performed corrections were very accurate for the simulations with wandering amplitudes smaller than 60% of the core radius, whereas errors become larger with in-creasing wandering amplitudes (up to an error of 15% of the actual value on the correction of the peak azimuthal velocity for wandering amplitudes com-parable to the core radius). Subsequently, the whole procedure to evaluate wandering from static measurements and to correct the mean velocity field for wandering effects was applied to the data of a tip vortex generated from a N ACA 0012 half-wing model; these data were obtained using a five hole probe and a three component hot film anemometer. The static measurements corrected for wandering effects were then compared to measurements carried out through rapid scanning. This technique consists in traversing the five hole probe, fixed on a rotating arm, through the vortex core with a sufficiently high velocity in order to consider the vortex as roughly fixed during each scan.
by varying the streamwise distance, the wing angle of attack or the Reynolds number. Firstly, wandering was found to be not a self-induced phenomenon; indeed, its amplitude was reduced with increasing vortex strength. The latter seems to be the principal vortex parameter to control the wandering, as neither the downstream distance, the wing angle of attack or the free-stream velocity have an absolute influence on the wandering. In other words, the wandering amplitude can be reduced by increasing the wing angle of attack, the free-stream velocity, or reducing the free-streamwise distance from the wing, but if the vortex is sufficiently strong it may be completely insensitive to the variation of these parameters. All the tests were performed with the same turbulence level of the free-stream, and thus it might be more suitable affirming that the principal parameter controlling the wandering could be the ratio between the strength of the vortex and the free-stream turbulence level.
1 Introduction 1 2 Investigation on the wake generated from a low aspect-ratio
tri-angular prism 3
2.1 Introduction . . . 4
2.2 Experimental set-up and procedures . . . 7
2.3 Analysis of a previous experimental campaign and of a LES simulation 9 2.4 Flow visualizations . . . 20
2.5 Pressure measurements on the model surfaces . . . 23
2.5.1 Pressure field on the tip and rear surfaces of the model eval-uated from a LES simulation . . . 25
2.5.2 Experimental measurements of the pressure field acting on the free-end and on the rear surface of the model . . . 29
2.6 Hot wire measurements in the wake flow . . . 51
2.6.1 Velocity measurements of the wake generated from the origi-nal model . . . 52
2.6.2 Velocity measurements of the wake generated from the model with modifications on the vertical edges . . . 62
2.6.3 Velocity measurements of the wake generated from the model with modifications on the rear edge of the free-end . . . 73
2.6.4 Velocity measurements of the wake generated from the model with modifications on the front edges of the free-end . . . 79
2.7 Conclusions . . . 81
Bibliography 83 3 Wing-tip vortex wandering 85 3.1 Introduction . . . 87
3.2 The facility . . . 94
3.3 Flow Visualizations . . . 95
3.4 Five hole probe static measurements . . . 99
3.4.1 Setup and five hole probe calibration . . . 99
3.4.2 Measurement conditions and locations . . . 101
3.5.1 Numerical simulations . . . 124
3.5.2 Methods to correct wandering effects on static measurements 130 3.5.3 Correction of wandering effects on the five hole probe static measurements . . . 136
3.6 Rapid scanning . . . 146
3.6.1 Setup . . . 148
3.6.2 Measurements conditions and locations . . . 150
3.6.3 Processing of the velocity signals . . . 152
3.6.4 Evaluation of the instantaneous vortex centre location . . . . 154
3.6.5 Probability density function of the vortex centre locations . . 159
3.6.6 Analysis of the velocity profiles . . . 162
3.7 Static measurements performed through three component hot film anemometry . . . 167
3.7.1 Setup . . . 168
3.7.2 Measurements conditions and locations . . . 169
3.7.3 Processing of the velocity signals . . . 169
3.8 Wandering analysis . . . 174
3.8.1 Streamwise variation of the vortex wandering . . . 174
3.8.2 Effects of the variation of the angle of attack . . . 189
3.8.3 Reynolds number dependency of the vortex wandering . . . . 205
3.8.4 Secondary vorticity structures . . . 215
3.9 Conclusions . . . 219
The vorticity structures present in a wake generated from a body play an extremely important role on both the mean and fluctuating loads acting on the body surfaces. Neglecting the contribution to the drag due to viscosity, modifications of the char-acteristics of the wake vorticity structures, i.e. their intensity and location, can produce significant variations of the drag. From an energetic interpretation, the work done in a certain time interval by the drag force is equivalent to the vari-ation in the total energy of the fluid in the same time interval. Considering the wake generated from a bluff body or from an airfoil, both are characterized by the presence of vorticity structures of opposite sign, having separation distance of the order of the wake width. By representing these vorticity structures with a couple of counter-rotating vortices with finite-size cores, as was done for instance by [12], it may be shown that for a certain amount of vorticity contained in the cores, the kinetic energy connected with a couple of opposite-signed vortices increases as the core radius decreases and the separation distance of the vortices increases.
These considerations imply that the pressure drag is strictly connected with the degree of concentration in space of the vorticity shed in the wake, and with the distance between the regions with opposite-signed vorticity structures. This not only explains why certain bodies have a larger or smaller drag, but can also suggest methods for drag reduction.
As the mean loads are strictly related to the wake vorticity structures, the fluc-tuating loads acting on the body surfaces are related to the oscillations of the wake vorticity structures. This is the case of the first project presented in this thesis, viz. the analysis of the wake flow generated from a triangular prism with mode-rate aspect ratio in cross-flow. The alternate vortex shedding from the rear vertical edges of the model interacts with the dynamics of the vorticity structures generated from the model free-end. Consequently, morphology and dynamic of the wake are more intricate with respect to the two-dimensional case, and to characterize them the main fluctuations observed from the velocity and pressure measurements were associated with the oscillations of the different vorticity structures present in the wake.
Furthermore, the fluctuations of the wake vorticity structures may make them challenging for their experimental measuring. Indeed, the second project is an investigation on the effects of the “wandering” of a wing-tip vortex. Wandering is a universal feature of wind tunnel generated vortices that consists in random displacements of the vortex core. A proper characterization of the flow close to the wing-tip is significant for a proper evaluation of aerodynamic loads and of
the flight mechanics characteristics. Moreover, tip-vortices spread from a large aircraft might represent a significant hazard for other aircrafts that follow in its wake, and thus this phenomenon affects the separation distance between aircrafts and, consequently, it remains a limiting factor on airports operation and capacity. Therefore, these oscillations of the vortex core might produce large errors on static measurements, and thus methods for the correction of the experimental data or suitable measuring techniques are needed.
from a low aspect-ratio triangular
prism
List of Symbols
ρ Air density
U∞ Free stream velocity P∞ Free-stream static pressure
x Coordinate along the free-stream direction
y Coordinate along the transversal direction
z Coordinate along the vertical direction
U Velocity component along the free-stream direction
V Transversal velocity component
W Vertical velocity component
fv Vortex shedding frequency
w Width of the triangular base of the model
H Model height
Re = U∞wν Reynolds number
2.1 Introduction
Bluff bodies in cross-flow are generally subject to unsteady loads due to wake velocity fluctuations. In particular circumstances these forces may cause dangerous self-excited oscillations for elongated bluff structures. The characteristics of these fluctuations depend primarily on the level of organization of the vorticity structures present in the wake. Therefore, understanding the physical mechanisms giving rise to these unsteadinesses is important not only to predict their features, but also to prevent their occurrence or to reduce their intensity, for instance by properly modifying the body shape.
The major phenomenon involved with the wake generated from bluff bodies in cross-flow is certainly the vortex shedding, which consists on a double row of vortices of opposite sign alternately shed from the lateral body surfaces. Vortex shedding occurs with a peculiar non-dimensional frequency that mainly depends on the body cross-section and is usually represented through a non-dimensional frequency called
Strouhal number St = fvw/U∞, where fv is the vortex shedding frequency, w is
the cross-flow width of the body and U∞ is the free-stream velocity.
Alternate vortex shedding is characteristic of the wake flow of practically all two-dimensional bluff bodies. However, it also occurs for finite-length cylinders or prisms placed with their axis perpendicular to a support plane and to the flow, even if differences with respect to the two-dimensional case may be present, and increase as the body aspect ratio H/w (where H is the height of the body) decreases. Indeed, the existence of a free-end gives rise to an intense local flow, which passes over the body tip and is deflected within the separated wake by the low pressures that are present in that region. This flow varies the width of the wake and the pressure field with respect to the two-dimensional condition, and may interact with the flow rounding the sides of the body, producing intense streamwise vortical structures; a significant interference with the regular vortex shedding mechanism may thus be expected. Also the ratio between the height of the body and the thickness of the incoming boundary layer over the plane, H/δ , may have an influence on the flow. However, [19] suggested that the influence of the boundary layer may be neglected for H/δ > 3.0, and in the present work we will consider only configurations in which this condition is satisfied.
Measurements of oscillating pressures and velocity fluctuations around circular cylinders of large aspect ratio, i.e. [1], [10] and [11], have shown the presence, for
H/w > 10, of clear vortex shedding from most of the cylinder span, with Strouhal
numbers of the same order as those typical of two-dimensional flow. However, a decrease of the frequency was found in a zone approaching the upper end of the cylinders, probably due to an increase in the formation length of the shed vortices. The relative extent of this zone, which is likely to be a cell with lower-frequency shedding, increases with decreasing aspect ratio, and for H/w < 5 the vortex shedding from the whole body takes place at a frequency that is lower than in the corresponding two-dimensional case, i.e. [19].
For all aspect ratios, in the very upper region near the tip of the models, i.e. within the last diameter from the free-end, both pressure and velocity fluctuations no longer show a clear peak, and regular vortex shedding cannot therefore be envi-saged. Conversely, the spectra become broad-band and lower frequencies seem to be present, either at 1/2 or 1/3 of the dominating frequency found at lower levels. It is worth mentioning, on this respect, that [13] found significant cross-flow oscillations of a flexible cylinder to occur at a velocity that is three times that corresponding to the normal Strouhal frequency, thus suggesting the presence near the tip of fluctu-ations with a dominating frequency at 1/3 of the usual vortex shedding frequency. Spectra of the velocity fluctuations in the wake confirmed that approaching the tip the energy content at the Strouhal frequency progressively disappeared, with a simultaneous increase of the content at lower frequencies. Further information on the effects of finite aspect-ratio on vortex shedding may be found in [2].
Over the last 10 years an extensive investigation about wakes generated from finite prisms and circular cylinders has been carried out at the Department of Aerospace Engineering of the University of Pisa, in order to characterize the dy-namics of the wake vorticity structures, and to evaluate the mean and unsteady loads acting on the bodies. In [8] prisms with both isosceles and equilateral trian-gular cross-sections and with aspect ratio from 1 up to 3 were tested. In that work a cross-correlation technique based on the continuous complex-wavelet transform, first introduced by [16], to characterize the vortex shedding from low aspect-ratio triangular prisms at Re ∼= 1.2 × 10⁵. By analysing the phase difference between the dominating fluctuations of velocity signals acquired at opposite sides of the wake, it was shown that alternate vortex shedding occurred for all the analysed models, even for an aspect ratio as low as H/w = 1.0. This result is at variance with previ-ous findings deriving from low Reynolds number visualizations of the flow around flat plates, square prisms and finite-length circular cylinders, for which a switching to a symmetrical shedding of arch-type vortices had been found below a certain critical aspect ratio, (H/w)cr. Indeed, [19] and [20] had found that (H/w)cr ∼= 1.25
for a normal flat plate, (H/w)cr ∼= 2.0 for a rectangular prism and (H/w)cr ∼= 2.5
for a circular cylinder. In these experiments the two different types of shedding were detected through smoke-wire visualizations, with the bodies immersed in an incoming boundary layer with thickness of the same order of H. Furthermore, [15], through visualizations in a water tunnel showed that, even with a presumably lower value of δ, the alternate type of shedding occurred for a circular cylinder when H/w ≥ 4.0 and the symmetrical one when H/w ≤ 2.0, thus substantiating the previous findings. However, the two types of vortex shedding had never been characterized at high Reynolds numbers through measurements of the phase diffe-rence between the velocity fluctuations at the two sides of the wake. [8] explained their findings as being probably due to the influence of Reynolds number on the stability of the symmetrical configuration.
Subsequently, the alternate vortex shedding from the lateral sides of triangular prisms was deeply characterized. The models were placed with the wind normal
to the cross-section base or against their apex edge, i.e. [3] and [4]. The alternate vortex shedding was found to exist for all the tested aspect-ratio values, even though a reduction of the vortex shedding frequency with decreasing aspect ratio was observed. Furthermore, the regularity and intensity of vortex shedding were also reduced with decreasing aspect ratio, particularly when the incoming flow was directed against the apex edge of the prisms. The loads acting on the bodies were then surveyed, see [14], and it was found that the loads were slightly reduced with decreasing aspect ratio.
After the characterization of the vortex shedding from the lateral sides of the models, the flow field in proximity to the free-end and at the upper part of the wake, generated from triangular prisms and circular cylinders, was investigated. Visualizations using tufts and pressure vorticimeter measurements highlighted the presence of a couple of well-defined counter-rotating vortices detaching over the free-end of the prisms positioning the models with their apex edge against the incoming flow, see [5]. This feature was particularly evident for the prism with equilateral triangular cross-section, whilst for the model with isosceles triangular cross-section, even two axial vortices were also singled out, but they were less intense with respect to the previous model. From hot-wire measurements, carried out in proximity to the upper part of the wake, velocity fluctuations were found at a frequency slightly below 1/3 of the lateral vortex shedding frequency, in agreement with the measurements performed on a circular cylinder by [13] and [17]. Moreover, simultaneous measurements carried out at symmetrical locations with respect to the wake symmetry plane showed that these fluctuations correspond to a vertical, in-phase oscillation of the axial vortices detaching from the front edges of the free-end. They also observed that as the axial vortices detach from the free-end they bend downwards by proceeding downstream. Analogous tests were then performed for the wake generated from a circular cylinder by [6], but for this model the axial vortices were smaller, less intense and slightly displaced outwards with respect to the triangular prism configuration. Furthermore, the axial vortices bend inside the wake more rapidly than for the triangular prisms. For this model no low-frequency fluctuations could be detected from the velocity measurements, probably due to a different wake morphology.
In the present work a wide experimental campaign is described which was car-ried out in order to achieve a deeper understanding of the dynamics connected with the vorticity structures present in the wake generated from a prism with aspect-ratio 3, equilateral triangular cross-section and placed vertically with the incoming flow directed against its apex edge. Firstly, an extensive analysis of hot-wire mea-surements, partially performed in [18], was carried out and this data set was then compared with a ”Large Eddy Simulation” (LES) presented in [9]. This survey was fundamental to gain basic clues on the wake vorticity structures and their respective dynamics, and thus to plan the following experimental campaign. Sub-sequently, flow visualizations with laser sheet and injected smoke were performed in order to qualitatively characterize the wake morphology and to investigate on
the oscillations connected with the main vorticity structures. Measurements of the mean and fluctuating pressure field were then performed on the free-end and on the rear surface of the model. Finally, single component hot-wire measurements were performed in the flow field in order to further characterize the fluctuations of the velocity field and to associate them with the vorticity structures present in the wake. Additionally, several modifications on the model shape were realized to influence the dynamics of certain wake vorticity structures and to observe the consequent effects on the associated spectral contributions and on the dynamics of the remaining wake vorticity structures.
Three main spectral contributions were singled out from the experimental mea-surements: the first one is characterized by a St ∼= 0.16 (denoted as the HF in the following), which corresponds to the alternate vortex shedding from the late-ral model edges. In the upper-wake a frequency contribution of St ∼= 0.05 rises (denoted as the LF), which was already attributed by [5] to a vertical, in-phase oscillation of a couple of counter-rotating vortices detaching from the the front edges of the model free-end. The third frequency contribution is characterized by
St ∼= 0.09, denoted as the IF, which seems to be associated with the dynamics of the transversal shear layer detaching from the rear edge of the model free-end and bounding the recirculation region located behind the model.
This chapter is organized as follows. The facility and all the instruments used for the experimental campaign are described in Section 2.2. The analysis of a previous experimental campaign, reported in [18], and of the LES simulation [9] is presented in Section 2.3. We summarize all the flow visualizations in Section 2.4. The pres-sure meapres-surements carried out on the free-end and on the rear surface of the model, and the comparison of the latter with the results of the above-mentioned LES simu-lation are reported in Section 2.5. All the hot wire measurements performed in the wake generated from the original model and from the model with modifications are described in Section 2.6. Finally, conclusions and recommendations are provided in Section 2.7.
2.2 Experimental set-up and procedures
The tests were performed in a closed-return subsonic wind-tunnel, with circular open test section 1.1 m in diameter and 1.48 m in length, and a free-stream tur-bulence level of 0.9%. The general set-up of the experiments is shown in Fig. 2.1.
The model is placed on a horizontal plane, but is connected to a rotatable base located underneath, in order to allow the model orientation relative to the free-stream. The model was a finite prism with equilateral triangular cross-section, and aspect-ratio H/w = 3, where w = 90 mm is the width of the base side of the triangular cross-section and H is the height of the model. The thickness of the turbulent boundary layer on the plane is about δ ∼= 10 mm, so that H/δ ∼= 27, and, according to [20], should not influence the flow field features, which are then
practically only dependent on the parameter H/w. The origin of the used frame of reference was set on the middle point of the base rear edge. The x -axis was chosen in the free-stream direction and the z -axis in the vertical direction, positive from the model base to the tip. The y direction was consequently defined, producing a clockwise frame of reference.
Figure 2.1 Sketch of the experimental set-up: a) model and orientation; b) test lay-out.
The differential pressure transducer SET RA model 239 was used to measure wind-tunnel dynamic pressure, and static temperature was measured trough a Tec-nopound Pt100 probe. All the signals were acquired with a D.A.Q. N I 4472 whilst the traversing apparatus and the selection of the scannivalve ports were driven by a digital N I 6503.
The hot-wire measurements and the flow visualizations were performed at a free-stream velocity of U∞ ∼= 25 m/s, corresponding to a Reynolds number Re = w · U∞/ν ∼= 1.5 × 10⁵, and the pressure measurements with scannivalves were
per-formed at both the above mentioned Reynolds number and Re ∼= 1.2 × 10⁵. Fur-thermore, some tests were performed varying the free-stream velocity in the range 15 ÷ 30 m/s, in order to check the constancy of the Strouhal number corresponding to the spectral components of interest.
The flow visualizations were performed with smoke injected upstream of the model, in order to mark the shear layers detaching from the model, and using a StockerYale laser sheet M agnum 1.1 M ag − 670 − 1000 − 20◦. The lasher sheet is characterized by a wavelength of about 900 nm and output power of 750 mW .
Measurements of the mean and fluctuating pressure field were performed on the free-end and on the rear surface of the model with two pressure scanners
P ressure System ESP 16HD. Each scannivalve is provided with 16 ports and
transducers was performed through a water manometer and fitting the raw data with a linear equation. The taps made on the surfaces were connected to the respective ports with about 400 mm length plastic tubes.
Velocity measurements were then performed with single-component hot-wire anemometry. The probes used were Dantec type 55, connected to an IFA AN 1003 A.A. Lab System test module. A sampling frequency of 2 kHz and a time-length of 33 s were chosen after extensive preliminary tests. The single-wire probes used in the present experimental campaign were oriented with the probe wire both ho-rizontal or vertical, depending on whether the aim of the tests was to investigate the velocity fluctuations acting predominantly in the horizontal or vertical planes, respectively.
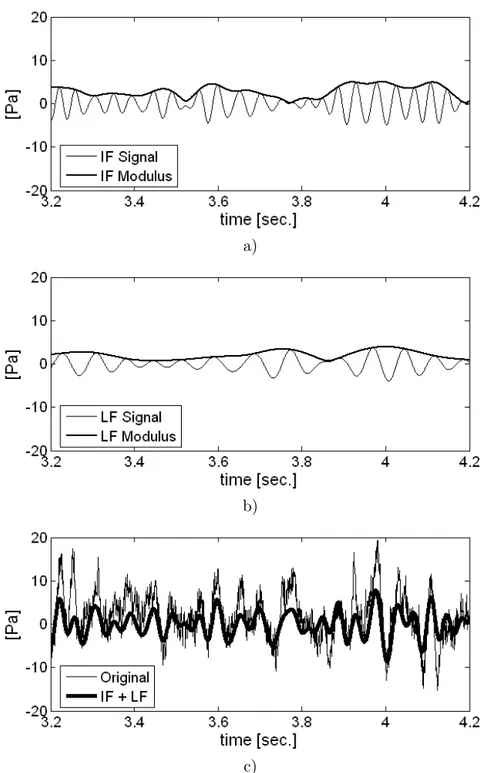
The wake flow is usually characterized by the presence of several dominating spectral components in the velocity fluctuations, but they are generally highly intermittent and with significant modulations, both in amplitude and frequency. Therefore, the analysis of the wake velocity signals using only conventional Fourier spectral methods is largely insufficient, and time-frequency analysis techniques are needed. In the present work the velocity signals were analysed by a procedure based on the wavelet and Hilbert transforms described in [7], and whose main steps will now be summarized.
In order to extract a dominant spectral component from a signal the energy wavelet map of the signal is filtered by neglecting the wavelet coefficients outside a band centred at the frequency of interest. The inverse wavelet transform is then applied to achieve the time-series corresponding to the extracted component. The resulting signal is a narrow-band one whose modulations in amplitude and frequency may then be characterized through a demodulation technique based on the Hilbert transform. With the Hilbert transform it is also possible to survey the time-variation of the phase-shift between two analogous spectral components extracted from simultaneously acquired signals.
2.3 Analysis of a previous experimental campaign and
of a LES simulation
Single component hot-wire measurements were previously performed on the wake flow generated from the same model tested in the present work, and only partially analysed in [18]. The obtained velocity signals were then further analysed in order to obtain clues of the wake generated from the triangular prism and to determine the tests plan of the following experimental campaign.
The Reynolds number selected for the tests was the same as the one used for the present experimental campaign, that is Re = w · U∞/ν ∼= 1.5 × 10⁵ and the tests
were performed placing the probe wire horizontally. The sampling rate was set at 2 kHz and the sampling time at 33 s. Firstly, measurements were carried out in three different cross-planes at downstream locations of x/w = 1.5, 2.5 and 4. For
each cross-plane altitudes of z/H = 0.3, 0.5, 0.7, 0.9 and 1.1 were analysed. Other tests were performed in the wake symmetry plane from the downstream location
x/w = 0.5 up to x/w = 4, with spacing of ∆x/w = 0.5. The selected altitudes
were z/H = 0.1, 0.3, 0.5, 0.7, 0.8 and 0.9.
As already pointed out, these hot-wire measurements were performed with the probe wire set in the y-direction and with the probe stem aligned with the free-stream; thus the measurements are mainly representative of the U and W velocity components and mainly affected by fluctuations acting on the y-direction. A proper velocity measurement is performed only if the flow is U -component predominant, i.e. the solid angle between the velocity vector and the probe stem direction is lower than about 45◦. Inside the wake this condition is generally not fulfilled
because velocity vectors may be characterized by a dominant cross-component, particularly at the lower tested altitudes. Moreover, inappropriate measurements were performed in the recirculation region that lies in proximity to the rear surface of the model, where the U velocity component may be directed upstream. However, even though hot-wire measurements performed in the wake are generally not a proper evaluation of the velocity field, important flow features may be gained from their survey, particularly regarding flow fluctuations.
The analysis of the mean values of the velocity signals allows the wake mor-phology to be characterized (Fig. 2.2). An abrupt reduction of the velocity is generally observed in correspondence to the wake boundary. Starting from the measurements carried out at x/w = 1.5, it is evident that the wake lies beneath the altitude z/H = 1.1 and the cross-width of the wake slightly increases by moving downwards. In the wake symmetry plane a local maximum is generally observed which increases with increasing altitude. This feature could be representative of the incoming flow from the upper part of the wake.
For the following tested cross-sections, x/w = 2.5 and x/w = 4, a continuous enlargement and lowering of the wake is also observed by proceeding downstream. Indeed, for lower altitudes the points corresponding to an abrupt reduction of the mean velocity are displaced at larger values of |y/w| by proceeding downstream while the points corresponding to z/H = 0.9 and y/w = 0 practically lie outside of the wake.
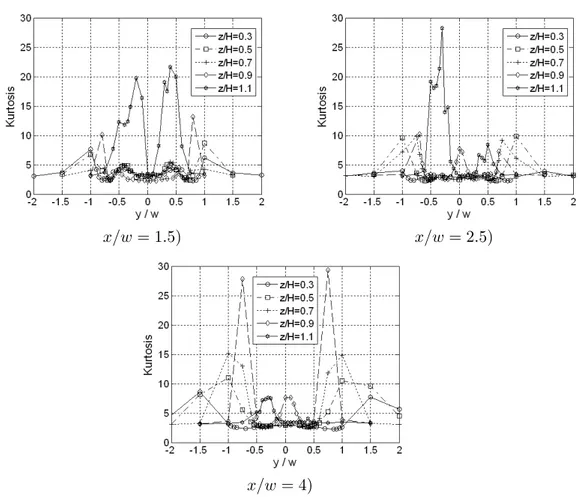
The standard deviation values of the velocity measurements, and their skewness and kurtosis (i.e. the third and fourth order central statistical moments, respec-tively, non-dimensionalized through the standard deviation) were then evaluated in order to achieve a deeper understanding of the wake shape and to investigate on the velocity fluctuations. Firstly, Fig. 2.3 and Fig. 2.4 show that the lateral wake boundary roughly corresponds to a peak of the kurtosis and just inside the wake a peak standard deviation is present. Furthermore, for each altitude the boundary of the wake is characterized by an increased negative value of the skewness in pro-ximity to its location (Fig. 2.5). This feature is due to the abrupt reduction of velocity for the locations just inside the wake. It is evident that all the statistics confirm an enlargement and lowering of the wake by proceeding downstream and
x/w = 1.5) x/w = 2.5)
x/w = 4)
Figure 2.2 Mean values of the hot-wire measurements performed at various cross-planes.
with reducing altitude.
Particularly interesting is the analysis of the standard deviation corresponding to the traverse performed at x/w = 1.5 and z/H = 0.9 (Fig. 2.3). This plot indicates an increased fluctuation of the flow field mainly at the wake symmetry plane, whereas this feature completely disappears for the remaining cross-sections located downstream. This feature is probably due to the oscillations of the vorticity structures detaching from the free-end of the model and acting on the upper part of the wake.
The statistics of the hot-wire measurements carried out in the wake symmetry plane, y/w = 0, are reported in Fig. 2.6. The statistics of the traverses performed at
z/H = 0.9 and z/H = 0.8 are qualitatively different with respects to the remaining
x/w = 1.5) x/w = 2.5)
x/w = 4)
Figure 2.3 Non-dimensional standard deviation of the hot-wire measurements per-formed at various cross-planes.
at the locations x/w = 1 and x/w = 1.5, respectively, which generally indicate the crossing of a shear layer. Just downstream of these locations peaks of standard deviation are present, which are the measurement points with the higher fluctuation related to the this shear layer. Therefore, it seems that the traverses performed at z/H = 0.9 and z/H = 0.8 cross the wake boundary at the locations, x/w = 1 and x/w = 1.5, respectively, whereas the remaining traverses lie completely inside the wake. The wake boundary might be shifted downstream by reducing the altitude from z/H = 0.9 to z/H = 0.8, confirming that the wake becomes lower by proceeding downstream. Moreover, the shear layer delimiting the wake seems to oscillate, as the higher flow unsteadiness is singled out just downstream of its location.
per-x/w = 1.5) x/w = 2.5)
x/w = 4)
Figure 2.4 Kurtosis values of the hot-wire measurements performed at various cross-planes.
formed both with Fourier and wavelet transforms. The frequencies appearing in the velocity fluctuations are described in terms of their associated Strouhal num-ber St = f · w/U∞, where f is the fluctuations frequency, w is the width of the
triangular base and U∞ is the free-stream velocity.
The velocity signals acquired aside the wake are predominantly characterized by the presence of a spectral peak about St ∼= 0.15, which will be referred to HF in the following. This spectral component, already deeply investigated in [6], was at-tributed to an alternate vortex shedding from the lateral vertical edges of the prism through the analysis of the correlation between signals simultaneously acquired on the two sides of the wake. The HF component is particular evident in proximity to the lateral wake boundary and its energy decreases moving horizontally the probe away from the wake. Furthermore, the HF peak decreases in intensity by moving
x/w = 1.5) x/w = 2.5)
x/w = 4)
Figure 2.5 Skewness of the hot-wire measurements performed at various cross-planes.
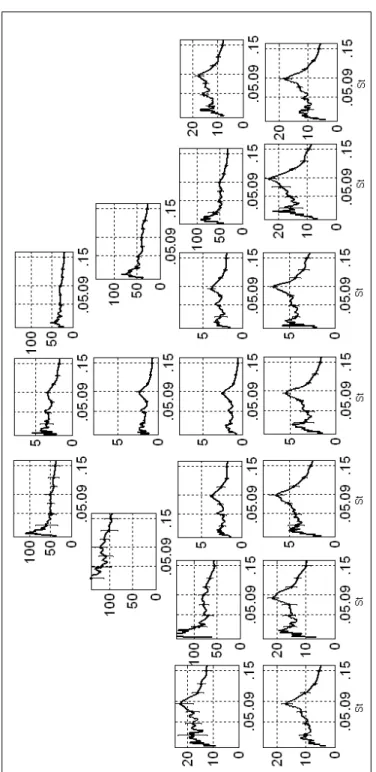
up in the vertical direction. An example of wavelet spectrum obtained at a point in which this peak dominates is shown in Fig. 2.7-a.
A lower frequency was also detected at St ∼= 0.05 (LF in the following) in the upper part of the wake, and becomes the dominating component for all the mea-surements carried out at z/H = 1.1, and particularly for x/w = 2.5 and x/w = 4 (Fig. 2.7-b). In [5] this spectral component was associated with a vertical, in-phase oscillation of the two counter-rotating axial vortices detaching from the front edges of the free-end. A further information regarding the axial vortices can be gained from the analysis of the skewness and kurtosis of the measurements performed at
z/H = 1.1 (Fig. 2.5 and Fig. 2.4). Peaks of these parameters approximately
in-dicate the transversal position of the axial vortices for the different downstream locations.
a) b)
c) d)
Figure 2.6 Statistics of the hot-wire measurements performed at the wake sym-metry plane y/w = 0: a) dimensional mean values; b) non-dimensional standard deviation; c) skewness; d) kurtosis.
Moreover, in various locations of the wake symmetry plane another intermediate spectral peak was singled out at St ∼= 0.09 (IF in the following). An example of this velocity spectrum is reported in Fig. 2.7-c. Starting from the rear model surface, the IF contribution suddenly appears at a certain downstream location, depending on the considered altitude. The origin of this peculiar fluctuation was practically unknown and it became the main goal of the present investigation.
The three above-mentioned spectral components were also found together in the velocity spectra of signals acquired aside the wake, but sufficiently far from its boundary (Fig. 2.7-d). Indeed, in such positions the fluctuations due to the vortex shedding are reduced in such a way that the peaks at the remaining frequencies become detectable. This suggests that, even if the three contributions may be
a) b)
c) d)
Figure 2.7 Examples of the wavelet spectra obtained from the hot wire measure-ments carried out in various regions around the wake: a) x/w = 2.5,
y/w = 1.0, z/H = 0.5; b) x/w = 4.0, y/w = 0.5, z/H = 1.1; c) x/w = 2.5, y/w = 0, z/H = 0.5; d) x/w = 2.5, y/w = 2.5, z/H = 0.3.
originated by different phenomena, and thus are more evident close to the regions where the phenomena occur, they all contribute to the global oscillation of the wake.
In order to better associate the lower and specially the intermediate spectral components with the dynamics of the wake vorticity structures, the numerical results of [9] were also analysed. In that work a ”Large-eddy simulation” (LES) of the same model tested experimentally was performed, even if at a Reynolds number one order of magnitude smaller than in the experiments (Re = w·U∞/ν ∼= 104). The
LES simulation provided 116 snapshots of the flow which correspond to 17 cycles of alternate vortex shedding. The hot-wire measurements, previously analysed, were compared to the LES data generating from the latter a “simulated” hot-wire output combining the velocity components as follows. Considering that the hot-wire probe
a) b)
c) d)
Figure 2.8 Comparison between the non-dimensional standard deviation obtained from the hot-wire measurements and the simulated hot wire output evaluated from the LES data: a) and b) measurements carried out at the wake symmetry plane y/w = 0; c) measurements carried out at the cross-plane x/w = 1.5; d) measurements carried out at the cross-plane
x/w = 2.5.
was set horizontally during the tests, each hot-wire measurement is an estimation of the so-called effective cooling velocity, defined with sufficient accuracy from this formula:
Q =pU2+ h2W2+ k2V2 (2.1)
where h ∼= 1.04 and k ∼= 0.2. A good agreement was generally found between the statistics of the experimental measurements and the numerical “simulated” hot-wire outputs, as can be appreciated from the standard deviation of several traverses reported in Fig. 2.8. This good agreement, perhaps even beyond expectations, considering the different Reynolds number, is probably due to a fixed detachment of the shear layers from the edges of the model; consequently, just a delayed onset of turbulent fluctuations was found due to the lower Reynolds number of the LES.
Analysing the LES data, qualitative information about the dynamics present in the wake may be gained, particularly from the visualizations of the vorticity field. Firstly, the visualization of the axial vorticity in the upper part of the wake imme-diately behind the rear surface shows the two counter-rotating vortices detaching from the front edges of the free-end (Fig. 2.9); moreover, their position and inten-sity are in good agreement with the experimental data obtained through a pressure vorticimeter and reported in [5].
Figure 2.9 Cross-sections of axial vorticity above the free-end at x/w = 0.01. Up-per: experimental vorticimeter measurements; lower: LES.
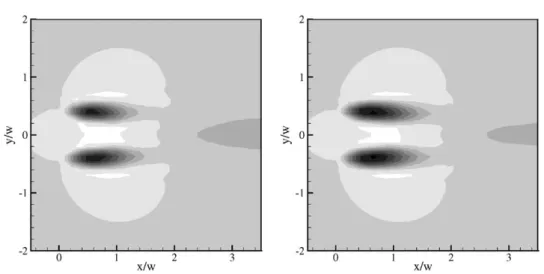
Furthermore, Fig. 2.10 shows two horizontal sections of the U velocity component at z/H = 1.07 corresponding to different snapshots of the simulation. In both the two maps the traces of the axial vortices are symmetrical but with different size, which suggests that these maps might be two horizontal sections of the vortices at different vertical distance from the vortices axes. Therefore, this visualization may be representative of a vertical, in-phase oscillation of the two vortices, as already pointed out from the experimental measurements. Even though the above mentioned oscillation is compatible with the LF component ascertained from the experimental measurements, the time-length of the LES is not sufficient for an adequate spectral analysis.
Furthermore, the visualizations of the vorticity y-component highlight the pre-sence of a transversal shear layer detaching from the rear edge of the model free-end (Fig. 2.11-b). At variance with the axial vortices (Fig. 2.11-a), this shear layer bends rapidly downwards, probably due to the velocity field induced from the axial vor-tices. The modulus of the vorticity cross-component is also reported in Fig. 2.11-c for the plane at x/w = 0.8. As can be seen, the vertical vorticity detaching from the vertical edges of the model is dragged by the velocity field, generated from the two axial vortices, around the two vortices themselves and pushed in the upper part of the wake towards the symmetry plane. Consequently, the vertical shear layers, coming from the two sides of the wake, wrap around the two axial vortices and in correspondence of the symmetry plane generate a vertical “action” on the upper part of the wake, which may thus be lowered and enlarged. Most
proba-Figure 2.10 Cross-section of the U velocity component at z/H = 1.07 at two snapshots corresponding to the extremes of a LF cycle.
bly, this dynamics, which involves the whole vorticity structures present in the upper-wake, might generate the IF oscillation experimentally ascertained mainly in correspondence to the symmetry plane.
Concluding, the synergic analysis of previous hot-wire measurements and of the LES data presented in [9] highlights the presence of a spectral component (HF) at
St ∼= 0.15 corresponding to an alternate vortex shedding from the vertical edges of the model and of a LF at St ∼= 0.05 generated from a vertical, in-phase oscillation of the two axial vortices detaching from the front edges of the model free-end. Furthermore, an intermediate IF component was ascertained from the experimental measurements to be present mainly on the wake symmetry plane and for altitudes from z/H = 0.3 up to z/H = 0.6. From the numerical visualizations of the vorticity field it seems that the IF may be generated from the interaction of the transversal shear layer detaching form the rear edge of the free-end and the other vorticity structures present in the upper part of the wake.
From this survey the measurement locations used in the previous experimental campaign are generally confirmed to be adequate for the characterization of the above-mentioned dynamics present in the wake, except for the necessity of per-forming more measurements at z/H = 1, which seems to be the altitude more effected by the vorticity structures present in the upper part of the wake. Further-more, more detailed measurements in the wake symmetry plane seem necessary, with the probe wire set both horizontally and vertically, in order to investigate on the characterization of the recirculation region lying downstream of the rear surface and on the IF probably connected with it.
a) b)
c)
Figure 2.11 Numerical visualization of the upper-wake vorticity field from [9]: a)
x -component; b) y-component; c) modulus of the vorticity component
lying on the y-z plane at x/w = 0.8.
2.4 Flow visualizations
Preliminary flow visualizations were carried out in order to investigate on the overall shape of the wake and on the possible dynamics connected to the wake vorticity structures. All the still photos and videos may be accessed through the World Wide Web at
http : //dottorato.dia.ing.unipi.it/Dottorandi/schedaDott.asp?id = 10. These
tests were performed with a laser sheet and with smoke injected upstream of the model in order to visualize the detached shear layers. All the flow visualizations were performed at Re ∼= 1.5 × 10⁵.
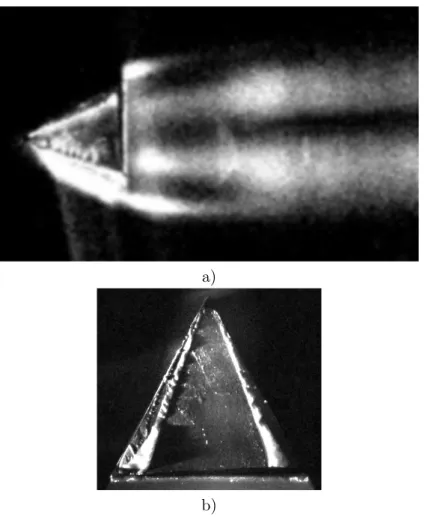
0.3 and z/H = 0.5, in order to investigate on the wake width, and at z/H = 0.9 and z/H = 1 to better individuate the transversal locations of the axial vortices detaching from the free-end. A photo regarding the horizontal cross-section of the wake at z/H = 0.3 is reported in Fig. 2.12. From these visualizations it was difficult to clearly ascertain the alternate vortex shedding, but the width of the wake varying downstream location and the formation length of the vortices, about 3w, could be discerned.
Figure 2.12 Flow visualization performed with the laser sheet lying on the hori-zontal plane at z/H = 0.3.
The cores of the two axial vortices, detaching from the free-end, are localized roughly at y/w ∼= ±0.3, as can be observed from Fig. 2.13-a, in good agreement with both the previous experimental findings of [5] and the LES simulation of [9]. Furthermore, this photo shows that in correspondence to the symmetry plane the wake is located at lower altitudes than the location of the laser sheet. This feature may correspond to the transversal shear layer detaching from the rear edge of the free-end, which bends downwards due to the velocity field induced from the two axial vortices. This wake characteristic was already observed through the LES data in Fig. 2.11-b. In Fig. 2.13-b, a photo also performed at z/H = 1, just on the model free-end, highlights the presence of symmetrical vorticity structures lying on the tip surface and deriving from a secondary separation over the tip surface. Indeed, from the videos these two vorticity structures seem to be counter-rotating and each one seems of opposite sign with respect to main axial vortex detaching from the front edge of the model free-end. Those secondary vorticity structures could not be detected from the following hot-wire measurements, probably due to the rapid merging process between these secondary vorticity structures and the main couple of axial vortices detaching from the free-end, which seem to be definitely more intense. A possible mechanism originating these secondary vorticity structures is
a)
b)
Figure 2.13 Flow visualizations performed with the laser sheet lying on the hori-zontal plane at z/H = 1.
sketched in Fig. 2.14: the shear layer detaching from each front edge of the free-end rapidly rolls-up on the tip surface of the model. The velocity field induced by the growing axial vortex produces a detachment of the boundary layer present on the model tip, generating a secondary vorticity structure counter-rotating with the main vortex.
The second series of tests was performed by setting the laser sheet in verti-cal planes orthogonal to the free-stream direction. The selected locations were
x/w = 0, 0.25, 0.5, 1 and 1.5. Several photos regarding these tests are reported in
Fig. 2.15. The overall shape and size of the wake cross-sections evaluated through the numerical visualizations of the vorticity modulus lying in cross-planes are gene-rally confirmed by the flow visualizations. Firstly, the wake widens with reducing
Figure 2.14 Sketch of the generation of secondary vorticity structures counter-rotating with respect to the main couple of axial vortices detaching from the free-end.
altitude and becomes lower by proceeding downstream. Furthermore, from the videos it seems that this phenomenon may be generated mainly by the vorticity structures present in the upper part of the wake and that, as already pointed out in Section 2.3, the axial vortices are fed by the shear layers coming from the vertical sides of the wake.
Other flow visualizations were performed with the laser sheet set in longitudinal planes. Firstly, the tests carried out in correspondence to the symmetry plane,
y/w = 0, confirm that the transversal shear layer detaching from the rear edge of
the free-end rapidly bends downwards inside the wake (Fig. 2.16). Furthermore, it seems that this shear layer is curved in such a way to impinge on the rear model surface at very low altitudes. This mechanism may be the origin of the recirculation region ascertained by [9] in proximity to the rear model surface. Indeed, from the LES data the mean U velocity component was found to be in the up-stream direction in this region. Conversely, the axial vortices, visualized by setting the laser sheet in the longitudinal planes at y/w = ±0.3, remain significantly higher with respect to the central part of the wake (Fig. 2.16).
In conclusion, the present flow visualizations allowed to confirm features regard-ing the wake shape and the main vorticity structures present in the wake; however, they are not adequate to perform a detailed survey of the oscillations of the wake.
2.5 Pressure measurements on the model surfaces
In the present experimental campaign dynamic measurements of the pressure field acting on the free-end and on the rear surface of the model were carried out. A deep survey of the pressure field obtained from the LES data presented in [9] was
x/w = 0) x/w = 0.25)
x/w = 0.5) x/w = 1.5)
Figure 2.15 Flow visualizations performed at several vertical planes perpendicular to the free-stream direction.
y/w = 0) y/w = 0.3)
first carried out in order to perform a preliminary analysis of the pressure field acting on these surfaces and to properly select the locations where positioning the taps for the following experimental measurements.
2.5.1 Pressure field on the tip and rear surfaces of the model evaluated from a LES simulation
As already pointed out, even though the LES was made at Re = w·U∞/ν ∼= 104, i.e.
one order of magnitude smaller than the one used for the experimental campaign, a good agreement between numerical and experimental data was found due to the fixed detachment of the shear layers from the edges of the model. The LES simulation provided 116 snapshots which correspond to 17 cycles of alternate vortex shedding. Consequently, this numerical simulation seems to be adequate for a spectral characterization of the vortex shedding (HF) but not of the two remaining spectral components, viz. IF and LF, acting at lower frequencies.
The presence of the two axial vortices detaching from the front edges of the model free-end is ascertained from the mean pressure field acting on that surface. In Fig. 2.17-a a strong pressure suction, i.e. a non-dimensional pressure coefficient
cp= (P − P∞)/(0.5ρ∞U∞2) ∼= −1.4, is observed in proximity to the locations where
the vortices cores lie. Furthermore, the map of the mean values of the transversal velocity component V , in Fig. 2.17-b, confirms that the two axial vortices are counter-rotating ones.
a) b)
Figure 2.17 Mean flow field acting on the model free-end evaluated from the LES simulation: a) mean pressure field in terms of non-dimensional coef-ficients cp; b) mean non-dimensional transversal velocity component
V .
model surfaces were performed. To achieve a better understanding of the flow fluctuations the data were filtered centering an ideal band-pass filter at a frequency corresponding to one of the three spectral components of interest. The amplitude of each filter was set about 14% of the central frequency.
Considering the free-end of the model, it was found that pressure fluctuations act predominantly in a spectral range around the LF component, whereas the fluctuations corresponding to the IF and HF are definitely negligible. The pressure fluctuations band-pass filtered around the LF component highlight that the two axial vortices generally oscillate symmetrically in correspondence to the free-end, as shown in Fig. 2.18-a and -b, except for a few snapshots where antisymmetric oscillations occur (Fig. 2.18-c and -d).
a) b)
c) d)
Figure 2.18 Pressure field fluctuations band-pass filtered around the LF compo-nent acting on the free-end. The pressure values are expressed in terms of cp: a) usual symmetrical fluctuations of the axial vortices; b)
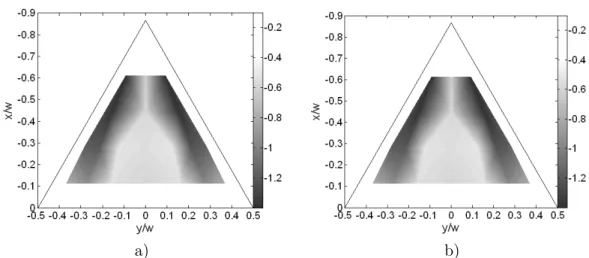
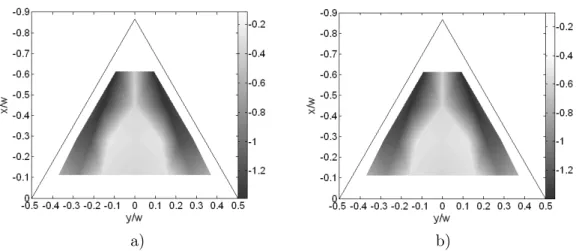
The pressure and velocity fields acting on the rear surface of the model, evaluated from the LES data, are now considered. The mean pressure field in Fig. 2.19-a shows that an increased suction is present between the altitudes z/H = 0.5 and
z/H = 0.7, while the vertical velocity component W is generally directs upwards,
but in proximity to the model tip its direction is reversed (Fig. 2.19-b). This feature is most probably due to the velocity field induced from the vorticity structures detaching from the free-end.
a) b)
Figure 2.19 Mean flow field acting on the rear surface evaluated from the LES simulation: a) mean pressure field evaluated in terms of cp; b) mean field of the vertical velocity component W .
Particulary interesting is the simultaneous analysis of the fluctuations of pressure and vertical velocity W fields band-pass filtered around the IF component acting on the rear surface of the model. The fluctuations are evaluated with respect to the mean value at each point. In Fig. 2.20 fluctuating pressure and vertical velo-city maps, corresponding to the same snapshot, are reported for several time-steps. Starting from the first snapshot, t = 23.868, a local increase of the instantaneous pressure is observed at an altitude about z/H ∼= 0.2. As can be observed from the map of the vertical velocity, corresponding to the same snapshot, W is direct upwards for locations slightly above the considered altitude, whereas W is direct
downwards for lower altitudes. This analysis suggests that a shear layer may come closer to the rear model surface at the altitude z/H ∼= 0.2. In the following snap-shots the local increase of the pressure acting on the rear surface slightly moves up and its intensity decreases with increasing altitude. At z/H ∼= 0.7 (t = 31.122) this feature is practically disappeared while a new cycle of this phenomenon is starting again at z/H ∼= 0.2. Summarizing, this analysis suggests that a shear layer perio-dically seems to come closer to the rear model surface at z/H ∼= 0.2; consecutively, it moves up and then withdraws. When the local peak pressure is completely di-sappeared at z/H ∼= 0.7, a new cycle is starting again at z/H ∼= 0.2. The period of this phenomenon corresponds to a frequency comparable with the IF.
Figure 2.20 Several snapshots of the LES simulation regarding the fluctuating flow field acting on the rear surface band-pass filtered around the IF: upper) instantaneous fluctuations of the pressure field evaluated in terms of
cp; lower) instantaneous fluctuations of the vertical velocity field.
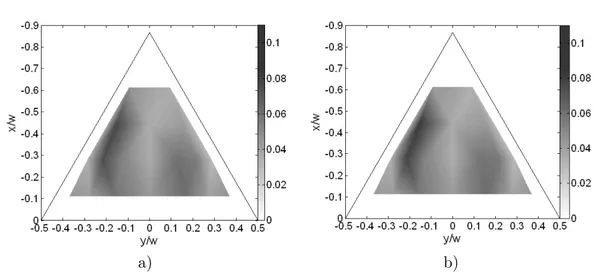
Moreover, the fluctuations of the vertical velocity field acting on the rear surface were analysed by filtering the data with a band-pass filter centred with the LF. Figure 2.21 highlights that these low-frequency fluctuations act mainly in the upper part of the rear surface and are symmetric. This may confirm the vertical, in-phase oscillation of the couple of axial vortices detaching from the free-end.
t = 83.3898) t = 89.7727) t = 101.047)
Figure 2.21 Fluctuations of the vertical velocity W band-pass filtered around the LF component, evaluated from the LES data, acting on the rear sur-face.
2.5.2 Experimental measurements of the pressure field acting on the free-end and on the rear surface of the model
Dynamic measurements of the pressure field acting on the free-end and on the rear surface of the model were performed using two scannivalves described in Section 2.2. The taps locations were chosen on the basis of the previous analysis of the LES data presented in Section 2.5.1 and on the flow visualizations described in Section 2.4. The tests were performed at two Reynolds number: Re = w · U∞/ν ∼= 1.2 × 10⁵ and Re ∼= 1.5 × 10⁵. Two different procedures were used: with the first one, denoted as Mapping Mode, one sample is acquired from each port and the scannivalves are multiplexed at the highest available frequency. Theoretically this procedure allows to achieve almost simultaneous measurements from all the tested taps, and for this application the mean sampling rate of the pressure maps results to be about 1 Hz. With the other procedure, denoted as Sequence Mode, 216 samples are acquired
from each port with a sampling rate of 2 kHz. This procedure was necessary for an adequate spectral characterization of the pressure signals. At least three runs were carried out for each procedure and for each tested model surface.
Experimental pressure measurements on the model free-end
The locations of the taps made on the model free-end are represented in Fig. 2.22 and reported in Tab. 2.1, where the suffix a or b correspond to the scannivalve to which each port is connected.
Figure 2.22 Sketch of the locations of the pressure taps made on the model free-end.
The two above-mentioned measurement procedures produced the same mean pressure field as shown in Fig. 2.23. The pressure maps obtained through the
Mapping mode, which are representative of the instantaneous pressure field acting
on the model free-end, generally show symmetrical pressure fluctuations, but it is difficult to perform a proper spectral characterization due to the large temporal distance between following snapshots (i.e. about 1 s).
The mean pressure fields obtained with the Sequence Mode, at the two tested Reynolds Numbers, Re ∼= 1.2 × 10⁵ and Re ∼= 1.5 × 10⁵, are reported in Fig. 2.24-a 2.24-and Fig. 2.24-b, respectively. These m2.24-aps, plotted with the s2.24-ame color sc2.24-ale, confirm the presence of the couple of axial vortices in proximity to the free-end, and that their strength increases by increasing the free-stream velocity. When the pressure fields are reported in terms of pressure coefficients the two maps become practically equal, as shown in Fig. 2.25. This confirms that the mean pressure field, and particularly the axial vortices strength, is almost linearly dependent on the free-stream dynamic pressure.
The mean pressure field in terms of non-dimensional coefficients cp is also re-ported in Fig. 2.26. It is evident that the suction due to the axial vortices is more intense for the locations situated more upstream (i.e. cp∼= −1.6), then it gradually
decreases by proceeding downstream. This suggests that during the formation pro-cess the axial vortices increase their strength and progressively they detach from the free-end.
a) b)
Figure 2.23 Mean pressure field in terms of non-dimensional coefficient cp
mea-sured at Re = 1.5 × 10⁵ with two different measurement procedures:
a) Mapping Mode; b) Sequence Mode.
a) b)
Figure 2.24 Mean pressure field measured at different free-stream velocities: a)Re = 1.2 × 10⁵; b) Re = 1.5 × 10⁵. Pressure values are reported in
a) b)
Figure 2.25 Mean pressure field in terms of non-dimensional coefficient cp
mea-sured at different free-stream velocities: a)Re = 1.2 × 10⁵; b) Re =
1.5 × 10⁵.
Figure 2.26 Mean pressure field acting on the model free-end in terms of cp, Re = 1.5 × 10⁵.
![Figure 2.11 Numerical visualization of the upper-wake vorticity field from [9]: a)](https://thumb-eu.123doks.com/thumbv2/123dokorg/7284825.85088/29.892.259.706.194.683/figure-numerical-visualization-upper-wake-vorticity-field.webp)