D Rigamonti et al
Activation of ITER materials in JET: nuclear characterisation experiments for the long-term irradiation station L.W. Packer et al
-14 MeV calibration of JET neutron detectors—phase 2: in-vessel calibration P. Batistoni et al
-Nuclear Fusion
14 MeV calibration of JET neutron
detectors
—phase 1: calibration and
characterization of the neutron source
P. Batistoni1, S. Popovichev2, A. Cufar3, Z. Ghani2, L. Giacomelli4,S. Jednorog5, A. Klix6, S. Lilley2, E. Laszynska5, S. Loreti1, L. Packer2, A. Peacock7, M. Pillon1, R. Price2, M. Rebai8, D. Rigamonti8, N. Roberts9, M. Tardocchi4, D. Thomas9 and JET Contributorsa
EUROfusion Consortium, Culham Science Centre, Abingdon, Oxon, OX14 3DB, United Kingdom
1 ENEA, Department of Fusion and Nuclear Safety Technology, I-00044 Frascati (Rome), Italy 2 CCFE, Culham Science Centre, Abingdon, Oxon, OX14 3DB, United Kingdom
3 Reactor Physics Division, Jožef Stefan Institute, Jamova cesta 39, SI-1000 Ljubljana, Slovenia 4 Istituto di Fisica del Plasma ‘P. Caldirola’, CNR, Milano, Italy
5 Institute of Plasma Physics and Laser Microfusion, Hery 23, 01-497 Warsaw, Poland 6 Karlsruhe Institute of Technology, D-76344 Eggenstein-Leopoldshafen, Karlsruhe, Germany 7 JET Exploitation Unit, Abingdon, Oxon, OX14 3DB, United Kingdom
8 Dipartimento di Fisica ‘G. Occhialini’, Università degli Studi di Milano-Bicocca, Milano, Italy 9 National Physical Laboratory, Hampton Road, Teddington, TW11 0LW, Middlesex, United Kingdom
E-mail: [email protected]
Received 1 September 2017, revised 27 October 2017 Accepted for publication 8 November 2017
Published 21 December 2017
Abstract
In view of the planned DT operations at JET, a calibration of the JET neutron monitors at 14 MeV neutron energy is needed using a 14 MeV neutron generator deployed inside the vacuum vessel by the JET remote handling system. The target accuracy of this calibration is ±10% as also required by ITER, where a precise neutron yield measurement is important, e.g. for tritium accountancy. To achieve this accuracy, the 14 MeV neutron generator selected as the calibration source has been fully characterised and calibrated prior to the in-vessel calibration of the JET monitors. This paper describes the measurements performed using different types of neutron detectors, spectrometers, calibrated long counters and activation foils which allowed us to obtain the neutron emission rate and the anisotropy of the neutron generator, i.e. the neutron flux and energy spectrum dependence on emission angle, and to derive the absolute emission rate in 4π sr. The use of high resolution diamond spectrometers
made it possible to resolve the complex features of the neutron energy spectra resulting from the mixed D/T beam ions reacting with the D/T nuclei present in the neutron generator target. As the neutron generator is not a stable neutron source, several monitoring detectors were attached to it by means of an ad hoc mechanical structure to continuously monitor the neutron emission rate during the in-vessel calibration. These monitoring detectors, two diamond diodes and activation foils, have been calibrated in terms of neutrons/counts within ±5% total uncertainty. A neutron source routine has been developed, able to produce the neutron spectra resulting from all possible reactions occurring with the D/T ions in the beam impinging on the Ti D/T target. The neutron energy spectra calculated by combining the source routine with a MCNP model of the neutron generator have been validated by the measurements. These numerical tools will be key in analysing the results from the in-vessel calibration and to derive the response of the JET neutron detectors to DT plasma neutrons starting from the response to the generator neutrons, and taking into account all the calibration circumstances.
P. Batistoni et al Printed in the UK 026012 NUFUAU © 2017 EURATOM 58 Nucl. Fusion NF 10.1088/1741-4326/aa98f6
Paper
2 Nuclear Fusion IOPInternational Atomic Energy Agency
a See the author list of [31]. 2018
1741-4326
https://doi.org/10.1088/1741-4326/aa98f6 Nucl. Fusion 58 (2018) 026012 (24pp)
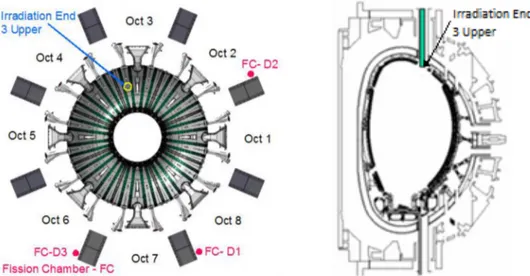
(figure 1) [1]: (a) 235U/238U fission chambers (KN1) mounted in moderator packages at mid-plane locations close to the transformer magnet limbs in Octants 2, 6 and 8, and (b) the in-vessel activation system (KN2) which pneumatically delivers and retrieves capsules containing activation foils to/from ‘Irradiation Ends’ located inside the torus structure, e.g. to the edge of the vacuum vessel. Capsules are delivered before and retrieved after the pulse for counting of the induced gamma radioactivity in the foils.
Both KN1 and KN2 need to be accurately calibrated to pro-vide an absolute measurement of the neutron yield and fusion power. A neutron calibration consists of the deployment of a neutron source of known intensity and energy spectrum at different toroidal/poloidal locations inside the JET vacuum vessel to simulate the volume plasma source, and in recording the resulting signals in the JET neutron detectors located inside (KN2) and outside (KN1) the machine. An accurate calibra-tion, at 2.5 MeV neutron energy, of the JET neutron detectors was performed in 2013 where the four systems, KN2 and the three KN1 fission chambers were independently calibrated for JET D plasma operations [1, 2]. A 252Cf source, which emits neutrons with a mean energy of 2.1 MeV, was placed at about 234 different positions, covering the whole JET in-vessel space. After the calibration, the neutron yields from D plasmas measured by the four systems agree within ±3%, i.e. within the combined uncertainty of the different systems of ~10% [2].
In view of the new DT campaign planned in 2019 [3], a new calibration at 14 MeV neutron energy is needed to allow accurate measurements of the fusion power and of plasma ion parameters. The target accuracy is ±10% to maximise the exploitation of DT operations within the total allowed JET neutron budget. Moreover, the JET 14 MeV neutron calibra-tion has also the objective to benchmark the ITER neutron calibration, where 10% accuracy is required for tritium accountancy [4]. Neutron calibrations at 14 MeV energy are much more challenging than at 2.5 MeV as there are no nat-urally occurring neutron sources at the relevant energy that could be conveniently employed, and neutron generators have to be used. 14 MeV neutron calibrations have been previously attempted in JET [5] and performed in TFTR [6], overall accu-racies of ±10.4% and ±13% were estimated, respectively.
requirements, design constraints, personnel safety require-ments, RH compatibility, resistance to failure); (2) calibration and characterization of the 14 MeV neutron generator at a neutron metrology laboratory, and analyses and calibration of ‘monitoring detectors’; (3) in-vessel calibration with the neu-tron generator deployed by the RH system and analyses. The final validation of the calibration and of the related accuracy will be obtained with measurements of neutron yields during DT operations, when the results obtained by the different cali-brated detectors will be compared.
The constraints and early decisions which defined the main calibration approach, e.g. the RH compatibility and the lim-ited space available, the technical requirements of the 14 MeV neutron generator and the deployment method, the safety and engineering aspects have been discussed in a separate paper [7]. The present paper describes the outcome of the accu-rate calibration and characterization of the 14 MeV neutron generator selected as the calibration source. In particular, it describes the measurements performed at the Neutron Metrology Laboratory of the National Physical Laboratory (NPL, Teddington, London) using different types of neutron detectors, spectrometers, calibrated long counters and activa-tion foils which allowed us to measure the neutron emission rate and the anisotropy of the neutron generator, i.e. the neu-tron flux and energy spectrum dependence on emission angle, and to derive the absolute emission rate in 4π sr. The use of
high resolution diamond detectors made it possible to resolve for the first time the complex features of the neutron energy spectra resulting from the mixed D/T beam ions reacting with the D/T nuclei present in the target, and to derive information of beam ion composition.
As the neutron generator is not a stable neutron source, several monitoring detectors are attached to it by means of an ad hoc mechanical structure to continuously monitor the neu-tron emission rate and the total neuneu-trons emitted during the in-vessel calibration. These monitoring detectors, single crystal diamonds and activation foils, located in the same positions at NPL as when in the JET vessel, have been calibrated in terms of (neutrons s−1)/(counts s−1).
Since the neutron emission by the neutron generator is anisotropic, and the MASCOT cannot rotate the neutron gen-erator in different directions when inside the JET vessel to
account for its anisotropy, the neutron emission anisotropy has to be measured.
Finally, a neutron source routine has been developed, able to produce the neutron spectra resulting from all possible reactions occurring with the D/T (mono-atomic, bi-atomic etc) ions in the beam impinging on the TiD/T target. The neutron source routine is used in combination with a very detailed MCNP model of the neutron generator which has been valid ated by the measurements. These numerical tools will be key in analysing the results from the in-vessel cali-bration to derive the response of the JET neutron detectors to plasma neutrons starting from the response to the gen-erator neutrons, and taking into account all the calibration circumstances.
2. The selected 14 MeV neutron generator
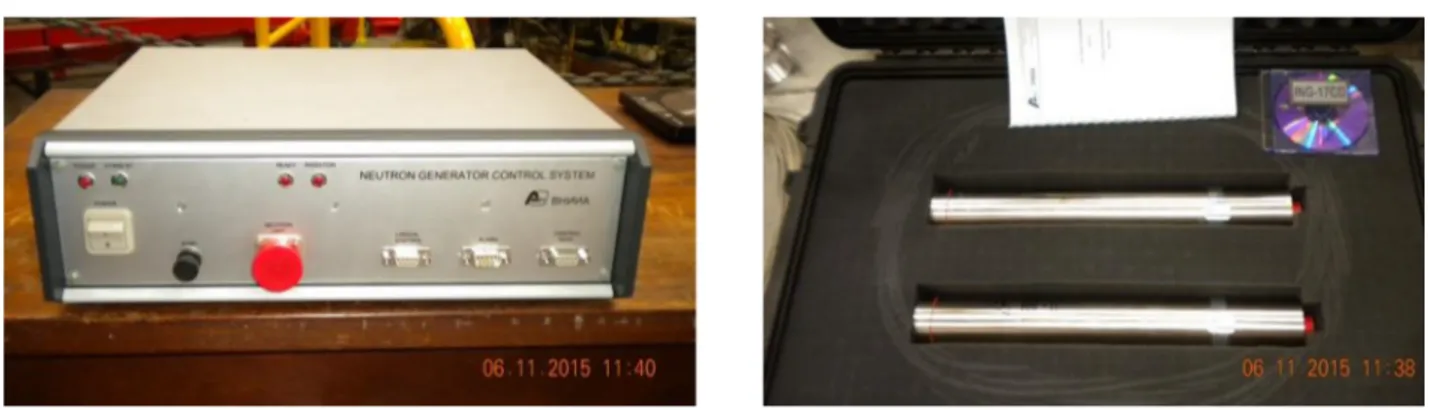
The 14 MeV neutron generator type ING-17 (figure 3) pro-vided by VNIIA [8] was identified as a suitable source com-plying with the JET physical and technical requirements. The system consists of a power supply and control unit (PSCU) and a neutron generator (NG), connected by a power supply
cable. The VHV (very high voltage) unit is enclosed within the NG, together with the sealed tube containing tritium and deuterium. One PSCU and two NGs were purchased because of the need to avoid delays in the JET programme in the case of a NG failure. The main parameters of the ING-17 are given in table 1.
In the NGs, a mixed D+
x/Ty+/DxTy+ beam (x, y = 1,2,3 …), with nominally 50% D and 50% T, is accelerated to a nominal energy of 100 keV onto a titanium target containing T/D (nominally 50%/50%) inside a sealed tube thus producing beam-target fusion reactions.
3. The ‘monitoring’ detectors
The NG intensity can be subject to fluctuations due to varia-tions in the voltage/current, target heating or general aging of the target and other components. Achieving stability of emis-sion down to a few percent level is still very challenging in present neutron generator technology. Therefore, during the in-vessel calibration the neutron emission intensity, or the NG total neutron yield, needs to be monitored by compact detectors mounted in suitable positions close to the NG. When
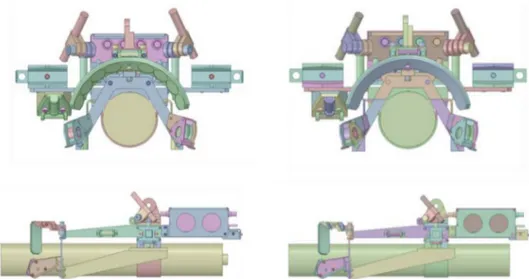
Figure 1. Left: top view of JET machine showing the position of fission chambers (KN1) close to the magnetic limbs, and of the 3-upper irradiation end (KN2). Right: cross section of JET showing the 3-upper irradiation end (KN2).
Figure 2. Left: remote Handling MASCOT inside the JET vacuum vessel. Right: the neutron generator deployed by the MASCOT and the power supply control unit (PSCU) attached to the MASCOT body.
inside the JET vessel, the absolute neutron yield produced by the NG can only be obtained by using the calibrated ‘moni-toring detectors’. Multiple monitoring detectors were chosen, a single crystal diamond detector (SDD) and a Si diode, and a set of activation foils, which are attached to the NG at fixed and well-defined positions by means of an ad hoc mechanical support (figure 4). The Si-diode did not prove to be as stable as required and was later replaced by a second SDD. The mechanical support also provides attachment points to allow for the MASCOT arms to grip the NG, the housing of a pre-amplifier for the active detectors, and two lasers to be used whenever precise positioning of the NG at well-defined loca-tions inside the vessel is required.
Two SDDs have been chosen by ENEA to provide the time resolved neutron yield. They are located at nominally sym-metrical positions with respect to the target (figure 4).
Neutron detection in a SDD is based on the collection of electrons and holes generated in the detector active volume (5.5 eV are needed to produce an e–h pair) by charged parti-cles produced via neutron-induced nuclear reactions on 12C. The main reactions are:
(i) the n-α reaction: 12C(n,α)9Be (Q = −5.70 MeV, threshold energy Ethr = 6.18 MeV);
(ii) the elastic neutron scattering channel: 12C(n,n′)12C′; (iii) the n-3α reaction (Carbon breakup): 12C(n,n′)3α
(Q = −7.27 MeV, Ethr = 7.89 MeV).
The first reaction represents the detection channel for 14 MeV neutrons. It represents also the spectroscopic channel used in the SDD spectrometer as described in section 6.1. In this case, the deposited energy, ideally, equals the incoming neutron energy minus the reaction Q value, i.e. ∼14 MeV– 5.70 MeV = ∼ 8.3 MeV. In the elastic scattering, the energy deposited into the detector, Ed, depends on the recoil angle, i.e.
Ed = En· 0.284 · cos2θ and its maximum value can therefore be about 30% of the incoming neutron energy. The third reac-tion, consisting in the Carbon breakup into 3 alpha particles, gives rise to a continuum up to a shoulder at Ed,max = En − Q.
The SDDs used as monitoring detectors and the data acqui-sition electronics have been supplied by CAEN Company. Both detectors have been realized for CAEN by the Istituto di Struttura della Materia (ISM), Consiglio Nazionale delle Ricerche (CNR), Rome, Italy. ISM-CNR has produced the detectors using ‘electronic grade’ (with Nitrogen concentra-tion [N] < 5 ppb and Boron concentraconcentra-tion [B] < 1 ppb) CVD single crystal diamond plates (4.5 × 4.5 mm2, with thick-ness d = 500 µm), provided by Element Six Ltd [9]. Square
Characteristic Specification Max nominal neutron
emission rate 2 × 10
8 n s−1
Dimensions/weight:
Neutron emitting unit ∅70 mm × 459 mm/2.8 kg Power supply and control
unit 356 mm × 315 mm × 110 mm/4.6 kg Operation mode Continuous
Continuous operation time >20 min Target temperature limit 60 °C Recovery time after switch
off <0.5 h
Power supply 220 VAC, 50 Hz Power consumption <150 W Tritium content <370 GBq Lifetime:
Neutron generator 300 h Power supply and control
unit >5000 h
Figure 4. Neutron Generator with the mechanical structure needed for MASCOT gripping and to support the ‘monitoring detectors’ and pre-amplifier (red box at the back). The two SDDs and the activation foils are symmetrically hosted in the support around the neutron generator, at the same distance from the target centre.
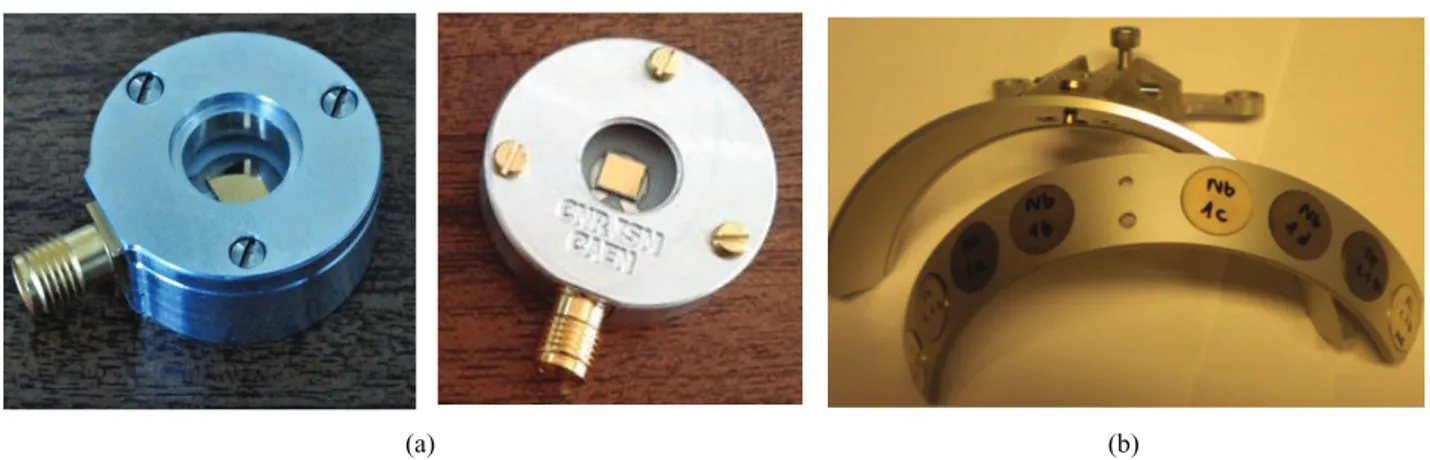
200 nm thick multilayer gold finished contacts, 4.2 × 4.2 mm2, are deposited on both faces of a diamond plate which is then mounted in an anodized aluminium casing using an alumina plate holder. A standard SMA connector is used to bias the SDD and to pick-up the signal output, see figure 5(a). The first SDD (Dia#0), used since the beginning, was acquired in 2014 and fully characterized at the Frascati 14 MeV neutron generator (FNG) [10]. The second SDD (Dia#1), identical to Dia#0 apart from improved metal casing, was acquired in 2015 and also tested at FNG before being used at NPL. The electronics are standard CAEN catalogue units and include a one channel charge sensitive preamplifier, and a DT5780 dual digital multi channel analyzer (MCA). DT5780 accepts directly pulses from the charge sensitive preamplifier per-forming a digital trapezoidal shaping on exponential decaying signals. Two HV channels able to supply a bias voltage up to ±0.5 kV, 300 µA and two connectors to power the pream-plifier are part of the DT5780.
The ‘horseshoe’ activation foil holder surrounding the target can hold 4 Al foils, 4 Fe foils and 8 Nb foils, each 1 mm thick and 18 mm in diameter (figure 5(b)), to measure the four reactions described in table 2. All foils are at the same distance from the target centre. The horseshoe assembly is designed in such a way that during the in-vessel calibration it can be con-veniently removed at the end of each NG operational period. In particular, the NG can be removed from the vacuum vessel within the Octant 1 boom tent where the foils used can be easily exchanged by remote handling methods at the end of each day. The activation of used foils can then be measured at a remote
γ-ray spectrometer and the horseshoe with fresh foils returned
to the vacuum vessel ready for the next NG operation period. The activation reactions chosen for the monitoring foils were selected based on numerous requirements: the reaction
thresholds should be sufficiently high to discriminate lower energy neutron scatter, and the reaction must be a standard dosimetry reactions with well known cross sections. Finally, the nuclear reactions chosen for NG characterization should also be used during the DTE2 campaign in the JET KN2 diagnostic. Given the above requirements, the intensity of the NG and the available irradiation time, the following nuclear reactions were selected as activation monitors for 14.1 MeV neutrons: 27Al(n,p)27Mg, 56Fe(n,p)56Mn, 27Al(n,α)24Na and 93Nb(n,2n)92mNb. Nuclear data for analysis was taken from the International Reactor Dosimetry and Fusion File (IRDFF, volume 1.05) [11]. Fundamental nuclear data parameters relating to the products of nuclear reactions, the gamma lines, intensities and half-lives were taken from the National Nuclear Data Center, Brookhaven National Laboratory, US. The main parameters for the selected reactions are given in table 2. All the activation foils used for the NPL measurement campaigns were of 18 mm diameter and 1 mm thickness, except for nio-bium foils which were 2 mm thick.
The monitoring detectors have to be attached to the NG in the same fixed positions both during the calibration\charac-terization campaign and during the in-vessel calibration. In this way, the active monitoring detectors can be ‘absolutely calibrated’ in their operating conditions, i.e. their absolute response in the operating position can be derived. However, the monitoring detectors will experience a different neutron spectrum during the in-vessel calibration with respect to that occurring in the calibration campaign due to the presence of neutrons scattered by the vacuum vessel itself. This effect is minimized by the fact that the detectors are very close to the NG, and by the choice of high energy threshold reactions (the 93Nb(n,2n)92mNb activation reaction and, for the SDD, the 12C(n,α)9Be reaction with a threshold at 6.18 MeV).
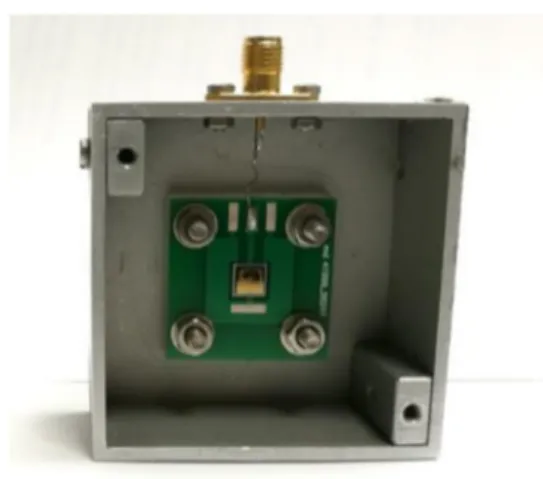
(a) (b)
Figure 5. (a) The two ‘monitoring’ diamond detector: Dia#0 (left) and Dia#1 (right). (b) The activation foils in the horseshoe holder. Table 2. Dosimetry reactions selected for the ‘monitoring’ activation measurements.
Reaction
Energy threshold
(MeV) Cross section at E = 14 MeV (b) Half-life Isotopic abundance
Gamma energy
(keV) Gamma decay probability
27Al(n,p)27Mg 3 0.10 9.458 min 1 843.7 0.718
56Fe(n,p)56Mn 4 0.09 2.579 h 0.918 846.8 0.989
27Al(n,α)24Na 5 0.12 14.997 h 1 1368.6 0.999
Nonetheless, the effect will have to be taken into account by neutronics simulations to correct for the different operating conditions.
4. Modelling of neutron generator and source
Extensive neutronics analyses are required to derive the JET detectors’ calibration factors related to the plasma neutron source from those measured by deploying the neutron gen-erator inside the vessel, and to take into account the many par-ticular circumstances such as the presence of the RH system. For these reasons, a detailed and validated neutronics model of the NG and a source routine are needed. This is required also to analyse the calibration/characterization measurements at NPL, as discussed in the following sections.
4.1. Neutronics model
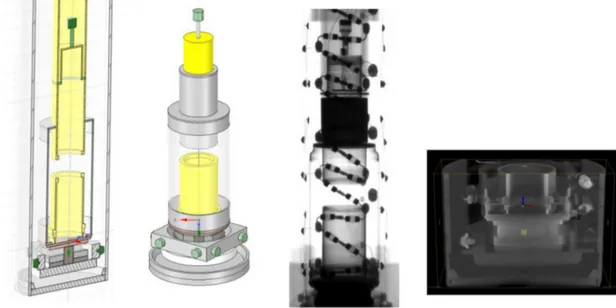
A detailed MCNP model of the NGs has been first devel-oped using the generic technical documentation provided by VNIIA. In addition, during the NG characterisation campaign, x-ray computed tomography (CT) scans of the generator were carried out at NPL, using a Nikon XT H 225M micro CT system, with a maximum x-ray beam energy of 225 kV. These scans revealed, in 3D, details that were not readily available in the manufacturer’s documentation. The materials informa-tion provided by the manufacturer was used in conjuncinforma-tion with the CT scans to create a detailed model of the NG target, backing and housing (figure 6).
Furthermore, a very precise MCNP model of the mechan-ical support, activation monitoring foils/holder, CAEN pre-amplifier, positioning lasers and monitoring detectors has also been developed, based on CAD models (figure 7). Models of the monitoring diamond detectors were incorporated by extracting their geometry from inverted MCNP models and integrated into the reference NG CAD model. The CAD models of the RH apparatus and monitoring detectors were
simplified using SpaceClaim [12]. Overly detailed minute fea-tures, such as screw threads and hexagonal bolt heads were rounded, spline surfaces were removed and approximated with conical or spherical surfaces. Any overlaps in geometry (interferences) were fixed and the final model was converted to MCNP Constructive Solid Geometry (CSG) form, using MCAM [13]. Where available, the FENDL 3.0 [14] nuclear data library was used for neutron transport simulations. The full model (NG with mechanical support and monitoring detectors) is used to accurately simulate the neutron field around the neutron source, the neutron fluence and spec-trum at the monitoring detectors, the neutron spectra at the DePangher Long counter positions and finally, to predict the activation of all components after operation as a function of irradiation time and cooling time [15].
4.2. Neutron source routine
The simulations of the neutron source were performed using the ENEA-JSI source subroutine [16]. The subroutine extends the standard MCNP6 by adding the ability to simulate the neutron production due to the more general case of the inter-action of beam D/T ions slowing down in the target of the NG and the D/T nuclei present there. The subroutine allows also accounting for atomic and molecular species in the beam which result in different effective energies on the target. The stopping power data from SRIM2013 [17] and DT fusion reaction cross-section from ENDF/B-VI.1 [18] were used. Other codes for the source description were tested in the pro-cess of the preparation for the use of the NG as a calibration source [19]. The ENEA-JSI source subroutine was selected as it has been extensively validated by the neutronics experi-ments performed at FNG [20].
The spectrum of neutrons produced by the commercially available DT neutron generators is difficult to predict due to the lack of reliable information about the composition of both the ion beam and the target. The presence of a mixed D/T beam, and of different molecular species, gives rise to
different neutron emission components whose relative inten-sity in the present work has been experimentally determined, as further discussed later in section 6. In the source subroutine these source components were simulated separately, using a large number of source events (2 × 10⁸ events) which were written to a file and then sorted according to their direction and energy. In this way SDEF cards describing each of the neutron source components in 400 directional (equidistant in cosine) and 170 energy bins (10 keV wide bins) were gener-ated. Once the relative intensities of the source components were determined, the resulting neutron source was produced as a weighted sum of the components, based on the standard source description card (SDEF card in MCNP) to speed-up the simulations.
The DT beam-target reactions are characterised by an energy-angle dependence and anisotropy of the neutron emis-sion intensity due to the reaction kinematics. The latter, being of the order of a few percent in the forward/backward direc-tions for ≈100 keV beam energy, cannot be neglected. The tube components are responsible for a much larger anisotropy profile, with sharp features, as the source neutrons interact with materials surrounding the target. They are also respon-sible for the presence of neutrons at lower energy resulting from the elastic and inelastic scattering. Figure 8 shows the neutron energy spectra of neutrons exiting from the neutron generator at different angles with respect to the beam direc-tion. The shown spectra are calculated for the ING-17 NG assuming, for simplicity, only a 100 keV D beam impinging on the target containing only T.
According to calculations, the fraction of neutrons in 4π sr
in the energy ranges En > 13 MeV, 1.5 MeV < En < 13 MeV,
En < 1.5 MeV amount to 75.6%, 14.5% and 9.9% of the total, respectively (implying that the neutrons with En > 13 MeV are 83.2% of all neutrons in the range E > 1.5 MeV). Also, the neutrons escaping from the neutron generator amount to 1.012 times the neutrons generated in the target due to neu-tron multiplication reactions. These numerical predictions are validated by neutron spectrum measurements (see section 6).
5. NG calibration and characterization campaigns at NPL
Two experimental campaigns have been undertaken at the Neutron Metrology Laboratory (NPL) in November 2015 and June 2016 for the calibration/characterization of the two NGs. Different ‘characterization detectors’ (to be distinguished from ‘monitoring detectors’) have been used according to the following strategy:
• Characterize/calibrate both NGs:
– Measure the neutron energy spectra at different emis-sion angles using a single crystal diamond spectrometer (SDD) in the energy range E > ∼8 MeV, and a NE213 liquid scintillator in the energy range E > 1.5 MeV; – Measure the neutron emission rate as a function of angle
(anisotropy profile) using absolutely calibrated long counters and activation foils, and the relative emission rate by monitoring diamond detectors;
Figure 7. Left: original CAD model of NG and of mechanical support, including the monitoring detectors. Right: the resulting MCNP model.
Figure 8. Calculated neutron energy spectra of neutrons emitted at different angles to the beam direction, due to the D+@100 keV → T
– Derive from the above measurements the total neutron emission in 4π sr.
• Calibrate the ‘monitoring detectors’ in terms of neutrons emitted by the NG per diamond count (neutrons/counts). • Use the calibration/characterization measurements to
validate the neutron source routine and the MCNP model of the NGs.
The experimental set up at NPL low-scatter area (24 m × 18 m × 18 m) is shown in figure 9. Measurements were performed for both NGs during both campaigns, with NGs located at the centre of a platform with rotating arms which allows simultaneous measurements to be performed. These consisted of ‘shots’ where each NG was run for 10, 15, or 20 min with a break in between shots to allow the generator to cool down and to move the instruments characterising the NG to different angles. Due to geometrical restrictions, both NGs had to be turned by 180 degrees about their vertical axis after approximately half of the measurements to realize a full 360 degree measurement. All of the electrical supplies for the NG and measured signals were transmitted using the same cables and scheme envisaged for the in-vessel calibration.
The low-scatter area at NPL is associated with a Van de Graaff accelerator and beamlines from this facility and the pres-ence of other detector transport arms limit the angular range of any one arm. Two LCs are available, but the one chosen for the fluence anisotropy measurement was a De Pangher pre-cision long counter. It was chosen in preference to the other ‘home made’ LG because its characteristics are better known for 14 MeV neutron detection. The De Pangher LC can move over the angular range from −30° to 135° relative to the axis of the NG when mounted with the Van de Graaff at its back side. For the NG the 0° direction is defined as being along the line of the charged particle beam impinging on the target. The angular range from 150° to −45° was covered by using the same range of low-scatter area angles, but rotating the NG by 180°.
5.1. Differences between campaign#1 and campaign#2
The first campaign at NPL in November 2015 served to test the selected detectors and methodology.
The following differences between the first and the second campaigns at NPL are to be noted:
– in the first campaign one SDD (Dia#0) and a Si diode were used as active monitoring detectors. As the Si diode was not stable, it was replaced by a second SDD (Dia#1) in the second campaign.
– only one mechanical structure was available for the two generators in the first campaign. Moreover, many tests were performed, for example rotating the NGs around their axis to check the poloidal symmetry of the neutron emission. As a consequence, the mechanical structure was removed and re-installed several times. The error in the positioning of the detectors was estimated to be ±1 mm.
– the mechanical structure, in particular the part carrying the monitoring detectors was improved in the second campaign to allow for a more reproducible positioning of detectors. Two mechanical structures were available during the second campaign, one for each generator. They were installed at the beginning of the campaign and never removed.
– a splitter was used on the CAEN MCA for the NPL team to acquire the diamond counts in 2015. It was removed in the second campaign as it had caused interference with the SDD acquisition system.
– NPL foil mounting involved a wheel with hollow alu-minium spokes in 2015, whereas in 2016 a disc of art material (polyboard) was used to improve the accuracy of positioning the NPL activation foils.
The final calibration data were obtained mainly in the 2016 campaign.
6. Measurements of neutron spectra
Neutron emission spectra were measured at different angles by means of a SDD spectrometer and a NE-213 scintillation spectrometer. A typical measurement arrangement is shown in figure 9.
6.1. SDD neutron spectrum measurements [21]
The SDD neutron spectrometer (figure 10) was designed and built at the CNR-ISM institute in Rome (Italy). The detector is made of a single-crystal chemical vapour deposition arti-ficial diamond sample (4.5 × 4.5 × 0.5 mm3) with boron concentration [B] <5 ppb and nitrogen concentration [N] <1 ppb, provided by Element Six Ltd. The detector was coupled to a CIVIDEC C6 fast charge preamplifier, which has a rise time of 3.5 ns and a shaping time of 25 ns. In some measure-ments, a CIVIDEC CX preamplifier optimized for high reso-lution spectroscopy was used. The latter has a rise time of 80 ns, a shaping time of 180 ns and a gain of 12 mV fC−1. The preamplifier output was fed to an 8 channels waveform digi-tizer, CAEN DT5730. This is a 14 bit and 500 MHz sampling rate digitizer equipped with CAEN software able to perform on-line measurements of the pulse area, by integrating each signal in a user defined gate.
Before the measurements at NPL, an SDD was character-ized in the laboratory with an alpha calibration source and tested with 14 MeV neutrons at FNG.
The principles of the spectrometric measurements for 14 MeV neutrons by the SDD have been presented in sec-tion 3. Several measurements have been performed at different angular positions in order to characterize the angle—energy distribution of the emitted neutrons from both NG#1 and NG#2. Measurements have been performed at different dis-tances from the target, covering a range from a few centim-eters up to 20 cm.
Figure 11 shows the full neutron pulse height spectrum (PHS) recorded at zero degrees and the recorded pulse height spectra at different angles from 0° to 150°.
At the time of the measurements, the exact composition of the D/T mixture in the NG beam and target was not known.
The NG supplier could only specify that the NG beam and the target contain both approximately 50% D and 50% T. However, D+, T+, D+
2, T+2, DT+ etc species were expected to
be present in the beam: D+, T+ ions would be accelerated by the potential difference set up in the NG, whereas D+
2, T+2 split
into two D, or two T atoms each having half energy. Finally, in the DT+ case, the split would produce D and T atoms which carry 2/5 or 3/5 of total energy, respectively. These beam components give rise to six possible different neutron energy distributions. Heavier molecules were not considered because they would give rise to D and/or T ions with lower energy, thus producing negligible amounts of neutrons.
The developed neutron source routine, used in MCNP com-bined with a detailed model of the NG, is able to describe the neutron spectra of emitted neutrons produced by the different components, at any emission angle and for any NG accel-eration voltage. Figure 12 (left) shows the calculated energy spectra of neutrons emitted at zero degrees with respect to the beam direction for a beam acceleration voltage of 73 keV. Figure 12 (right) shows the calculated neutron spectra corre-sponding to the six spectral components (per source neutron) convolved with a Gaussian with full width half maximum (FWHM) of 120 keV (to simulate the diamond spectrometer measurement). The nominal operation voltage of the neutron generator is 100 kV; however, if such a value was used as input parameter for the MCNP simulations, the calculated neutron spectra could not reproduce the measured ones. In fact, due to the fusion reaction kinematic, both the maximum energy and the width of the neutron spectrum are functions of the beam energy. Assuming 100 kV, no combination of the various components could be found to match the measured spectrum because all the components were too large. By decreasing the value of the operation voltage in the MCNP simulations, the agreement between data and simulations improved. The best agreement, using the Chi-square test, has been found for an acceleration voltage equal to 73 kV.
Figure 13 shows the results of the step by step fit procedure in which the molecular components have been added one at the time. As shown more in detail in [21], the best numerical fit was obtained when all the molecular components were taken into account in the numerical fit. The DT component is the one responsible of the ‘double’ peak and, by adding D2 and T2 components a better agreement is obtained. By adding the component due to the T on D reaction at full energy (73 keV), the shape of the spectrum at around 14.7 MeV on the high energy tail on the right of the peak could be correctly reproduced (see figures 12 and 13). Finally, the D component does improve the fit further in terms of χ2.
Thanks to the numerical fit and the simulated neutron yields the incident particle beam composition has been esti-mated revealing that the dominant fraction is due to DT mol-ecules (~80.44%), followed by D2 and T2 molecules (~8.95% and 7.32% respectively), by monoatomic T (~2.66%) and finally by monoatomic D (~0.63%). For the latter evaluation, the assumption that in the target there is the same quantity of deuterium and tritium molecules has been made.
In figure 13, the calculated (n,α) peak produced by the
neu-trons does not perfectly overlap the data on the left hand side
of the peak because of the presence of events which are likely to be ascribed to partial energy deposition and/or to imperfect collection of the charge in the SDD.
As shown in figure 14, the same beam composition could then be used to simulate successfully the spectra measured at different emission angles.
The comparison between the measurements performed at zero degrees of the two NGs shows that the two recorded peaks are the same in terms of shape and full width at half maximum (FWHM) but exhibit a slight shift at lower depos-ited energy for NG#2. Such an energy shift is probably due to a different operation voltage between the two neutron genera-tors, which is compatible with an operation voltage shift of a few kV of the NG.
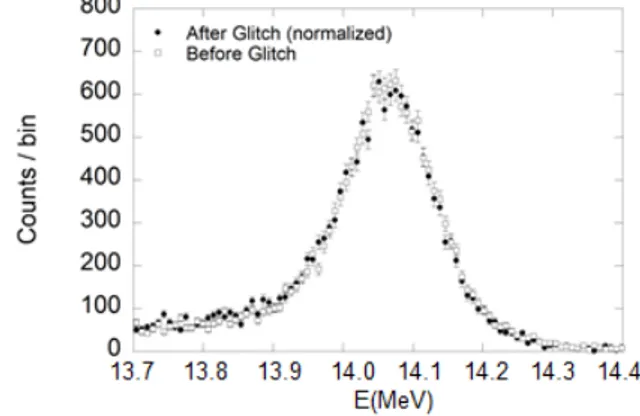
During the calibration measurements of the NG, an unexpected decrease of the neutron emission rate of NG#1 was observed by the SDDs (see section 7). As shown in figure 15, no changes in the measured neutron PHS have been noticed.
6.2. NE-213 liquid scintillator measurements
The NE-213 liquid scintillator neutron spectrometer provided measurements of fast neutron spectra at neutron energies
E > 1.5 MeV. From these measurements it is expected to get not only values for the angular neutron flux density around the DT fusion neutron peak but also the contribution of lower energy neutrons resulting from scattering in the NG body and validate the predictions based on the numerical model.
Figure 11. Pulse height spectrum (PHS) recorded at zero degrees (left). Pulse height spectra measured by the SDD spectrometer at different angles from 0 to 150 degree (right).
Figure 12. MCNP simulation of the emitted neutron energy spectra at zero degrees, produced by different reactions occurring in the NG (left) assuming an acceleration voltage of 73 kV. The same six components convolved with a Gaussian with full width half maximum (FWHM) of 120 keV (right).
Figure 13. Comparison between of the best numerical fit of the neutron spectrum recorded at 0 degree and the measured one at 73 kV acceleration voltage.
This scintillator can discriminate between photon and neu-tron events by pulse shape analysis. The signal processing chain was based on an analog electronics set-up and included a gain stabilizer for the photomultiplier of the detector. The zero-crossing method was used to discriminate photons and neutrons. From the recorded recoil spectra of protons inter-acting with neutrons in the scintillator and the response matrix of the detector, the neutron spectrum is computed with an unfolding procedure applying the MAXED code from the UMG-3.3 [22] package. For the spectrometer used in this work, experimentally qualified response matrices for photons and neutrons up to 16 MeV are available [23]. The measure-ment procedure was tested at the neutron generator laboratory of the Technical University of Dresden (TUD).
The spectrometer was located at 146.0 ± 1.0 cm from the source point (target centre of the NGs), and data were taken at several angles with respect to the neutron generator axis covering a full circle. The measurement time in each position was approximately 18 min with a short delay after which each NG was switched on so that the gain stabilizer for the photo-multiplier of the detector could settle. This measurement time allowed for sufficient counting statistics in each channel of the proton recoil spectra.
A long counter (LC) was mounted on the platform next to the NE-213 detector. This LC was covered with a shadow cone for parts of the measurement to determine the contrib-ution of room-returned neutrons to the count rate of the LC (see section 8). The shadow cone was comparably close to the scintillator of the NE-213 detector, however it was found that it has a negligible influence on the NE-213 measurement.
The MAXED unfolding code requires a guess spectrum as further input. Guess spectra calculated with the MCNP model and the neutron source routine were used for all measurements, and in each case the unfolding parameters such as the upper and lower limits of the proton recoil spectrum were varied to check for stability of the found solution. In case of NG #1, also flat guess spectra have been used to check for the quality of the measured raw proton recoil spectra. It was found that the neutron spectra obtained with the flat guess spectra were very similar to those obtained with the MCNP calculated guess spectra. Examples of the neutron spectra computed in this way for several angles with respect to the neutron generator axis are shown in figure 16. The figure shows also an expanded view of the DT neutron peaks which were represented by
spline functions rather than steps for clarity. Some of the derived spectra show a small peak at around 2.5 MeV which is believed to originate mainly as a result of the unfolding pro-cedure. Considering that the integral of this small peak is in the range 2%–4% of the DT total peak, if it were due to DD reactions it would require an unrealistic amount of deuterium to produce it at beam energies of 70–100 keV.
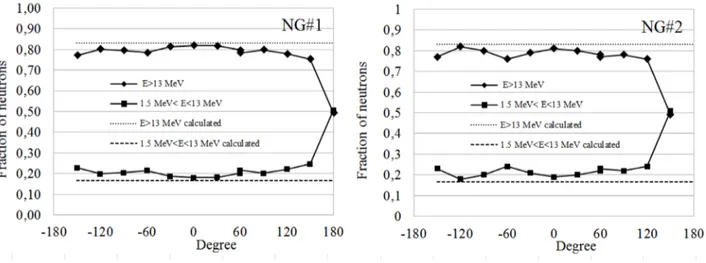
The ratios of measured neutron energy spectra in the ranges 1.5 MeV < E < 13 MeV and E > 13 MeV over the total fast neutron energy spectra (E > 1.5 MeV) are shown in figure 17 for both NG#1 and NG#2. They are in good agreement with numerical predictions (see section 4.2).
7. Measurements of the relative neutron emission rate by monitoring diamonds
Typical pulse height spectra measured by Dia#0 in the 2015 and in the 2016 campaigns are compared in figure 18. The same acquisition discriminator level was used. However a change in the detector gain was observed between the two campaigns (figure 18 left) due to removal of the signal splitter in 2016. After renormalizing the spectra over the same energy range, a slight change in the neutron energy spectrum has been observed in 2016 for both NG#1 and NG#2 due to changes in the surrounding environment, as shown by the curves rep-resenting the ratios of the partial full PHS area over the area of the main peak resulting from the 12C(n,α)9Be reaction in figure 18 (right). Overall, an increase of the full area/peak area ratio by about 5% was observed.
Figure 14. Comparison between the neutron spectra measured by the SDD at angles of 30°, 60° and 120° and the simulated spectra.
Figure 15. Comparison of the neutron spectra measured by the SDD at 90° before and after the NG count rate drop.
Nevertheless, the region of interest (ROI) in the spectrum for the purpose of the calibration is the main peak resulting from the 12C(n,α)9Be reaction. The peak area was first calcu-lated simply by integrating between fixed channels including
also the area under the peak, that is also proportional to the neutron emission rate. Then, a second approach has been used fitting the peak with a gaussian function plus a linear func-tion for the area under the peak. In this case a net peak area
Figure 16. Neutron spectrum at the 0 degree positions (left) and at the 90 degree positions (right).
Figure 17. Fractions of measured neutron energy spectra in the energy ranges 1.5 MeV < E < 13 MeV and E > 13 MeV over the total fast neutron energy spectra (E > 1.5 MeV) for NG#1 (left) and NG#2 (right). The dotted and dashed lines show the corresponding calculated values.
Figure 18. Pulse height spectra (PHS) of neutron emitted by NG#2 recorded by Dia#0 in 2016 and in 2015 NPL campaigns (left). The same PHS with channels renormalized to cover the same energy range (right). The curves referring to the right vertical axis represent the ratio of the partial full PHS area over the main peak area.
is obtained. The first method provides better statistical uncer-tainty but the results may be sensitive to the ROI extention, the second method is not as sensitive to the ROI extention but has a larger statistical uncertainty (20% less counts). The analysis of all diamond data has proven that the ratio of the peak areas obtained by the two methods is constant within the statistics and they are therefore equivalent for the calibration purpose.
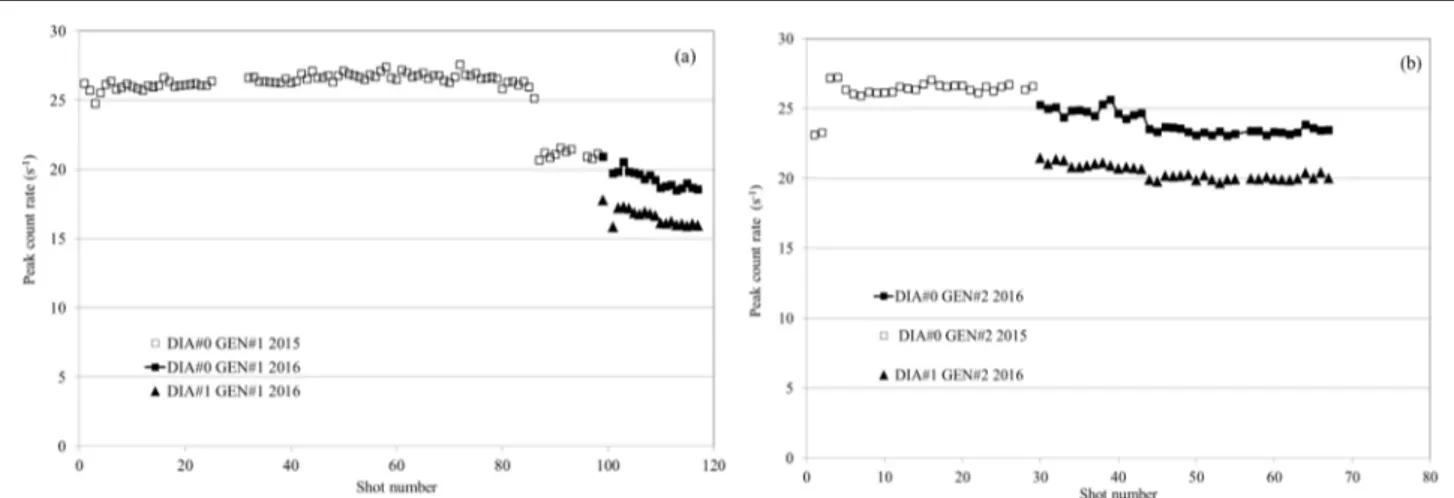
The diamond count rates for NG#1 and NG#2 are shown in figure 19. The total uncertainty on the (n,α) peak net count
rate is estimated to be 0.75% and includes uncertainties on • acquisition time: the start and stop was controlled by
‘hand’ so an absolute uncertainty of one second was reasonably assumed (0.1%–0.2%).
• Poisson statistics: (0.6%–0.65%)
• Dead Time calculation: the intrinsic dead time for the real time digital amplitude peak analysis was 5 µs. For
each measurement a dead time of 10 µs was imposed in
post processing so the software used for the post analysis automatically ‘killed’ every pulse closer to the previous one by less than 10 µs. At the available typical count rate,
a dead time of about 0.4% was achieved. The obtained counts during the live time were than renormalized to the real time.
• Amplitude interval for signal integration: an uncertainty of 10 channels for the range of signal integration was estimated, leading to an uncertainty ±0.3% on the counts in the (n,α) peak.
Dia#0 was found to be more efficient than Dia#1. The ratio of Dia#0/Dia#1 peak count rate was constant, and equal to 1.1700 ± 0.0049 for NG#1 and 1.1732 ± 0.0027 for NG#2. Although these average values agree remarkably well variations between shots were present, the ratio varying by typically 1% around the mean.
The NG#1 accelerating voltage was set to 100 kV throughout both campaigns. NG#1 neutron emission rate in 2015 was quite constant for 86 shots (40.5 h including the tests made by the supplier) and then dropped suddenly by about 25% and never recovered. The reason for this sudden loss of intensity was not understood. As shown in section 6.1, the neutron energy spectrum did not change. A further drop of about 10% was observed during the 2016 campaign. In the first
two shots of NG#2 in 2015, inspite of setting the accelerator voltage at 100 kV, the voltage of 96–97 kV was observed on the voltage scale of the PSCU remote control computer. The setting was therefore changed to 103 kV resulting in 100 kV on the voltage scale. This change caused a ∼15% increase in the neutron intensity (figure 19 left). NG#2 intensity was ini-tially very similar to that of NG#1, and it had decreased by about 12% at the end of 2016 campaign.
8. Absolute measurements of the neutron emission rates
A long counter (LC) was used to measure the absolute neu-tron fluence at different angles. This instrument has the advan-tages of high sensitivity, negligible gamma response in most situations, and a relatively constant neutron response over the energy region from roughly 1 keV to 7 MeV. Above this energy the response decreases monotonically. The present measurements were undertaken with a LC built to the tight specifications of De Pangher and Nichols [24]. Its response function has been determined to an accuracy of about 2.5% up to energies of about 15 MeV using radionuclide sources, neutron transport calculations [25], and international fluence comparison exercises [26].
The De Pangher LC is cylindrical in shape, 43 cm long by 40 cm in diameter, consisting of a central BF3 proportional counter tube surrounded by a polyethylene moderating layer and an outer shield layer. It is designed to be used with the source of neutrons on the axis and in front of the ‘front face’ which is at one end of the cylinder. This maximises the response to neutrons from the source, and the response to room and air scattered neutrons is minimised by the shield layer. Scatter corrections, which are still required, are achieved by making measurements with an absorbing shadow cone between the neutron source and the LC (figure 20) in addition to the meas-urement without the cone. The counts due to direct neutrons from a source are obtained by subtracting those measured with the cone present from those with it absent.
The LC is normally calibrated to provide the fluence at a fixed distance from a small, or a point, source of neutrons and this involves determination of the effective centre distance
from the LC front face. This parameter, like the efficiency, varies with neutron energy and has been obtained by a combi-nation of measurements and MCNP calculations. The efficien-cies and effective centres averaged over the spectra calculated with the MCNP model of the NG are shown in figure 21 as a function of angle with 0° corresponding to the direction of the DT beam in the NG.
Error bars of 0.2% in the efficiency and 0.3% in the effec-tive centre have been assigned to these values in the plots and the fact that a smooth line can be drawn through the points to pass within the error bars indicates that the relative random uncertainties for adjacent points due to statistics in the spec-trum calculations and the uncertainty introduced by the averaging are of this order or smaller. Relative uncertainties between the averaged efficiencies or between effective cen-tres at angles that are some way apart will depend on the acc-uracy of the calculational model at these different angles, and may well be larger than the rather small uncertainties shown in figure 21. The systematic uncertainty of about 2.5% in the absolute combined efficiency and effective centre values is
excluded from consideration of the uncertainties introduced just from the process of averaging over the calculated spectra.
The De Pangher LC was positioned at 300 cm from the target of the NG and the measured values for the neutron flu-ence at this distance per count from diamond detector Dia#0 are presented for NG#1 and NG#2 in figure 22 where they are compared with normalised calculated values.
The uncertainties indicated by the error bars on the meas-ured points (which are smaller than the symbol in most cases) are essentially the random errors in the measurements. The LC data were acquired by recording the counts from the BF3 over 1 min intervals during each NG shot. This provided a measure of the constancy of the fluence over a shot (the build-up of the NG to full output was clearly visible; the first cycle counts always being lower than the subsequent ones). The statistical uncertainty in the total and in the scatter counts were derived from Poisson statistics and was usually consistent with the uncertainty derived from the standard deviation of the 1 min counts (excluding the first minute), indicating that the output over a shot was very constant.
Figure 20. Left: the De Pangher LC, top left in the picture with the NG to the right and a shadow cone betw een these two devices. The device in the foreground to the left is the diamond spectrometer and its associated preamp. The target of the NG is positioned at the centre of the circle about which the LC can be rotated. Right: MCNP model of NG, LC and shadow cone used to calculate the LC spectrum averaged efficiencies and effective centres.
Figure 21. Spectrum averaged efficiencies and effective centres. The error bars represent uncertainties of 0.2% for the efficiencies and 0.3% for the effective centres. They indicate that relative uncertainties for adjacent angles are of this order or less although the actual uncertainties, e.g. those due to uncertainties in the model, are expected to be larger.
The direct counts were obtained by subtracting the scatter counts from the total and the uncertainties combined in quad-rature. Dead-time corrections were made using previously determined values for the dead-time per BF3 counter pulse. Two uncertainty components were added to the counting sta-tistics for the scatter counts. The measured scatter contrib-ution at angles other than 0° are probably too large because the LC sees neutrons scattered in un-shadowed parts of the NG body which should be part of the direct component and hence should not be subtracted. For example, the measured scatter at 90° was 20% compared to 16% at 0°. To allow for the uncertainty caused by this effect the scatter subtraction was chosen to be mid way between the minimum possible percent age value, 16% measured at 0°, and the measured value at a particular angle, and an uncertainty was assigned that was large enough to just cover both extremes. When per-forming shadow cone measurements at NPL an uncertainty comp onent of 5% is assigned to the scatter counts in addition to the uncertainty derived from statistics. This is to allow for inexact shadowing as the alignment and positioning of the shadow cone can never be perfect. For most neutron fields produced at NPL this 5% contribution to the uncertainty in the scatter subtraction is unimportant because this correc-tion is usually much smaller than in the present case, where the LC at 300 cm was further from the source of neutrons than usual, and the source was producing high-energy neu-trons almost isotropically thus producing a significant scatter comp onent. For the present measurements this 5% uncer-tainty in the scatter was in most cases the largest contributor to the final uncertainties in the direct counts. These varied between 1.2% and 1.4% for angles between 0° and 150° although they increased on approaching 180°.
Because the shadow cone has to be close to the source of neutrons, the mounting arrangements of the NG meant that shadow cone scatter measurements were not possible at 180°. Estimates for the scatter were therefore made by interpolating the data for scatter counts per diamond count as a function of angle and also by interpolating the scatter/total values. The predictions of the two approaches did not agree well so
a scatter correction corresponding to the mean from these two approaches was adopted with an uncertainty large enough to cover both values. This resulted in an uncertainty in the direct counts per diamond count of about 40%. This is largely due to the direct count being so small at this angle (about 14% of that at 0°), and this is because the neutrons have to traverse the full length of the NG. The contribution of the neutrons at this angle (and also that at 0°) to the total emission into 4π sr is, however, very small because the solid angle about these two angles is small.
The fluence at 300 cm from the NG target was calculated from the LC direct counts using the spectrum averaged LC efficiencies and effective centres. Corrections were made for small variations in the target to LC distance as the angle varied, and for air out-scatter. Uncertainties in these corrections were added in quadrature with the statistical uncertainties in the direct counts. One additional uncertainty component was added to allow for uncertainty in the LC angle. Values for the rate of change of the fluence with angle (dΦ/dθ) were taken from the MCNP calculations. The final values for the random uncertainties in the fluence (excluding the systematic uncer-tainty in the LC efficiency and effective centre) were between 1% and 2% in the majority of cases although they increased approaching 180° due to the uncertainty in the scatter correc-tion at this angle.
The calculations using the MCNP model of the NG provide values for the fluence at 300 cm per neutron emitted from the target. These values were normalised to the measured values using a normalisation factor N derived by taking a weighted mean of the measured/calculated ratios for all angles, n, where there were both measurements and calculations:
N = n i=1 n(Mi/Ci)/(σ2Ci+ σMi2 ) i=11/(σCi2 + σ2Mi) (1) where:
Mi is the measured fluence
Ci is the calculated fluence
σMi is the uncertainty in the measured fluence
σCi is the uncertainty in the calculated fluence
Figure 22. Measured fluence per diamond monitor count (Dia#0) at 300 cm from the neutron-producing target compared to normalised calculated values for NG#1 (left) and NG#2 (right).
correct. For angles near 180° the model is likely to be inac-curate because of uncertainties about the construction and the effect of the cable attached to the NG at this point and uncer-tainties of 5%, 3% and 2% were therefore assigned for the calculations for angles of 165°, 160° and 150° respectively. Values for χ2 close to 1 were obtained when all the other angles were assigned an uncertainty of 1% for the calculations implying uncertainties of this order in the calculated shape of the angular distribution at angles away from 180°.
An examination of the available data revealed differ-ences for the fluence per Dia#0 between 2015 and 2016, and between NG#1 and NG#2. Information on the ratios 2016/2015 and NG#1/NG#2 were available from, (a) data where LC results were available at a particular angle for both campaigns and/or for both NGs, (b) the factors derived to nor-malise the MCNP calculations to the measurements, (c) ratios of slab monitor counts to diamond counts. The slab monitor is a high-sensitivity neutron detector positioned permanently on the wall of the NPL low-scatter area. All three measure-ments gave very similar results and these are summarised in table 3. The tabulated uncertainties are based on the uncertain-ties in the individual measurements and the spread of results between the three approaches. The differences between 2105 and 2016 and between NG#1 and NG#2 were assumed to be due in part to positioning of the diamond monitor, which is very close to the target and the readings are thus very sensi-tive to the exact positioning, and in part to other differences described in section 5.1. Because of the difference between the 2016 and 2015 results, the data from 2015 were normal-ised by the average ratio to 2016 data for plotting in figure 22. After the normalisation between the 2015 and 2016 data for the shape of the variation of fluence with angle and the abso-lute values are in very good agreement.
Several conclusions can be drawn from figure 22. Data from both NGs show very similar features. The fluence also appears, as expected, to be symmetric in that results at nega-tive angles (to the left of the 0° line) agree with those at posi-tive angles (to the right of the 0° line). The overall shape is very well reproduced by MCNP calculations normalised to the experimental data and can be explained qualitatively by considering the construction of the NG. The target is mounted on a solid cooling block so neutrons emitted with angles less than ±90° are attenuated in the metal of this block.
neutrons detected by LC are about 1.2% higher than neutrons produced in the target in DT reactions. Taking this correc-tion into account, at the beginning of the first campaign the total neutron production rate into 4π sr was calculated to be
about 2.6 × 10⁸ s−1 for NG#1 in agreement with the manu-facturers estimate. When the output fell by about 25% during a shot near the end of the 2015 campaign, the fluence per dia-mond monitor count remained constant. At the beginning of the 2015 campaign the total neutron emission of NG#2 was similar, i.e. about 2.5 × 10⁸ s−1, and dropped during the two campaigns but only by about 12%.
Values for the total NG emission into 4π sr were obtained
by integrating the fluence values measured as a function of angle by the LC. For an anisotropically emitting neutron source, the neutron fluence φ(r, θ, α), at a distance r, and at angle Ω(θ, α), is related to the total source emission, B, by the double integral: B = 2π α=0 π θ=0φ(r, θ, α)r 2sin(θ)dθ dα (3) where the angle θ is in the horizontal plane and the azimuthal
angle α is in the vertical plane. If the neutron emission is
inde-pendent of the azimuthal angle, i.e. the source has rotational symmetry about its cylindrical axis of the NG, then the fol-lowing simpler relationship holds:
B = 2πr2 π
θ=0φ(r, θ) sin(θ) dθ.
(4) This simpler relationship was assumed to apply in the present situation. The integral was performed by using a numerical algorithm integration routine, or by using an Excel spreadsheet to calculate:
B = 2πr2
n
i=1
φi{[cos(θi)− cos(θl)] + [cos(θh)− cos(θi)]} (5) where
θi is the angle at which the fluence was measured
θl is an angle half way between θi−1 and θi
θh is an angle half way between θi and θi+1.
Both approaches gave very similar results. The uncertainty varied depending on the number of angles measured. The number of points for NG#1 in 2016 and NG#2 in 2015 were
limited and the uncertainties when integrating the measured data were thus higher.
In view of the good agreement between measurements and calculations for the shape of the angular dependence of the fluence the total fluence into 4π sr was also derived by
integrating the MCNP calculated data after normalising to the measurements. The different approaches gave very slightly different answers. This variation was taken as an indication of uncertainty introduced by the numerical integration process, and this was of the order of 1%. To this uncertainty must be added the systematic uncertainties, the predominant ones being those associated with the LC efficiency and effective centre. Other systematic components such as for air-out-scatter, dis-tance, dead-time, or LC stability are almost negligible when added in quadrature. The final estimated uncertainty in the total emission per diamond detector count is 3%. The results are presented in table 4.
The diamond count rates in table 4 are the average values over all the shots used in deriving the total neutron emission for a particular configuration. Shot to shot variations were sometimes quite large. For example, in 2015 the diamond count rates for NG#1 varied by more than 10% between the highest and lowest values. Day to day variations tended to be smaller. For NG#2 in 2015 the difference between the highest and lowest days was 3.4%.
From data taken in 2016 the average ratio of Dia#0/ Dia#1 over all shots was 1.1700 ± 0.0049 for NG#1 and 1.1732 ± 0.0027 for NG#2 and these ratios can be used to derive neutron emission per Dia#1.
9. Activation measurements
9.1. Monitoring activation measurements
The monitoring activation foils located on the mechanical support provide a complementary and independent measure-ment of the absolute neutron emission rate (n · s−1) for a given exposure period [27]. The foils were normally installed every morning and removed after the ninth irradiation cycle every day to allow the gamma spectrometry measurements to be started at a practical time. The main parameters for the selected reactions are given in table 2.
The neutron-induced radioactivity in a foil material can be expressed as:
A = YnRNT(1 − exp (−λtA))
(6) R =
∞
0 φ(E)σ(E)dE = φ (E) σ (E)
(7) where: A is the activity of a particular radionuclide induced by neutron activation (Bq), Yn is the neutron yield (n · s−1), R is the reaction rate (reaction·s−1), N
T is the number of target nuclei in the sample, λ is the decay constant of the activation
product, tA is the activation time, ϕ(E) is the neutron energy spectrum at the foils (cm−2 s−1 eV−1), and σ(E) is the reaction cross section (cm2).
The radioactivity after the series of subsequent irradia-tions each with irradiation time tAi (tAi ≠ tAi+1) and the subse-quent cooling time tCi (tCi ≠ tCi+1) is expressed by following equation:
An=Yn/t · NT· φ (E) · σ (E) ·
i
Bi(1 − exp (−λ · tAi))· exp (−λ · tCi) (8) where t is the total irradiation time, Bi is the relative amplitude of YN, recorded by the Dia#0 during subsequent NG pulses of duration tAi.
Each aluminium sample was measured twice. The activity of 27Mg and 24Na was in the range of 269–450 Bq·g−1 and 25–99 Bq·g−1, respectively. Between the two aluminium measurements, the 56Mn from the iron samples was detected. 56Mn activity was in the range of 51–141 Bq·g−1. The 92mNb activity, usually measured during the night, varied over the range of 1.64–7.11 Bq·g−1
The MCNP-calculated neutron reaction rates at the foil locations and the measured radioactivity were used to derive the neutron emission rate. The calculated reaction rates per source neutron are as follows: 8.34 · 10−5 s−1 for 27Al(n,p)27Mg, 1.24 · 10−4 s−1 for 27Al(n,α)24Na, 1.15 · 10−4 s−1 for 56Fe(n,p)56Mn, and 4.45 · 10−4 s−1 for 93Nb(n,2n)92mNb (note that these are normalised to one neutron produced in the target). The neutron emission rates derived for the four reac-tion products for each day of the experimental campaigns are presented in tables 5 and 6 and in figure 23.
The total uncertainty in the neutron emission rate was cal-culated based on the quadratic sum of different contributions. They include:
Table 4. Neutron emission rate for NGs into 4π sr per diamond count rate (peak ROI Dia#0). N.B. the emission rates are for all neutrons
emitted from the NG which according to the MCNP calculations corresponds to 1.012 times the number from the target.
Configuration
Total neutron emission per Dia#0 count
Average Dia#0 count
rate (s−1) Average total emission rate (s−1)
NG#1 in 2015 (1.011 ± 0.030) × 107 26.41 ± 0.05a (2.672 ± 0.080) × 108
NG#1 in 2016 (1.090 ± 0.032) × 107 19.32 ± 0.16 (2.106 ± 0.065) × 108
NG#1 all data normalised to 2016 (1.094 ± 0.033) × 107
NG#2 in 2015 (9.67 ± 0.029) × 106 26.25 ± 0.17 (2.538 ± 0.077) × 108
NG#2 in 2016 (1.035 ± 0.031) × 107 23.90 ± 0.13 (2.474 ± 0.075) × 108
NG#2 all data normalised to 2016 (1.038 ± 0.031) × 107
– the uncertainty on the activity measurement: 8.8% for 27Mg, 8.7% for 24Na, 8.7% for 56Mn, 8.7% for 92mNb. – the uncertainty on the number of target nuclei, equal
0.39% for Al samples, 0.12% for Fe samples and 0.06% for Nb samples.
– the uncertainty of the sums in equation (4) amounting to Mg: 1.51%, Na: 1.16%, Mn: 1.16%, Nb: 1.16%. The rela-tively high uncertainty of magnesium is due to its short half-life.
– the uncertainty on the reaction rates which is less than 0.1%. The uncertainties of cross sections in the activation calculation were not considered.
Discrepancies between reactions have been observed. These discrepancies are within the combined uncertainties
of the measurements and can occur for measurements taken on the same day. The standard deviation for the daily average neutron emission rates for NG#1 was within the range of 2.3–6.1%. For NG#2 the standard deviation was in the range of 4.6–5.9%, where more than 5% was observed only on the second day of the 2016 NPL campaign.
Finally, the absolute measurements provided by the moni-toring activation foils are compared to the neutron yield meas-ured by the NPL Long Counters. The comparison is shown in tables 5 and 6 and in figure 24. Once the 1.012 correction for neutrons from the NG (rather than the target) is included, the two methods are in agreement within 5.8% (if the first two days in NPL1 are not considered) for NG#1 and within 4.0% for NG#2, within the combined uncertainty of the two methods.
Table 6. Mean values for neutron emission rate from target of NG#2. All rates are in 108 n s−1.
27Mg Unc (%) 24Na Unc (%) 56Mn Unc (%) 92mNb Unc (%) Daily average SD (%)
Mean rate from LC Activation/LC ratio 2015 Day6 2.40 8.2 2.52 8.1 2.27 8. 2.32 8.7 2.38 4.6 2.44 0.98 Day7 2.58 8.2 2.59 8.1 2.36 8.0 2.41 8.7 2.49 4.6 2.51 0.99 2016 Day2 2.31 8.2 2.62 8.1 2.35 8.0 2.49 8.7 2.44 5.9 2.54 0.96 Day3 2.21 8.2 2.45 8.1 2.27 7.9 2.38 8.7 2.33 4.6 2.38 0.98
Figure 23. Neutron emission rates derived from the four activation measurements and daily average (horizontal bars) for each day of the experimental campaigns.
9.2. NPL activation measurements
Measurement of the neutron output from the NG was per-formed by irradiating thin iron and aluminium foils of diameter 25.4 mm. They are routinely used at NPL for mea-suring neutrons from the d + T reaction in the energy range 14–20 MeV, and have been used in international neutron flu-ence comparison exercises [26, 28, 29].
The foils were held in paper attached to lightweight alu-minium holders mounted in an alualu-minium ring for the 2015 campaign and in a foam board disc for the 2016 campaign (as shown in figure 25) at approximately 15 cm from the target of the NG. Some foils were also irradiated in contact with the surface of the NG, wrapped in cigarette paper (see figure 26). Foils were positioned at 15° steps from −120° to +120° with
0° corresponding to the direction of the deuterium–tritium beam in the NG. The distance of each foil from the surface of the NG was measured using a measuring rod with the foil at either the 0° or ±90° position, before rotating the aluminium ring or foam board disc to set the foil at the desired angle. The height of each foil was set using the laser installed on the laboratory wall.
Foil irradiations ranged from 1 to 6 shots in length (not the same as for the monitoring activation foils), depending on which reaction was being used and the position of the foil. In total 29 aluminium and 52 iron foils were irradiated over the
Figure 24. Comparison of neutron emission rates as derived from the Dia#1 calibrated by the NPL Long Counters (squares and triangles) and those derived by the monitoring activation measurements (daily average values, full circles).
Figure 25. Mounting arrangement of the foils in the 2015 (left) and the 2016 (right) campaign.
Figure 26. Mounting of foils on surface of NG.
Figure 27. MCNP model of NG and NPL activation foils around the head of the neutron generator.