DOTTORATO DI RICERCA IN
INGEGNERIA CIVILE, AMBIENTALE E DEI MATERIALI
Ciclo XXVIISettore Concorsuale di afferenza: 08A3 Settore Scientifico disciplinare: SSD/ICAR 04
TITOLO TESI
PERFORMANCES AND DURABILITY OF
ASPHALT MIXTURES MADE WITH
RECLAIMED ASPHALT PAVEMENT
Presentata da:
Dott. Ing. Luca Noferini
Relatore:
Prof. Ing. Andrea Simone
Coordinatore Dottorato:
Prof. Ing. Alberto Lamberti
Non est ad astra mollis e terris via (There is no easy way from the earth to the stars)
Seneca
It's a long way to the top (if you wanna Rock 'N' Roll) AC/DC
The experimental programme of the present research has been conducted at the Elletipi Srl Testing Material laboratory, Ferrara, Italy. Aggregates and RAP have been provided by S.A.P.A.B.A. SpA asphalt production plant in Pontecchio Marconi, Bologna, Italy. Neat bitumen has been furnished by Valli Zabban SpA, Bologna, Italy.
xi
Table of Contents
1
Introduction ... 1
1.1 Reclaimed Asphalt Pavement, RAP ... 1
1.2 Objectives and research approach ... 2
1.3 Materials and methods ... 3
1.4 The importance of testing both asphalt mix and bitumen ... 4
1.5 Scope of study ... 5
1.6 Chapters ... 5
1.7 Literature review ... 6
1.7.1 Interaction between RAP and virgin bitumen ... 6
1.7.2 Mix design of mixtures incorporating RAP ... 7
1.7.3 RAP content thresholds ... 8
1.7.4 Performances and durability ... 9
2
Use of RAP in pavement industry ... 13
2.1 Infrastructures and development ... 13
2.2 Factors impacting demand for road infrastructures ... 13
2.2.1 Economy ... 13
2.2.2 Public capital ... 15
2.2.3 Credit ... 15
2.2.4 Corruption ... 16
2.2.5 Value added of construction sector ... 17
2.2.6 Strategies to overcome road sector crisis in Europe ... 18
2.3 Asphalt industry in figures ... 18
2.4 Asphalt mixtures production in Europe ... 18
2.5 Bitumen consumption in Europe ... 22
2.5.1 Evolution of demand in the bitumen market ... 24
2.5.2 Crude oil and bitumen price ... 26
2.6 Reclaimed asphalt: the second life of road materials ... 29
2.7 Asphalt recycling in figures ... 30
xii
2.8.1 Economic and environmental benefits ... 34
2.8.2 RAP recycling turns short-term costs into benefits ... 37
2.8.3 Strategies to encourage and promote RAP recycling ... 39
2.9 Methods to incorporate RAP into asphalt mixtures ... 42
2.9.1 Hot recycling technologies ... 42
2.9.2 Addition of RAP in traditional batch plants ... 42
2.9.3 Addition of RAP in traditional drum plants ... 45
2.9.4 Factor limiting RAP usage in batch plants ... 46
2.9.5 Factors limiting RAP usage in drum plants ... 50
2.10 Methods to increase RAP usage in asphalt plants ... 53
2.10.1 Parallel drum ... 54
2.10.2 Double RAP dryer ... 56
2.10.3 Feeder system ... 57
2.11 RAP recycling case history ... 58
2.12 Annexes ... 62
3
Review of laboratory testing on asphalt mixtures ... 65
3.1 Particle size distribution ... 65
3.2 Density ... 67
3.2.1 Bulk density ... 68
3.2.2 Maximum theoretical density ... 70
3.3 Voids ... 74
3.3.1 Air voids, Vm ... 75
3.3.2 Voids in the mineral aggregate, VMA ... 76
3.3.3 Voids filled with bitumen, VFB ... 78
3.4 Compaction ... 79
3.4.1 Gyratory compaction ... 79
3.4.2 Roller compaction ... 84
3.4.3 Elletipi roller compactor ... 85
3.5 Fatigue resistance of asphalt mixtures ... 87
3.5.1 Test methods ... 87
xiii
3.5.3 Type of loading ... 91
3.5.4 Fatigue law ... 98
3.5.5 Advantages and disadvantages of different fatigue test methods ... 99
3.6 Four-point bending flexural fatigue ... 102
3.6.1 Test principle ... 102
3.6.2 Testing equipment ... 102
4
Review of laboratory testing on bitumen ... 111
4.1 Extraction and recovery ... 111
4.1.1 Hot extraction with wire mesh filter method ... 111
4.1.2 Cold extraction with centrifugal filter paper ... 112
4.1.3 Bitumen recovery with rotary evaporator... 113
4.2 Standard specification tests ... 114
4.2.1 Penetration test ... 114
4.2.2 Softening point test ... 115
4.3 European specifications for paving grade bitumens ... 117
4.4 Viscosity measurements with rotational viscometer ... 120
4.4.1 Scope and principle ... 120
4.4.2 Testing procedure ... 121
4.4.3 Measured and calculated parameters ... 122
4.5 Dynamic mechanical analysis with DSR (Dynamic Shear Rheometer) ... 124
4.5.1 Scope and principle ... 124
4.5.2 Measured and calculated parameters ... 126
4.5.3 Types of DSR testing... 128
4.5.4 Amplitude sweep tests... 128
4.5.5 Frequency sweep tests ... 129
4.5.6 Dynamic thermo-mechanical analysis, DTMA ... 130
4.5.7 Equivalency of frequency sweep and DTMA tests ... 130
4.5.8 Testing procedure and conditions ... 131
4.5.9 Factors affecting DSR measurements ... 132
xiv
5.1 Fear of the RAP? ... 135
5.2 Objectives and research approach ... 136
5.3 Experimental programme ... 136
5.4 Experimental programme on asphalt mixtures ... 138
5.4.1 Sampling of raw materials in plant ... 140
5.4.2 Characterization of raw materials ... 142
5.4.3 Mix design ... 147
5.4.4 Laboratory mixing ... 158
5.4.5 Volumetric testing ... 162
5.4.6 Production of prismatic samples ... 167
5.4.7 Flexural fatigue testing ... 173
5.5 Experimental programme on recovered bitumen ... 176
5.5.1 Extraction and recovery ... 177
5.5.2 Standard characterization ... 179
5.5.3 Viscosity ... 179
5.5.4 Dynamic mechanical analysis with DSR ... 181
5.6 Annexes ... 185
5.6.1 Proportioning of aggregate and RAP in mix design ... 185
5.6.2 Compaction curves ... 185
6
Results and discussion ... 189
6.1 Flexural fatigue tests on asphalt mixtures ... 189
6.1.1 Fatigue curves ε – Nf ... 190
6.1.2 Effects of RAP percentage on fatigue life of mixtures ... 194
6.1.3 Black diagram ... 196
6.1.4 Energy methods to analyse fatigue test results ... 198
6.1.5 Fatigue curves PV – Nf ... 206
6.1.6 Effects of RAP percentage on the dissipated energy ... 211
6.1.7 Considerations on the RDEC approach ... 213
6.2 Tests on recovered bitumen ... 216
6.2.1 Standard characterization test results ... 216
xv
6.2.3 Summary of results ... 228
6.3 Annexes ... 229
6.3.1 Fatigue curves (Wöhler) of asphalt mixes ... 229
6.3.2 Energy fatigue curves of asphalt mixes ... 231
6.3.3 Calculation of dissipated energy ... 233
6.3.4 Interpretation of the Ratio of Dissipated Energy Change (RDEC) ... 233
7
Conclusions ... 235
7.1 Research summary ... 235
7.2 Use or RAP in pavement industry ... 235
7.2.1 RAP in figures ... 235
7.2.2 Economic and environmental benefits of RAP usage ... 235
7.2.3 Methods for incorporating RAP into new hot asphalt mixes... 236
7.3 Laboratory procedures ... 237
7.3.1 Sampling, laboratory characterization and handling of raw materials and RAP ... 237
7.3.2 Mix design of RAP mixes ... 238
7.4 Results of laboratory testing on RAP mixes ... 238
7.4.1 Durability ... 238
7.4.2 Interaction neat-RAP bitumen ... 239
7.5 Practical implications ... 240
8
References ... 243
xvii
List of figures
Fig. 2.1: Gross Domestic Product (GDP) growth of different economies... 14
Fig. 2.2: plot of asphalt production and GDP in Italy in 2008-2014 ... 15
Fig. 2.3: value added at basic prices by sector of activity in 1995 and 2014, percentage composition ... 17
Fig. 2.4: employed by sector of activity, 2004-2014 ... 17
Fig. 2.5: chart of hot and warm mix asphalt production in Europe area, 2008-2014 [8] ... 20
Fig. 2.6: comparison of Europe area and United States production of hot and warm mix asphalt from 2008 to 2014 [8] ... 20
Fig. 2.7: variation of asphalt production in Europe, 2008-2014 ... 21
Fig. 2.8: impact of each country on European asphalt production variation, 2008-2014 ... 22
Fig. 2.9: total bitumen consumption in the European area, 2014 (Source: EAPA) ... 23
Fig. 2.10: market share of bitumen consumption in European area, 2014 (Source: EAPA) ... 23
Fig. 2.11: change in global bitumen demand: 2012 vs 2015 (Source: Argus Media) ... 24
Fig. 2.12: major flows of crude oil and petroleum products (Source: British Petroleum) ... 25
Fig. 2.13: crude volatility and bitumen price reaction (Source: Argus Media) ... 26
Fig. 2.14: the bitumen lag to heavy crude (Source: Argus Media) ... 27
Fig. 2.15: RAP availability of largest RAP producers in Europe, 2014 (Source: EAPA) ... 32
Fig. 2.16: different applications of available RAP in largest RAP producers countries in Europe and United States (Source: EAPA) ... 33
Fig. 2.17: percent of RAP used in valuable applications (hot, warm and cold recycling) ... 33
Fig. 2.18: different uses of RAP in Europe (Source: EAPA) ... 34
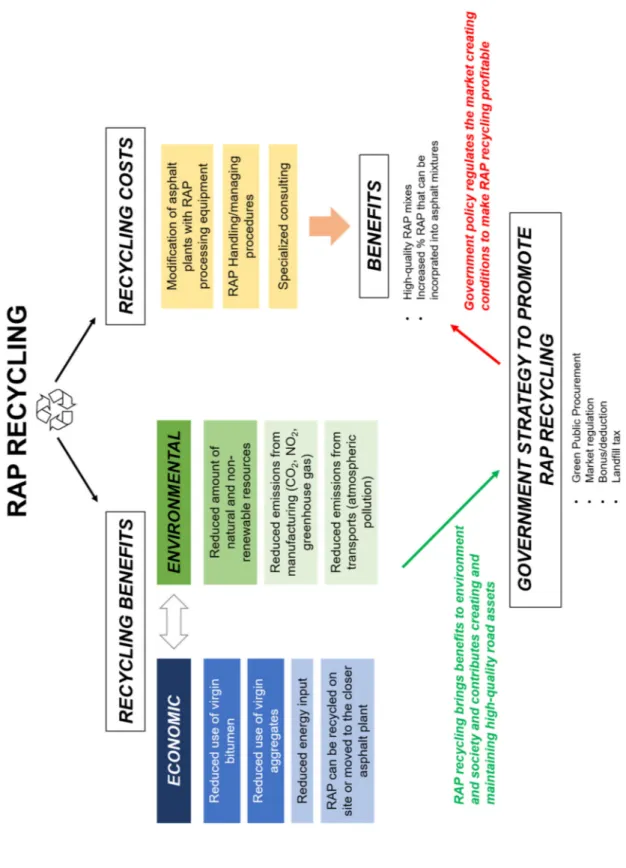
Fig. 2.19: benefits of RAP recycling and relationship with government’s strategies to encourage and promote recycling ... 41
Fig. 2.20: typical batch plant (Source: Amman) ... 43
Fig. 2.21: addition of RAP into drying drum (Source: KVM) ... 44
Fig. 2.22: addition of RAP into mixing chamber (Source: KVM) ... 44
Fig. 2.23: addition of RAP in the hot elevator (Source: KVM) ... 45
Fig. 2.24: process and components of traditional drum (continuous) plants ... 46
Fig. 2.25: amount of RAP incorporated into asphalt mixture as function of aggregate’s temperature (Source: Re-Road, 2012) ... 47
Fig. 2.26: variation of fine fraction in the same RAP material ... 50
Fig. 2.27: effect of RAP moisture content and drum’s dimensions on production rate of continuous plants ... 52
Fig. 2.28: parallel drum technology (Source: Re-Road) ... 55
Fig. 2.29: illustration of a batch plant with parallel dryer on top, used to dry RAP at 140-160°C 55 Fig. 2.30: double dryer inner chamber used to heat virgin aggregates (Source: Astec) ... 57
Fig. 2.31: double dryer external chamber used to dry RAP (Source: Astec) ... 57
xviii
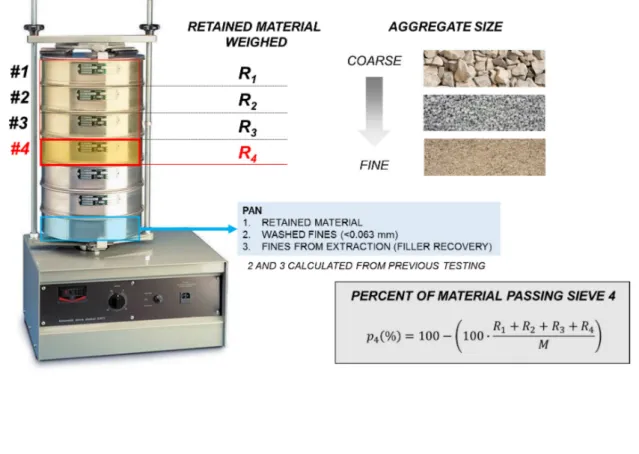
Fig. 3.1: sieving of aggregate sample and calculation of percent of material passing a specified sieve size ... 66 Fig. 3.2: example of grading curve for well-graded and gap-graded materials with interpretation of the curve’s shape ... 67 Fig. 3.3: reference volume of maximum theoretical density of aggregates ... 71 Fig. 3.4: apparatus for measuring the maximum density of asphalt mixtures with volumetric procedure, EN 12697-5 ... 72 Fig. 3.5: representation of air voids in asphalt mixtures ... 75 Fig. 3.6: schematic representation of voids in a reference volume of asphalt mixture. White areas represent the air voids, black and white areas represent the VMA ... 76 Fig. 3.7: representation of voids in the mineral aggregate for an aggregate blend ... 77 Fig. 3.8: concept of apparent film thickness [48] ... 77 Fig. 3.9: relationship between volumes different phases (aggregate, bitumen and voids) of an asphalt mixture ... 78 Fig. 3.10: compaction mechanism on asphalt material during paving operations on site ... 80 Fig. 3.11: gyratory compactor configuration ... 81 Fig. 3.12: gyratory compaction curves of one of the asphalt mixtures investigated in the present research ... 83 Fig. 3.13: main components of the Elletipi roller compactor ... 86 Fig. 3.14: detail of the two electric engines assembled on the metallic frame together with the steel cylinder ... 87 Fig. 3.15: compaction of an asphalt slab with the Elletipi roller compactor ... 87 Fig. 3.16: effect of test method on fatigue life of the same asphalt mixture ... 91 Fig. 3.17: stress distribution induced by a moving wheel in a flexible pavement, and strain distribution calculated at the bottom of the asphalt layer with software Alize LCPC ... 92 Fig. 3.18: shape of longitudinal (left) and transversal (right) strain measured with strain gauges bonded to the base of a bituminous layer, de La Roche et al, 1993 ... 92 Fig. 3.19: representation of stress and strain controlled mode of loading (Epps and Monismith, 1971) ... 93 Fig. 3.20: plot of stress and strain (permanent and recoverable) versus load cycle for a stress controlled indirect tensile fatigue test on asphalt specimen (400 kPa stress and pulsating load) ... 93 Fig. 3.21: plot of strain and stress versus load cycle for a strain-controlled 2PB fatigue test on asphalt specimen (220 με at 25 Hz) ... 94 Fig. 3.22: effect of mode of loading on the evaluation of fatigue life of the same asphalt mixture (Read, 1996) ... 95 Fig. 3.23: effect of haversine and full wave sine waveforms on fatigue life of the same asphalt mixture (Irwin, 1977) ... 97 Fig. 3.24: effect of load duration and loading frequency on measured fatigue life of asphalt mixtures (Porter and Kennedy, 1975) ... 98
xix
Fig. 3.25: representation of the Wöhler fatigue curve of one of the asphalt materials tested in the present research. Coefficients A and B of the fatigue law are determined by interpolation of measured data... 99 Fig. 3.26: simulation of 2PB fatigue test and representation of strain developing in the specimen during the upward-downward loading ... 101 Fig. 3.27: simulation of 3PB fatigue test and representation of stress developing in the specimen during the upward-downward loading ... 101 Fig. 3.28: simulation of 4PB fatigue test and representation of stress developing in the specimen during the upward-downward loading ... 101 Fig. 3.29: loading system used for the four-point bending fatigue tests ... 104 Fig. 3.30: components of the four-point bending jig ... 105 Fig. 3.31: four-point bending jig. The load frame reproduces the simply supported beam loaded in symmetric four-point bending, and transmits the sinusoidal loading from the actuator to the specimen though a vertical oscillation of the central frame ... 106 Fig. 3.32: IMACS unit for data acquisition and electronic control of the UTM ... 108 Fig. 3.33: set up of a fatigue test with UTS18 user interface. Transducers levels and virtual pendant windows are showed ... 109 Fig. 3.34: tuning and waveshapes control window of the UTS18 ... 110 Fig. 3.35: test data control window of the UTS18. Information on measured and calculated parameters are given in real time ... 110 Fig. 4.1: test procedures for bitumen extraction described in the European standard EN 12697-1:2012 ... 111 Fig. 4.2: Typical rotary evaporator ... 113 Fig. 4.3: penetration test apparatus [82] with geometrical specifications of standard needle and test configuration reported on the right ... 115 Fig. 4.4: determination of softening point with ring and ball apparatus. Instrumentation and test principle reported on the right ... 116 Fig. 4.5: European Standard references for different types of bitumens and applications ... 117 Fig. 4.6: different performances of bitumen with the same paving grade i.e. same penetration at 25°C ... 120 Fig. 4.7: representation of the rotational viscometer and accessories used for viscosity measurements ... 122 Fig. 4.8: representation of the two-plates mathematical model used to calculate rheological parameters and dynamic viscosity of investigated fluid (bitumen) with rotational viscometer .. 123 Fig. 4.9: temperature-dependent rheological behaviour of bitumen. The figure highlights the three different zones of behaviour in which bitumen may be divided ... 124 Fig. 4.10: plot of shear strain vs. time during a load cycle of a DSR strain-controlled test ... 125 Fig. 4.11: shear stress and strain vs. time measured during a cycle of DSR test. A phase lag can be seen between strain and shear (phase angle δ) ... 126
xx
Fig. 4.12: sinusoidal loading applied to a bituminous sample subjected to an amplitude sweep test with controlled shear strain. Amplitude increases with time, angular frequency has a constant
value of 10 rad/s ... 128
Fig. 4.13: plot of complex, storage and loss modulus curves versus strain amplitude during amplitude sweep test on bituminous sample B0 ... 129
Fig. 4.14: from left to right, ramp (dynamic temperature sweep) and step-by-step pre-set temperature profiles used for dynamic thermos-mechanical analysis of bitumens ... 130
Fig. 5.1: flow-chart of the research experimental programme ... 138
Fig. 5.2: schematic representation of segregation of aggregates in a cone-shaped stockpile . 140 Fig. 5.3: aggregate stockpiles in S.A.P.A.B.A plant ... 142
Fig. 5.4: disposition of stockpiles in plant and drainage pipes used to reduce the humidity of aggregates ... 142
Fig. 5.5: grading curves of aggregate fractions ... 144
Fig. 5.6: physical properties of RAP fractions, grading and apparent density ... 145
Fig. 5.7: grading curves of unprocessed and extracted RAP 0/8 and 8/12 ... 146
Fig. 5.8: flow-chart of standard mix design procedure ... 150
Fig. 5.9: flow-chart of mix design procedure for asphalt mixture incorporating RAP ... 152
Fig. 5.10: flow-chart of research mix design procedure ... 154
Fig. 5.11: grading curves of investigated mixtures ... 157
Fig. 5.12: variation of virgin bitumen in the mixture with the RAP content in 1kg of mixture. Increasing RAP reduces the quantity of neat binder necessary to reach the target bitumen content ... 158
Fig. 5.13: phases of mixing with laboratory planetary device ... 161
Fig. 5.14: aluminium mixing screw for planetary device designed and produced for the research ... 162
Fig. 5.15: gyratory compactor used for the present research ... 163
Fig. 5.16: compaction curves of asphalt mixes Mix0, Mix1, Mix2 and Mix3 compacted with gyratory device. Red line indicates the target 5% void content (95% of ρM) ... 165
Fig. 5.17: average bulk density measured for each mixture ... 169
Fig. 5.18: bitumen content of prismatic samples. Binder content has been determined after fatigue tests ... 173
Fig. 5.18: use of viscosity test results for determining mixing and compaction temperatures .. 181
Fig. 5.19: shear stress versus shear strain during amplitude sweep pre-test ... 183
Fig. 5.20: complex modulus G* versus shear strain during amplitude sweep pre-test ... 183
Fig. 5.21: calculation of the grading curve of mixes from the grading curves of aggregate and RAP fractions ... 185
Fig. 5.22: compaction curves of Mix0 ... 186
Fig. 5.23: compaction curves of Mix1 ... 186
Fig. 5.24: compaction curves of Mix2 ... 187
xxi
Fig. 6.1: example of S-N and phase angle-N curves automatically plotted by the UTS-18 during
the test ... 190
Fig. 6.2: fatigue curves (Wöhler) of investigated asphalt mixes on Log-Log chart ... 192
Fig. 6.3: average number of cycles to failure at 100 με for the investigated mixtures ... 194
Fig. 6.4: average number of cycles to failure at 200 με for the investigated mixtures ... 195
Fig. 6.5: ε6 calculated for each mixture ... 196
Fig. 6.6: Black diagram of investigated asphalt mixes ... 197
Fig. 6.7: example of hysteresis loop measured during a loading cycle of fatigue test on Mix0 199 Fig. 6.8: laboratory fatigue test results proposed by Van Dijk that suggest the dissipated energy is independent on mode of loading (Van Dijk, 1972) ... 199
Fig. 6.9: types of energy dissipated during a fatigue test ... 201
Fig. 6.10: example of dissipated energy during a fatigue test (4PB fatigue test on Mix0 at 200 με) ... 202
Fig. 6.11: illustration of the hysteresis loop of a fatigue test load cycle. The two components of dissipated energy, viscoelastic damping (light blue) and fatigue damage (red) are clearly defined (Bhasin et al, 2009) ... 202
Fig. 6.12: hysteresis loop rotates clockwise during fatigue test. Number of cycles are reported on the right from test start to termination for Mix0 tested at 100 με ... 203
Fig. 6.13: typical plot of RDEC versus number of load cycles with three behaviour zones. The example is taken from ... 205
Fig. 6.14: determination of coefficient “f” of PV from the DE-N curve fitting with power-law equation ... 206
Fig. 6.15: energy fatigue lines of investigated asphalt mixes plotted on Log-Log chart ... 208
Fig. 6.16: unique energy fatigue line for all the investigated mixes on Log-Log chart ... 209
Fig. 6.17: interpretation of energy fatigue line ... 210
Fig. 6.18: average number of cycles to failure at 100 με for the investigated mixtures ... 211
Fig. 6.19: average number of cycles to failure at 200 με for the investigated mixtures ... 212
Fig. 6.20: manual procedure to fit the w-N curve with a power law equation ... 214
Fig. 6.21: dynamic viscosity of bituminous samples at test temperatures of 135, 150, 160 and 170°C ... 217
Fig. 6.22: dynamic viscosity as function of aged binder content ... 218
Fig. 6.23: temperature susceptibility of bituminous samples measured through viscosity tests ... 219
Fig. 6.24: relationship between measured and LAR calculated viscosity of bituminous samples ... 221
Fig. 6.25: isochronal curves of complex modulus G* of investigated mixtures ... 222
Fig. 6.26: plot of phase angle represented as tgδ versus test temperature ... 224
Fig. 6.27: isochronal curves of storage component of complex modulus G’ ... 225
Fig. 6.28: isochronal curves of loss component of complex modulus G’’ ... 226
xxii
Fig. 6.30: Cole-Cole diagram for investigated bitumens ... 228 Fig. 6.31: Mix0 fatigue line ... 229 Fig. 6.32: Mix1 10%RAP fatigue line ... 229 Fig. 6.33: Mix2 20%RAP fatigue line ... 230 Fig. 6.34: Mix3 30%RAP fatigue line ... 230 Fig. 6.35: Mix0 energy fatigue curve ... 231 Fig. 6.36: Mix1 10% RAP energy fatigue curve ... 231 Fig. 6.37: Mix2 20% RAP energy fatigue curve ... 232 Fig. 6.38: Mix3 30% RAP energy fatigue curve ... 232
xxiii
List of tables
Table 2.1: types of end products and value related to different RAP uses ... 31 Table 2.2: economic and environmental advantages and increased production costs of RAP recycling ... 35 Table 2.3: negative impact of short-term “savings” on production of asphalt mixtures with RAP ... 39 Table 2.4: elevation of drying/heating temperature of aggregates depending on RAP moisture content and RAP being added in the hot asphalt mix ... 48 Table 2.5: summary of factors limiting the amount of RAP used in asphalt plants to produce new hot mix asphalt ... 53 Table 2.6: modifications to increase recycling capacity of asphalt plants ... 58 Table 2.7: production of hot and warm mix asphalt in Europe, period 2008-2014 ... 62 Table 2.8: production of HMA and WMA in Europe and United States from 2008 to 2014 ... 63 Table 2.9: paving grade bitumen consumption in EU-27 area, 2014 [27] ... 63 Table 3.1: choice of the bulk density method on the basis of the investigated material ... 70 Table 3.2: apparent density of aggregates for different types of rock ... 74 Table 3.3: gyratory compaction output data including density (corrected), voids and densification ... 82 Table 3.4: properties of asphalt materials measured on field cores and sample produced in laboratory with different compaction methods ... 83 Table 3.5: compaction temperature for asphalt slab compacted with laboratory roller compactor as function of bitumen grade ... 84 Table 3.6: summary of test configuration (geometry, stress distribution and load) for most commonly used test methods ... 89 Table 3.7: comparative evaluation of controlled-stress and controlled-strain mode of loading (Rao Tangella, 1990)... 95 Table 3.8: comparison of advantages and disadvantages of different fatigue test methods ... 99 Table 3.9: UTM 25 technical specifications ... 103 Table 3.10: hydraulic power supply specifications ... 103 Table 3.11: Environmental chamber technical specifications ... 103 Table 3.12: procedure for positioning the asphalt beam into the four-point bending jig ... 106 Table 3.13: specifications of the IMAC device ... 107 Table 23: repeatability and reproducibility limits reported in EN 1427:2007 for bitumens with softening point below 80°C ... 116 Table 24: properties and related test methods for paving grade bitumens according to requirements of European Standards EN 12591:2009 “Bitumen and bituminous binders-specification for paving grade bitumens” ... 118 Table 25: typical values of penetration, softening point and Fraas for different types of penetration graded bitumens, EN 12591 ... 119
xxiv
Table 26: specifications of the Brookfield DV-II + Pro Extra rotational viscometer used in this research ... 121 Table 27: DSR test conditions for rheological investigations on bituminous samples with amplitude sweep and temperature sweep tests ... 131 Table 5.1: resume of the experimental program for the first phase of the research: laboratory testing on asphalt mixtures ... 139 Table 5.2: list characterization tests on raw materials ... 143 Table 5.3: physical properties of aggregates, grading and apparent density ... 144 Table 5.4: recommended use of unprocessed or extracted RAP grading curve depending on asphalt mixture ... 145 Table 5.5: average bitumen content of RAP 0/8 and 8/12 laboratory samples ... 147 Table 5.6: average apparent density of RAP 0/8 and 8/12 laboratory samples ... 147 Table 5.7: composition of the four investigated asphalt mixtures ... 155 Table 5.8: proportion of raw materials for the investigated RAP mixtures ... 156 Table 5.9: percent of material passing at each sieve for each investigated mixture ... 156 Table 5.10: Temperature and time of preheating of raw materials ... 159 Table 5.11: configuration parameters of gyratory device and specimen info ... 162 Table 5.12: results of bitumen extraction on asphalt mixes ... 165 Table 5.13: compaction curves slope ... 166 Table 5.14: target density calculated from volumetric testing with gyratory compactor ... 167 Table 5.15: dimensions of asphalt slabs and prismatic samples ... 168 Table 5.16: results of bulk density measurements on prismatic samples obtained from asphalt slab ... 168 Table 5.17: air void content calculated from measured bulk and maximum density for each prismatic sample... 169 Table 5.18: confidence interval for normal distribution as function of degrees of freedom... 170 Table 5.19: repeatability of density measurements of each group series ... 171 Table 5.20: repeatability of density measurements of all prismatic samples ... 171 Table 5.21: bitumen content by mass of the mix of prismatic samples, after being tested to flexural fatigue ... 172 Table 5.21: resume of the experimental program for the second phase of the research: testing on recovered bitumen ... 176 Table 5.22: soluble binder content extracted and recovered from beams and unprocessed RAP ... 178 Table 6.1: fatigue test configuration ... 189 Table 6.2: number of cycles to failure at Nf20 resulting from flexural fatigue tests on RAP mixes
... 191 Table 6.3: fatigue lines parameters ... 192 Table 6.4: Plateau Value PV and number of cycles to failure at Nf20 resulting from flexural fatigue
xxv
Table 6.5: energy fatigue lines parameters ... 208 Table 6.6: unique energy fatigue line parameters ... 209 Table 6.7: results of standard characterization tests on recovered binders ... 216 Table 6.8: results of dynamic viscosity test on recovered binders ... 217 Table 6.9: comparison between viscosity values of bituminous blends measured in laboratory and values calculated with LAR ... 220 Table 6.10: complex modulus values measured with DSR for each bitumen, reported at temperature steps of 10°C ... 222 Table 6.11: phase angle values measured with DSR for each bitumen, reported at temperature steps of 10°C ... 223 Table 6.12: results of cross-over temperatures and corresponding complex moduli G* of investigated mixtures ... 224
xxvii
Keywords
Hot mix asphalt
Reclaimed asphalt pavement (RAP) Recycling
Laboratory testing
Durability of asphalt mixtures Bitumen rheology
xxix
Abstract
According to most recent surveys, 265 mil tonnes of asphalt for road applications have been produced in the European area in 2014. In the same year, the amount of available RAP was more than 50 mil tonnes. The use of RAP in new blended mixes reduces the need of neat bitumen, making RAP recycling economically attractive. In spite of its economic and environmental benefits, the use of RAP is often subjected to restrictive policies pursued by agencies due to uncertainty related to RAP mixes field performances.
This thesis focuses on the effects of RAP on performances and durability of new asphalt mixes produced incorporating RAP with a standard hot-in-plant process. The influence of RAP being incorporated in new mixes has been investigated through an extensive laboratory testing campaign on asphalt mixtures and on bitumen recovered from the same mixes.
A specific typology of asphalt mixture has been produced with different RAP percentages of 10%, 20% and 30% by mass of aggregates. In the first phase of the research, asphalt materials have been characterized and compared in terms of resistance to fatigue, stiffness and volumetric properties. The second phase of the research aims to investigate the effects of RAP on asphalt binder as a composite blend of neat and RAP bitumen. Bituminous samples have been recovered from asphalt samples tested in phase 1 and then have been studied and compared with standard and dynamic laboratory tests.
Findings show that hot asphalt mixtures can be successfully produced incorporating up to 20% of RAP (by mass of the mix) in the fresh mix. For these percentages of RAP being recycled, no negative effects on performances and durability of recycled mixtures have been noted. However, the final bitumen grade of the mix may be adjusted if more than 20% of RAP is added. Furthermore, practical implications regarding production methods and paving of RAP mixes are proposed.
1
1 Introduction
1.1 Reclaimed Asphalt Pavement, RAP
During their service life, roads experience the action of a huge variety of external factors as traffic, weather condition, thermal shocks, chemical agents, which can all be considered “external loads”. Accumulation of small and routinely repeated external loads together with exceptional events that may occur lead distresses to raise and spread into the pavement over the years, with increased severity.
A well-planned road maintenance avoids excessive spread of distresses on pavements and contributes keeping the road system in good conditions. Depending on severity of distresses and hence on the required maintenance, one or more asphalt layers may be removed and then replaced with new layers. Old asphalt layers can be dismantled with an excavator or, better, removed with a milling machine. The first produces asphalt blocks, the second produces a granular material made of aggregates and old bitumen. Both are called “Reclaimed Asphalt Pavement” (RAP).
RAP is a source of raw materials, aggregates and old bitumen, 100% reusable or recyclable [1]. RAP recycling has both economic and environmental advantages: it reduces the need for virgin and non-renewable raw materials i.e. virgin aggregate and bitumen; RAP can be used as raw material to produce high quality asphalt mixtures; recycling reduces the amount of RAP being dumped to landfill and gives high value added to RAP; it also reduces transportation costs and related emissions; in cold and warm recycling, a lower energy input is required. On the other hand, the use of RAP may increase production costs on a short-term periods, for example: retrofitting of old asphalt plants; increased costs for RAP handling i.e. storage and processing; costs for lab tests to characterize stockpiled RAP; investments to buy special machines (cold-in-place recycling). However, all short-term costs turn into environmental and economic benefits in the mid-period. This makes RAP a resource for the road construction sector, making reusing or recycling RAP a valuable and profitable practice.
The most common RAP applications in Europe are: hot recycling in asphalt plant, hot in-place recycling, cold in-place recycling and full depth reclamation are the most commonly applied techniques [2]. Hot, warm and cold recycling are the most valuable procedures for recycling RAP because the less expensive RAP bitumen can replace a portion of the more expensive virgin bitumen [3]. Using the old asphalt bitumen in the newly blended mixtures and, therefore, reducing the required new bitumen content, makes the use of RAP in HMA mixtures economically attractive [4]. It is considered that the most economical use of RAP is in the intermediate and surface layers of flexible pavements because the less expensive RAP binder can replace a portion of the more expensive virgin binder [3]
2
The percentage of RAP (usually expressed by mass of the aggregate in the mix) that can be incorporated into asphalt mixtures depends on production process (plant type, production temperature, mixing time, and discharge temperature), paving technology and permitted emissions as well as RAP source and properties. These factors affect the interaction between RAP and virgin bitumens and consequently impact the performance of asphalt mixtures [5]. Considering hot in plant recycling, most conventional drum plants can accommodate 50% RAP, whereas the percentage of reusable RAP in batch plant ranges from 10 to 30% [6]. These limitations have been overcome thanks to multiple technologies readily available for production of up to 100% recycled hot mix asphalt [7].
On average, Europe recycles more than 70% of RAP. 61% of available RAP is used in hot mix recycling to produce asphalt mixtures with a certain amount of RAP. Cold and warm recycling involve 5% and 4% of available RAP. 13% of RAP is used as filling material into unbound granular layers, whereas 7% is dumped. The remaining RAP 10% is used in other civil engineering applications [8]. Italy uses only the half of its available RAP for valuable applications as hot, warm and cold recycling. 30% of RAP is dumped in landfill areas, 20% is used for filling unbound layers. Of the remaining 50%, only 20% is used in hot recycling and 30% is used in cold recycling.
Many agencies and public administrations insert restrictions on RAP percentages ranging from 10 to 30% in their regulations due to concerns for pavement performances and production technologies. Uncertainties concern the interaction between RAP binder and virgin binder and the effects on properties of the mixture. Inaccurate assumptions on the effects of interaction might create problems both in mix design and pavement performance [2, 5], leading to mixtures that might be subjected to premature failure to cracking, ravelling, moisture damage and rutting. At present, there is no industrial approved standard method to predict the degree of blending in laboratory [3], and tests shall be carried out for evaluating the effects of interaction between RAP binder and virgin binder on mechanical behaviour of RAP mixtures.
The success and spread of RAP recycling practices depend mainly on two factors:
1. Asphalt mixtures produced incorporating RAP, even in high quantities, shall perform at least as the same mixes made with only virgin materials
2. RAP mixes shall be profitable at least as virgin mixes
Experience suggests that if one of these two conditions fails, RAP will not be recycled or, in the worst case, it will be improperly recycled resulting in low-quality RAP mixes. In spite of all environmental benefits of RAP recycling, companies would not be able to afford higher costs without economic advantages.
1.2 Objectives and research approach
This thesis focuses on the effects of RAP on performances and durability of new asphalt mixes produced incorporating RAP with a standard hot-in-plant process. The effects of RAP have been investigated through an extensive laboratory testing campaign on asphalt mixtures and on bitumen recovered from the same mixes. The laboratory testing activity of the present
3
research aims to investigate performances and durability of asphalt mixtures produced incorporating different percentages of RAP.
The objectives of the present research are listed below:
1. Investigate the effects of RAP on performances and durability of asphalt mixtures. In detail, the research investigates the effect of increasing percentages of RAP (sampled from the same source) on performances of the same type of asphalt mixture 2. Study to what extent the interaction between virgin and RAP bitumen affects properties and response of asphalt mixes by measuring the effects both on asphalt mixes and bitumen
3. Define the threshold value of RAP that can be incorporated into a bituminous mix without compromising its long-term performances
4. Determine the correct procedure to incorporate RAP into mixtures produced in laboratory
5. Provide figures on the use of RAP in Europe: amount of asphalt being recycled, technologies, applications, by-products of RAP recycling
6. Give a comprehensive overview on methods to incorporate RAP into asphalt mixtures both in batch and drum plants
The main goal of the research is to answer to simple questions that often rise in the daily practice, as: “how much RAP can be added into a specific mix?” or “how does the presence of RAP affects performances of the asphalt mixture?”
Ensuring confidence in the design procedure and the success of using RAP would require addressing many durability concerns related to the interaction between virgin and recycled materials [9].
1.3 Materials and methods
The investigated material is a hot asphalt produced in plant and used in binder layers of flexible pavements. Four versions of the same mix have been produced in laboratory with different RAP contents.
The research is divided in two phases: in the first phase, the effects of RAP on asphalt mixtures are investigated. A specific typology of asphalt mixture is produced with different RAP percentages of 10%, 20% and 30% by mass of aggregates. Asphalt materials are characterized and compared in terms of resistance to fatigue, stiffness and volumetric properties. A great effort was put to produce mixtures with different RAP content but similar grading curve, bitumen content, which is sum of virgin and RAP bitumen, air void content and density. The process of manufacturing of asphalt mixes in laboratory is essential in order to obtain mixes with the desired properties and to produce samples that are representative of mix properties.
The second phase of the research aims to investigate the effects of RAP on asphalt binder as a composite blend of neat and RAP bitumen. Bituminous samples are recovered from asphalt samples tested in phase 1 and then are studied and compared with standard and dynamic tests.
4
In literature, laboratory testing are generally performed on blends made of neat and old bitumens, the latter recovered from RAP. Alternatively, RAP bitumen can be replaced with neat bitumen that has been aged in laboratory to simulate ageing that has occurred in RAP bitumen. A limitation of these two approaches is that neither of the two consider the actual bitumen and both perform tests on a bitumen that may differ from that present in the asphalt mix.
The experimental programme of the research was conducted with only standardized test procedures according to European standards. This for two reasons. First, test developed apart from the standards (thus with no standard procedure to follow) requires to be validated in terms of procedures, data processing and results. Repeatability and reproducibility are key issues when dealing with the high variability of RAP. Further uncertainty caused by test procedure is not required and desired neither. Second, the use of standardized tests allows to develop a sound methodology that can be used by everyone who needs to test mixtures containing reclaimed asphalt. A characterization procedure can be proposed standing on solid bases of European standard tests.
The underlying idea of the research is to investigate a common asphalt mixture produced with standard materials, i.e. natural limestone aggregates and unmodified 50/70 pen grade bitumen, and with properties that are consistent with the most common technical specifications. RAP has been incorporated into new mixes simulating the hot-in-plant recycling process. Recent surveys show that 61% of available RAP is used in hot-in-plant recycling. The percentages of 10, 20 and 30% of RAP being incorporated into the mixes reflect the most common usage of RAP into traditional batch asphalt plants in Italy i.e. with no specific retrofitting to handle high quantity of reclaimed asphalt. The choice of common materials and well-established procedures was made to give the wider validity to research findings and to make the testing procedure accessible and reproducible to other laboratories or asphalt plants.
1.4 The importance of testing both asphalt mix and bitumen
The testing activity of this research was conducted both on asphalt mixes and recovered bitumen as formerly described.
Firstly, test results grab different information of depending if they’re performed on asphalt mixes or on bitumens, highlighting different aspects and properties of the investigated mixes.
Tests on asphalt mixtures can describe performances, durability and expected behaviour of RAP mixes in field, but provide only indirect evidence of the interaction between virgin and RAP bitumen and almost no information about workability.
Tests on bitumen allow to investigate in detail the interaction between new and old bitumen and the workability of mixtures, but give only partial information about performances of mixes and no information about durability (with regard to the testing activity of this research). The expected behaviour of the investigated mixtures in field can be deducted only indirectly from results of bitumen testing.
5
Furthermore, results of asphalt and bitumen testing can be compared to evaluate their consistency. In other words, similar conclusions should be drawn from results of asphalt and bitumen testing. If this should not be the case, errors or inaccuracies in the testing procedures might be present.
1.5 Scope of study
The products of the research are presented below:
1. Present test results that clearly determine the effects of RAP on performances and durability of investigated mixes
2. Define a procedure for incorporating RAP into mix design of asphalt mixtures in laboratory that includes: sampling, handling, characterization, testing, interpretation of results
3. Find the maximum amount of RAP as percentage by mass of aggregate that can be incorporated into the investigated asphalt mix
4. Provide guidelines to extend the research to other hot asphalt mixtures produced incorporating RAP
1.6 Chapters
The present thesis is organized into 7 chapters each focused on a specific topic:
The second chapter “Use of RAP in pavement industry” describes technical, environmental and economic reasons to consider reclaimed asphalt a valuable and profitable resource for the road sector. Firstly, the chapter provides a snapshot of the road construction market by analysing the most recent data about asphalt production, bitumen consumption, and availability of RAP in Europe. Figures show a relationship between the increased cost of natural resources i.e. neat bitumen and the use of reclaimed asphalt. Environmental and economic advantages are analysed and discussed in detail. Secondly, the chapter reviews all most common methods to incorporate RAP in hot-in-plant productions both in batch and drum plants. Factors that limit the use of RAP in batch and drum plants are presented together with the technological improvements that can increase the amount of RAP being incorporated into new mixes, e.g. parallel drum and double dryer. Examples of best practices of RAP recycling are also given in the final part of the chapter
Chapter 3 “Review of laboratory testing on asphalt mixtures” and chapter 4 “Review of laboratory testing on bitumen” give a very detailed description of laboratory test methods thanks to the more than 6 years’ experience of the Author in laboratory testing on road materials. Both chapters describe the objectives and procedures of each test accordingly to European standard references and they provide a practical guide to critically understand test results and to identify possible drawbacks in testing procedures. Laboratory testing are an essential tool to collect information about physical and mechanical properties of materials. Reliability and
6
soundness of test results are of primary importance in order to attain reasonable conclusions. Also, chapters 3 and 4 present examples of test parameter values for different types of road materials. For example, for different classes of pen grade bitumens, values of penetration at 25°C, softening point, viscosity at 160°C, penetration index and Fraass point are reported accordingly to European standards and most important technical specifications
Chapter 5 “Experimental programme” describes the experimental part of the research of extensive laboratory testing on asphalt mixes and on recovered bitumen. The first part presents testing activity on asphalt mixtures that include: sampling and characterization of raw materials, mix design of RAP mixtures with different percentages of incorporated RAP, production of prismatic asphalt samples, fatigue testing with four-point bending device. The second part presents testing activity on bitumen samples that have been recovered from asphalt samples previously tested to fatigue. Bituminous samples were characterized with both standard tests, as penetration at 25°C and softening point, and rheological tests, which were performed using a rotational viscometer and a dynamic shear rheometer
Results of the laboratory testing activity presented in the “Experimental programme” are reported in chapter 6 “Results and discussion”. The chapter reports the results of fatigue testing on asphalt mixes, with data being processed both with traditional Wöhler and energetic approaches, and results of tests on bituminous samples. Test results are used to deduct the influence of RAP on the investigated mixture
All the most relevant considerations from previous chapter are collected in the final chapter 7 “Conclusions”, which is a clear and concise summary of research objectives, methods and findings
1.7 Literature review
In this section, a quick and easy-to-use literature review is reported with regards to the following RAP issues:
Interaction between RAP and virgin bitumen Mix design of RAP mixes
RAP content thresholds Performances and durability
The literature review collects the most important and recent findings that are commonly accepted and recognized by the scientific community about reclaimed asphalt. Also, it provides the necessary background for the research project presented in this thesis.
1.7.1 Interaction between RAP and virgin bitumen
a. A limited number of studies have investigated the blending process between aged and virgin asphalt binders [9] [10] [11]. In NCHRP 9-12, McDaniel et al. define three possible levels of interaction between aged and virgin binders were compared
7
experimentally: black rock i.e. no blending, total blending i.e. 100% blending and actual practice i.e. blending as it usually occurs in practice
b. One major factor that is still unclear is the level of interaction between aged and virgin asphalt binders [9]. If RAP acts like a black rock, the aged and virgin binders will not interact. Hence, it would be assumed that RAP does not significantly change the virgin binder properties. However, it is usually assumed that RAP does not act as a black rock and that the aged asphalt blends with the virgin binder during mixing [12]. This means that the amount of virgin asphalt binder can be reduced by the full amount of asphalt binder in the RAP for the percentage specified [9]
c. The level of blending between RAP and neat bitumen occurring in asphalt mixes after mixing operations was investigated by Huang et al. [4]. The laboratory experiment consisted in staged extractions aimed to obtain bitumen from various layers coating the RAP aggregates. Results indicated that after blending, outside layers of asphalt binder around RAP aggregates were much softer than the inside layers of binder. In terms of percentages, about 60% of the aged binder did not blend with the virgin binder while 40% of the outside binder was a blend between aged and virgin binders. Although the authors cautioned that the mixtures used in that study do not reflect common HMA normally used in practice, it was evident that the level of contribution of the residual asphalt binder should be something substantially lower than the usually assumed 100%. Hence, it is clear that the appropriate amount of the RAP aged binder that effectively contributes to RAP mix needs to be further investigated [9]
d. An old RAP bitumen has increased viscosity and stiffness relative to the same neat bitumen. During its service life, bitumen reacts and loses some of its components due to oxidation, volatilization, polymerization, thixotropy, syneresis and separation. Because of the aging process, the rheological behaviour of bitumen will naturally differ from virgin materials. This suggests the importance of controlling the blending process between recycled and virgin bitumens. If the old binder is too stiff or too viscous, the blend of old and virgin bitumens may not perform as expected resulting in a poor quality RAP mixture
1.7.2 Mix design of mixtures incorporating RAP
Detailed guidelines for mix design of RAP mixtures are given in NCHRP reports 452 and 752 [13] [14]. A summary of most relevant conclusions is reported below.
a. The RAP content is usually expressed as percentage of mass of aggregate in the mixture
b. The weight of the binder in the RAP must be accounted for when batching aggregates. For example, when measuring the mass of a RAP fraction being incorporated into a new mix, the mass of RAP bitumen shall be considered apart from
8
the mass of RAP aggregate: the former contributes to the bitumen content, the latter contributes to mix grading
c. The RAP aggregate is treated like another stockpile for blending and weighing, but must be heated gently to avoid changing the RAP binder properties. Guidelines in NCHRP-452 suggest to dry RAP at 110°C for not more than 2 hours
d. The total asphalt content is reduced to compensate for the binder provided by the RAP. The higher the RAP content, the larger the amount of virgin bitumen that can be saved
e. If total blending between neat and RAP bitumen is assumed, the RAP grading curve to be used in the mix design shall be determined from the extracted material
f. A change in virgin binder grade may be needed depending on the amount of RAP, desired final binder grade, and RAP binder stiffness
g. For RAP contents below 15 percent, the virgin binder grade should be the same as for a virgin mix. For intermediate RAP contents between 15 and 25 percent, the virgin binder should be one full grade lower than for a virgin mix. For RAP contents above 25 percent, blending charts or equations should be used to determine the appropriate virgin binder grade
1.7.3 RAP content thresholds
a. At small RAP percentages, generally 10-20% depending on the mix, an aged binder does not significantly affect the properties of the blend of virgin and RAP binder. When used at intermediate to higher percentages, a RAP bitumen can significantly influence the properties of the blend and may affect the resultant bitumen grade [10] [15].
b. RAP contains asphalt binder that has been aged. Because of this fact there has been a concern that incorporating higher RAP contents into HMA may lead to mixtures that are high in stiffness and accordingly may be prone to failures in the field [5]. In an attempt to mitigate this stiffness increase, state transportation agency specifications have suggested/recommended the use of a softer binder when RAP is used in high percentages (typically above 15-20%). If good blending occurs between the softer and RAP binder, the resultant binder in the mixture should have compatible properties to the typical specified asphalt binder used at low or zero percent RAP contents.
c. A study conducted by McDaniel and reported in NCHRP 9-12 concludes that there is no statistical difference between the values for 0% and 10% RAP. This would indicate that up to 10% of RAP may be added with no statistical effect on the performance of the mix
9
d. RAP mixes are generally divided into low, intermediate and high RAP content on the basis of RAP incorporated into the mix. Percentages are reported below:
RAP content mix by mass of aggregate Percentage of RAP in the
Low 0-15%
Intermediate 15-25%
High >25%
1.7.4 Performances and durability
Laboratory and field studies conducted to investigate performances of RAP mixtures agree to recognize the stiffening effect of incorporating RAP into a new asphalt mix. Nevertheless, many researches show that the effects of RAP on durability of mixes may be both positive and negative. a. Numerous studies on RAP have indicated that addition of RAP to an asphalt mixture changes the physical behaviour of the mix. The increased stiffness of the RAP binder is believed to be the cause of increased modulus of asphalt mixture mixes [16] b. The NCHRP 9-12 study on RAP mixes concludes that, at low RAP content, the
properties of RAP mixture are not significantly different from those with no RAP [10]. However, at higher RAP contents, the indirect tensile test results and beam fatigue testing indicated increase in stiffness which would lead to cracking if no adjustments in mix design are made
c. NCHRP 9-46 study by West et al. [14] evaluated the use of 55% RAP mixes and showed that stiffness as measured by dynamic modulus at different temperatures and frequencies increased by 25-60% compared with virgin mixtures. The research also concluded that fracture energy, which is an indicator of fatigue cracking, was better for virgin mixes compared with high RAP mixtures. The study of long-term pavement performance (LTPP) for overlays of 20 years and 30% RAP content showed that fatigue, longitudinal and transverse cracking are the distresses that occur more often in RAP mixtures [14]. The study concluded that generally mixtures containing RAP performed better than or equal to virgin pavements for majority of the cases [2]
d. Testing conducted for the NCHRP 9-12 study confirmed that recycled mixtures with a RAP content greater than 20% have a lower fatigue life than virgin mixtures [10]. Decreasing the virgin binder grade may be an option to improve the mixture fatigue performance, especially at high RAP content [9]
e. To evaluate and compare fatigue performance of HMA with RAP, Shu et al. [17] prepared four asphalt mixtures consisting of 0, 10, 20, and 30% RAP with one source of aggregate and one type of binder. The fatigue properties tested included indirect tensile strength (ITS), failure strain, toughness index, resilient modulus, dissipated
10
creep strain energy (DCSEf), energy ratio, plateau value, and load cycles to failure.
They observed that:
i. Inclusions of RAP into asphalt mixes generally increased tensile strength and reduced post-failure tenacity in indirect tensile strength tests
ii. The inclusion of RAP also generally decreased the DCSEf threshold and
energy ratio calculated from IDT tests, which may result in the short fatigue life of HMA. Lower DCSEf values mean that the energy required to fracture the asphalt mix mixtures decreased as RAP percentage increased
iii. Based on the failure criterion of 50% reduction in stiffness (obtained from the beam fatigue test), incorporation of RAP increased the fatigue life of asphalt mixes, whereas based on plateau values from the beam fatigue test, inclusion of RAP would turn more input energy into damage, which may result in the shorter fatigue life
Two points are also present but not discussed in the study: results show an increase in the resilient modulus that indicates an increased stiffness of the mixtures with RAP content being increased. Furthermore, inconsistency between energetic and traditional fatigue approach suggest that
f. Huang et al. [4] evaluated fatigue resistance of a typical surface mixture commonly used in Tennessee at 0, 10, 20, and 30% RAP content. Fatigue characteristics of mixtures were evaluated with the indirect tensile strength test, semi-circular bending (SCB) test, semi-circular fatigue test, and semi-circular notched specimen fracture test. They found that
i. Long-term aging influenced the ranking of fatigue characteristics for mixtures containing different percentages of RAP
ii. Inclusion of RAP into the limestone surface mixture generally increased tensile strength, reduced post-failure tenacity, increased the mixture’s modulus (stiffness), and reduced viscosity characteristics.
iii. In the study, total dissipated energy to failure at 20% of SCB tensile strength also indicated that inclusion of RAP generally increased fatigue life for unaged mixtures, whereas for long-term aged mixtures, dissipated energy increased with inclusion of 20% RAP and dropped to the same level as the mix without RAP
iv. The inclusion of RAP in the mixtures improved the mixtures’ resistance to fracture failure. The inclusion of less than 20% of RAP material had very limited influence on mixture stiffness and indirect tensile strength characteristics. The inclusion of a high percentage (30%) of RAP tended to significantly change the mixtures’ fatigue cracking characteristics
11
g. The distresses in high RAP mixtures are mostly associated with the aged binder [18]. The stiff, less elastic binder in RAP typically increases mixture stiffness and can cause fatigue damage and low temperature brittleness. Other potential problems are associated with the unknown amount of actual blending that occurs between virgin and RAP asphalt binders and the effective contribution of the RAP binder towards the total binder content of the mix (often referred to as “black rock”) [2]. These are some of the main reasons for reluctance for government agencies to allow high RAP content
h. The addition of RAP to an asphalt mix may decrease the mixture workability as compared to the respective control mixture without RAP due to the high viscosity of RAP bitumen. The workability reductions were generally larger at higher RAP contents. It is common belief that the use of a softer binder could improve the workability of RAP mixtures [5].
13
2 Use of RAP in pavement industry
2.1 Infrastructures and developmentInfrastructure is a heterogeneous term that includes physical structures of various types used by many industries as inputs to the production of goods and services [19].
Infrastructures can be distinguished into economic or social. Economic infrastructures (EOC, Economic Overhead Capital) are primarily oriented toward the support of productive activities or toward the movement of economic goods. Social infrastructures (SOC, Social Overhead Capital) may also increase productivity but in a less direct way than in the case of EOC. Roads, highways, railways, airports, maritime transport, waste pipelines, aqueducts, gas pipelines, power networks are all economic infrastructures, and they directly support productive activities. Schools, police stations, hospitals, sport facilities, green areas and rest homes are social infrastructures, and they’re aimed to increase social wealth with indirect positive impact on productivity.
Road networks have a decisive impact on the economic development of an area. The impact is measured in terms of income, productivity and employment with reference to the specific area [20]. Aschauer (1989) says that “a region with adequate presence of infrastructures has a comparative advantage over another region fairly served by infrastructures. The larger the infrastructural assets, the higher the economic advantages of the area”. Thus, economic development of a region is highly related to the quantity and quality of its assets.
2.2 Factors impacting demand for road infrastructures
Roads are fundamental assets for economic and social development of an area, and hence of a country. So why road industry is struggling in some European countries, especially in Italy?
Argus [21] lists some of the most impacting factors that contributes to road development: Economy
Government budgets for roads Credit
Natural disasters and unplanned events e.g. acts of terrorism and accidents may also play a role. Some other less explicit and evident factors as corruption and constant decrease in valued added of the construction sector negatively affect the development of roads.
2.2.1 Economy
Economic growth contributes to the need for roads and for the demand for roads. Under conditions of economic growth, the mobility demand for people and goods increases together with the need of efficient roads and the financial resources of public administrations. Therefore,
14
economy has a strong influence on public investments for strategic assets, as road and highways, both in negative and positive ways.
GDP growth provides a peek into the future, forecasting which markets will potentially have asphalt requirement, potential changes in balances for individual countries and changes in the trade patterns [21]. Economy growth leads to a larger number of roads being constructed.
Global economic prospects have improved following the drop in world GDP by -0.4% in 2009. In 2013, world GDP growth was 3%, down from previous 3 years. World growth is projected to increase 3% to 5% in next years. Advanced economies fell to -3.4% in 2009, bounced back to 3% in 2010 and then slowed in 2011 and again in 2012. Euro area had the slowest in 2013, whereas newly industrialized Asian economies led the pack in recovery in the same year. GDP growth of emerging and developing economies was 3.1% in 2009, increased to 4.7% in 2013. Middle East, North Africa and Sub-Saharan Africa weathered global recession well, however North Africa continues struggling with difficult internal transition.
Fig. 2.1: Gross Domestic Product (GDP) growth of different economies
An example of the relationship between GDP and production of asphalt mixture (hot and warm) is discussed for the Italian case. The trend of GDP and asphalt production in the period 2008-2014 is illustrated in Fig. 2.2, showing a strong correlation between asphalt production and economic growth. The Italian GDP has significantly dropped down in 2008, reducing from 2,392 billion USD to 2186 billion USD, and in 2011, from 2,278 to 2,075 billion of USD. The production of asphalt mixtures follows a similar but more constant trend over the same period, with a global decrease of 39% in 7 years.
Data show a strong correlation between economic growth and production of asphalt. Negative variations of GDP lead to decreasing asphalt production as a consequence of decreased demand for new roads or maintenance works.
15
Fig. 2.2: plot of asphalt production and GDP in Italy in 2008-2014
2.2.2 Public capital
Public capital has a decisive role in the economic growth of core infrastructures of a country as roads, highways and airports [22]. However, government intervention exposes infrastructure investment to an additional layer of risks and decision-making biases [23]:
a. Political risks, reflecting the inability of the political system to deliver cross-party consensus around strategic plans for infrastructure and stable policy frameworks to support their implementation
b. Analytical risks, reflecting the dual relationship between the prevailing political ideology and economic mainstream
c. Unbiased project appraisal, reflecting the deficit in project evaluation grounded in sound and independent expert analysis and comprehensive assessment of policy alternatives
d. Limitations of the planning system and compensation mechanisms, reflecting a current planning system that does not properly share the asymmetric benefits of development
e. Public accounting distortions, reflecting practices that fail to incorporate the value of public sector assets and concentrate solely on public sector debt
2.2.3 Credit
Infrastructure suffers from a series of market failures that impede the optimal level of investment from being reached [23]. What usually sets investment in infrastructure apart from
500 1000 1500 2000 2500 3000 10 15 20 25 30 35 40 45 50 GDP (USD billions) Tota l p roduc tion of hot and w arm mix a spha lt in Italy , 2008-2014 (million of tonnes)
Asphalt production, Italy GDP, Italy Linear (Asphalt production, Italy) Linear (GDP, Italy)
16
other types of investment is its long-term, capital intensive that typically generates long-lived assets with high sunk costs. This creates a gulf between (short term) marginal and (long term) average costs, which in turn, creates a time-inconsistency problem. However, investing wisely in infrastructure is critically important as over-investment can lead to projects that are inefficiently large, and therefore have low marginal returns.
2.2.4 Corruption
Unfortunately, a significant part of the public capital addressed to road construction is drained by corruption, resulting in the worst use being made for public funds. The last point of the list above can be related to corruption phenomena that are sadly a plague especially in Italy. The majority of corruption can be found on infrastructure public tenders [24]. In 2011, public contracts for infrastructures and services contributed to Italian GDP for 15.9%. The total value of public tenders was 18.3% of public contracts in the same year. 14% of public tenders were assigned without any tender notice, increasing the risk of fraudulent behaviours and corruption.
Alteration to public tenders may be pursued in different ways: tailor-making of technical documentations with the precise aim to favour specific companies; abuse of negotiate procedures. In some cases, public tenders may be by-passed with direct negotiations between public authority and companies. The abuse consists in an unnecessary use of this solution instead of public tenders, again with the aim to favour some companies; conflict of interest causes alteration of public contracts as well. Typically, the employer i.e. a public official (ab)uses of his position to pursue a private economic interests; agreement in public tenders between the two parts; definition of ambiguous evaluation and selection criteria in documentation; participation of tenderers in writing technical specifications; abuse of urgency reasons to by-pass public tenders.
Corruption strikes mostly during the post-tender phases of road construction. In particular, the quality control process is highly vulnerable since it involves raw materials, which are the biggest part of direct cost of road construction (including transportation) [25]. In this phase, illegal practices are able to produce the greater margins for illicit profits. An example: suppose the bitumen content of an asphalt mixtures is 5%. The production plant may decide to produce the material with 4% of bitumen content and sell it as an asphalt mixture with 5% bitumen content, with a profit on the 1% of bitumen saved. Furtherly, the testing laboratory, which provides the quality control on materials, may give in to the pressure of the plant, or other involved subjects, for certifying 5% bitumen instead of 4%. Laboratory may also grab a part of the profit that results from bitumen saving. However, the result is a material poor in bitumen that will probably fail before expectances and hence will require extraordinary maintenance paid by taxpayers. Sometimes these practices, despite fraudulent and illegal, are used by companies as survival strategies aimed to overcome increased prices and hence reduced margins. Nevertheless, this attitude negatively affects road construction, but it has its roots on the low valued added of construction industry instead on corruption itself.
![Fig. 2.6: comparison of Europe area and United States production of hot and warm mix asphalt from 2008 to 2014 [8] 7.2 5.2 2.3 6.4 3.7 1.3 4.7 31.9 39.0 2.7 3.8 0.3 1.8 22.3 0.6 1.3 0.7 9.0 7.0 18.2 6.4 4.5 1.5 1.4 14.5 8.5 6.5 30.9 20.605101520253035404](https://thumb-eu.123doks.com/thumbv2/123dokorg/8136542.125961/50.892.130.768.622.1060/fig-comparison-europe-area-united-states-production-asphalt.webp)