Clinical Practice: Consensus Statement
Nephron 2017;136:3–49DOI: 10.1159/000457967
The Impact of Kidney
Development on the Life Course:
A Consensus Document for Action
The Low Birth Weight and Nephron Number Working Group
and a review of the literature. They highlight the need to act early to prevent CKD and other related noncommunicable diseases later in life by reducing low birth weight, small for gestational age, prematurity, and low nephron numbers at birth through coordinated interventions. Meeting the cur-rent unmet needs would help to define the most cost-effec-tive strategies and to optimize interventions to limit or inter-rupt the developmental programming cycle of CKD later in life, especially in the poorest part of the world.
© 2017 The Author(s) Published by S. Karger AG, Basel
Preface
This consensus document aims to address the rela-tively neglected issue of the developmental program-ming of hypertension and chronic kidney disease (CKD). It emerged from a workshop, entitled The Fault Is Not in Our Stars but May Be in Our Embryos – Glomerular Number in Low Birth Weight Babies, held at the Clinical Research Center for Rare Diseases Aldo e Cele Daccò, IRCCS – Mario Negri Institute for Pharmacological Re-search, Bergamo, Italy, on April 2, 2016, including emi-nent internationally recognized experts in the field of
Keywords
Low birth weight · Nephron number · Intrauterine growth restriction · Small for gestational age · Preterm birth · Programmed risk of hypertension · Programmed risk of kidney disease · Maternal nutrition · Infant and child nutrition · Neonatal acute kidney injury
Abstract
Hypertension and chronic kidney disease (CKD) have a sig-nificant impact on global morbidity and mortality. The Low Birth Weight and Nephron Number Working Group has pre-pared a consensus document aimed to address the relative-ly neglected issue for the developmental programming of hypertension and CKD. It emerged from a workshop held on April 2, 2016, including eminent internationally recognized experts in the field of obstetrics, neonatology, and nephrol-ogy. Through multidisciplinary engagement, the goal of the workshop was to highlight the association between fetal and childhood development and an increased risk of adult diseases, focusing on hypertension and CKD, and to suggest possible practical solutions for the future. The recommenda-tions for action of the consensus workshop are the results of combined clinical experience, shared research expertise,
Published online: March 21, 2017
Prof. Giuseppe Remuzzi
IRCCS – Istituto di Ricerche Farmacologiche Mario Negri
Centro Anna Maria Astori, Science and Technology Park Kilometro Rosso Via Stezzano 87, IT–24126 Bergamo (Italy)
E-Mail giuseppe.remuzzi @ marionegri.it
Participants of the Low Birth Weight and Nephron Number Working Group are listed in the Appendix.
obstetrics, neonatology, and nephrology (see Appen-dix). The goal of the workshop through multidisci-plinary engagement was to highlight the association be-tween fetal and childhood development and an increased risk of adult diseases, focusing on hypertension and CKD, and to suggest possible practical solutions for the future. Low birth weight (LBW), growth restriction, and preterm birth are the most consistent clinical surrogates for low nephron numbers and are associated with an in-creased risk of hypertension, proteinuria, and kidney disease later in life. This relationship is amplified by the development of acute kidney injury (AKI) in preterm infants, which may further reduce nephron numbers soon after birth, as well as by rapid catch-up growth or overfeeding during infancy or childhood in children born small, which may further augment the risk of hy-pertension and CKD and predispose to obesity and type 2 diabetes later in life. Many questions about the devel-opmental origins of chronic renal disease, possible nu-tritional and pharmacologic interventions, as well as strategies for optimal follow-up and management of vascular, metabolic, and renal functions remain unan-swered. The working group has discussed in depth how to raise awareness about developmental programming and renal disease risk later in life, and practical, locally adaptable preemptive strategies were suggested that could have long-term benefits in terms of future kidney health and cost saving worldwide. The discussion ended with the consensus recommendations presented here. This document is well aligned with the recent emphasis on a “life course” approach outlined by the World Health Organization (WHO) in the Minsk Declaration and the Global Action Plan for the Prevention and Control of Noncommunicable Diseases (NCD) [1, 2] . In both doc-uments, the need to begin to prevent later-life chronic disease even before conception is emphasized, but spe-cific recommendations beyond general nutritional in-terventions have not yet been made [3] . In turn, the life course approach aligns with the targets proposed by the United Nations 2030 Agenda for Sustainable Develop-ment, where a much broader approach is advocated to maintain health, and many goals are highly relevant to renal development and kidney disease [4] .
Introduction to a Health Problem
The Global Burden of NCD
The WHO endorsed the Global NCD Action Plan in 2008 in response to growing recognition that NCD have
replaced communicable diseases as the predominant causes of premature mortality worldwide [2] . Neverthe-less, the global burden of NCD has been relatively ne-glected by policy makers, major aid donors, and academ-ics until recently, given the global push to address com-municable diseases over the past decade which diverted funds from NCD [5] . The NCD Action Plan aims to re-duce premature mortality from cardiovascular disease (CVD), diabetes, cancer, and chronic lung disease by 25% by 2020 and emphasizes prevention as a crucial strategy to reduce NCD [2] . A “life course approach” is suggested as 1 of 9 overarching approaches for the prevention of NCD and has been highlighted in the recent Minsk Dec-laration, reflecting the increasing realization that early development is a determinant of later-life health and dis-ease [1, 2] . Optimizing early development provides the chance for true primary prevention of NCD with major potential multiplier effects on overall health and well-being throughout life [4] .
The worldwide prevalence of chronic diseases is pro-jected to increase substantially over the next few decades [6] . For example, according to the International Diabetes Federation, the worldwide prevalence of diabetes is pre-dicted to rise from 415 to 642 million between 2015 and 2040 [7] . In addition, by 2025, more than 75% of the world’s diabetic population will reside in low- and mid-dle-income countries (LMIC) [8] . Similarly, the preva-lence of ischemic heart disease has almost doubled glob-ally between 1990 and 2013 [9] . Although age-standard-ized mortality rates attributed to NCD have fallen worldwide, NCD remain the leading cause of death in the world, as shown by the 42% increase in the number of NCD-related deaths from 27 to 39.8 million between 1990 and 2015 [10] . Thus, the social, economic, and pub-lic health consequences of the expected increase in most NCD could have devastating consequences especially for LMIC.
CKD: A Global Health Problem
CKD is a key determinant of poor health outcomes for major NCD and has a risk-multiplier effect on CVD [11] . Recent findings from the Global Burden of Disease Study have highlighted CKD as an important cause of global mortality [10] . The number of reported deaths due to CKD was estimated to be 1.2 million, a 32% increase from 2005, with deaths from diabetic and hypertensive kidney disease comprising over 75% of these deaths [10] . The prevalence of end-stage kidney disease (ESKD) patients receiving renal replacement therapy (RRT) with mainte-nance dialysis has increased 1.7 times from 165 patients
per million population in 1990 to 284 patients per million population worldwide in 2010 [12] . The number of peo-ple who will receive RRT (dialysis or transplantation) worldwide has been projected to more than double from 2.6 to 5.4 million from 2010 to 2030 [13] . Notably, it has been estimated that between 2.3 and 7.1 million people who could have been kept alive with RRT in 2010 died prematurely because they did not have access to the treat-ment [13] . Most of these deaths occurred in Asia, Africa, and Latin America, where RRT remains unaffordable [11] . With a population that is aging, steep increases in the worldwide incidence of type 2 diabetes mellitus and hypertension are driving the growth in the CKD burden, putting an enormous pressure on health care resources [11] . ESKD is only the tip of the iceberg. CKD occurs in approximately 10% of the population [11] . While the true prevalence of CKD in many LMIC countries remains ill defined [14] , in industrialized countries CKD affects more disadvantaged populations and ethnic minorities and, therefore, causes a disproportionate burden on the poor [11] . Kidney disease is, therefore, a global public health priority. Given the very high individual and soci-etal costs of treatment, prevention is the most effective strategy to sustainably address the growing global burden of kidney disease.
Developmental Programming of Chronic Diseases The large individual variability in susceptibility to kid-ney disease and other NCD remains unexplained. Genet-ic predisposition and environmental exposures are con-tributory factors, but increasingly it is being recognized that fetal development is also an important modulator of the NCD risk. The quality and quantity of nutrition re-ceived during fetal life, exposure to pollutants, drugs, and infections during gestation, as well as the mother’s health while she is pregnant, all impact fetal kidney development [15] . Perinatal exposures and nutrition as well as early childhood growth are also important. Since the first ob-servations that adults who were born with LBW (defined as a birth weight <2.5 kg) were at a higher risk of prema-ture cardiovascular death, increasingly compelling epide-miologic and experimental evidence has highlighted the “programming” impact of intrauterine and early child-hood stresses on organ development and long-term or-gan functions [16, 17] . LBW, growth restriction, and pre-term birth (defined in Table 1 ) have been the most acces-sible surrogate markers for intrauterine stress so far.
Although programming associations between LBW, growth restriction, preterm birth, and hypertension have been studied the most, evidence pointing to associations between LBW and CKD, CVD, obesity, glucose intoler-ance, type 2 diabetes, and preeclampsia is also quite
Table 1. Definitions of birth weight categories and preterm birth
Category Definition
Birth weight categories
Normal birth weight >2,500 and <4,000 g (usually)
Large for gestational age >2 SD above the mean birth weight for gestational age Low birth weight <2,500 g
Very low birth weight <1,500 g
Appropriate for gestational age ±2 SD of the mean birth weight for gestational age Small for gestational age >2 SD below the mean birth weight for gestational age
Intrauterine growth restriction Evidence of fetal malnutrition and growth restriction at any time during gestation
Gestational categories
Extremely preterm <28 weeks’ gestation Very preterm <32 and >28 weeks’ gestation Moderately preterm <34 and >32 weeks’ gestation Late preterm <37 and >34 weeks’ gestation Full term >37 weeks’ gestation
Term fetal macrosomia implies fetal growth beyond a specific weight, usually 4.0 or 4.5 kg, regardless of fetal gestational age [18, 19]. In this document, we use the term “growth restriction” to refer to both SGA and IUGR [reprinted with permission from 20].
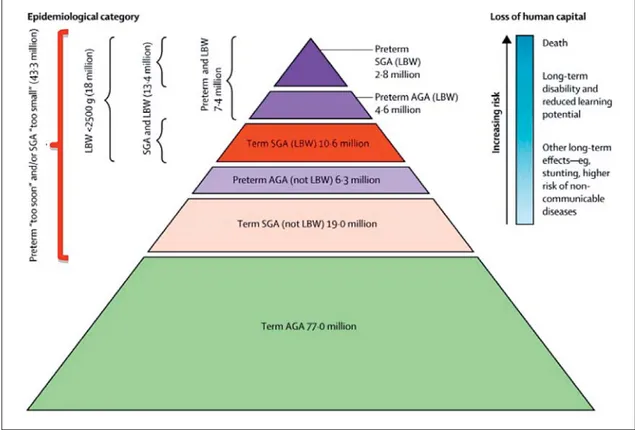
vincing [16, 17, 21–25] . Until recently, research has largely focused on LBW and preterm birth as markers for developmental programming of hypertension and renal disease, but high birth weight (HBW), often as a result of a diabetic pregnancy or maternal obesity, is also emerg-ing as a risk factor [18, 26, 27] . It is important to recog-nize that many babies who are born yearly with birth weights above 2.5 kg (technically not LBW) still expe-rienced intrauterine growth restriction (IUGR) and may be inappropriately small for gestational age (SGA) ( Fig. 1 ).
In addition, preterm infants may also have either an appropriate, although low, birth weight for gestational age (AGA) or may be SGA if they experienced superim-posed growth restriction ( Fig. 1 ). Such growth restriction per se is also associated with programming effects in the kidney, emphasizing the continuum of the programming risk and the need for heightened awareness of this risk
[29–32] . Worldwide, the incidence rates of LBW and pre-term birth lie at around 15–20% and 11%, respectively [33, 34] . There is, however, significant overlap between LBW, preterm birth, and SGA, with the total reaching around 36% of live births in LMIC in 2010 [28] . Globally, the incidence of HBW is increasing, ranging from 5 to 20%, with many infants probably exposed to maternal di-abetes or obesity [18] . Therefore, many infants born every year likely undergo developmental programming, which may be the first in a succession of “hits” that ultimately manifest in overt disease. Consequently, the population impact of developmental programming may be consider-able. For example, a population-based study in the US found that of every 13 adolescents born with LBW, or 5 with very low birth weight (VLBW), 1 had elevated sys-tolic blood pressure and 1 had a reduced glomerular fil-tration rate (GFR) [35] . These numbers would be expect-ed to increase as subjects age.
Fig. 1. Number of infants born small for gestational age (SGA) or with low birth weight (LBW), and premature birth in low- and middle-income countries – 2010 (reprinted with permission according to CC Creative Com-mons Attribution-NonCommercial-noDerivs from Lee et al. [28] ). A large number of infants born at term and SGA do not meet the definition of LBW and, therefore, likely experienced programming but may not be identi-fied as at risk.
The Low Nephron Number Hypothesis
Under normal developmental conditions, nephrogen-esis continues until the 36th week of gestation in utero, and no new nephrons develop following birth in full-term infants [36] .
Building on early epidemiologic evidence linking LBW and adult CVD, Brenner et al. [37] hypothesized that de-velopmental programming in the kidney may result in a reduction in nephron number, which in turn may be a fac-tor contributing to higher blood pressure and increased risk of CKD. The authors hypothesized that a reduction in whole kidney glomerular surface area resulting from a pro-grammed reduction in nephron number would enhance susceptibility to hypertension by limiting sodium (salt) ex-cretory capacity and increase susceptibility to CKD through a reduced capacity to compensate for renal injury. Consis-tent with this possibility, LBW, hypertension, and CKD, all tend to occur more frequently in poorer populations [38– 42] . In animal studies early on, feeding pregnant rats a low-protein diet induced LBW in the offspring, which sub-sequently developed spontaneous hypertension that in-creased with age, chronic renal injury, and premature death [43–45] . The rat offspring also had smaller kidneys and reduced nephron numbers, which strongly supports the nephron number hypothesis. Although the magnitude of programming effects observed often differs between males and females [46] and between experimental condi-tions, many diverse animal studies also strongly support the association between adverse intrauterine conditions and a higher risk of hypertension and renal dysfunction with age, as reviewed elsewhere [47, 48] .
Nephron Numbers in Humans
The inability to determine nephron number in living humans has been a major obstacle to definitively inves-tigating the nephron number hypothesis. To date, all nephron-counting studies have been performed on au-topsy samples. From 7 studies with nearly 500 subjects, we know that the average nephron number is ∼ 1,000,000 per kidney [49–54] . Human nephron number is highly variable, however, ranging from 210,000 to1 2.7 million [53] . This 13-fold variability likely contributes to indi-vidual susceptibility to hypertension and kidney disease [51, 52, 55] . Significant variability is already present at birth, highlighting the importance of early nephrogene-sis [56, 57] . Nearly 60% of nephrons are developed in the third trimester of pregnancy [58] . In preterm infants, nephrogenesis may occur for up to 40 days after birth, but may be abnormal [57, 58] . Nephron numbers have been found to be reduced in infants who were born pre-term or of LBW [58–61] . Importantly, however, it has been observed in some animal models that low nephron numbers may also occur with normal birth weight, so the burden or risk of renal programming may be underesti-mated if birth weight is the only surrogate marker con-sidered [62] . Over time, nephron numbers decline due to age-related glomerulosclerosis and obsolescence, and thus age is also an important risk modifier of the pro-grammed renal risk [51, 63, 64] . Further clinical surro-gates associated with reduced nephron numbers in hu-mans include adult height, female gender, Australian Aboriginal ethnicity, and maternal vitamin A deficiency [65, 66] ( Table 2 ).
Table 2. Clinical associations with low nephron numbers [reproduced with permission from 67]
Clinical feature Association with nephron number Population Reference
Low birth weight ↑ of 257,426 glomeruli per kilogram increase in birth weight
USA white and black, children and adults 60 Prematurity ↓ glomerular number in preterm vs. term
infants
US premature and full-term neonates 58, 59 Gender Nephron number is 12% lower in females USA white and black, Aboriginal Australian 66 Age ↓ 3,676 glomeruli per kidney per year of age
>18 years
USA white and black, Aboriginal Australian 66 Adult height ↑ 28,000 glomeruli per centimeter increase in
height
Aboriginal Australian, German, white 52, 66 Kidney mass ↑ 23,459 glomeruli per gram of kidney
tissue
Infants <3 months of age 68 Glomerular volume Inverse correlation between glomerular volume
and nephron number
US white and black, Aboriginal Australian, German adults, Cuban infants
52, 55, 61 Ethnicity ↓ Aboriginal Australian vs. US white and black US white and black, Aboriginal Australian 66
Nephron numbers have been shown to correlate with kidney weight, so renal mass has also been used as a sur-rogate marker for nephron numbers, although this rela-tionship may be confounded by renal hypertrophy [51, 68, 69] . In all studies, glomerular numbers correlate in-versely with glomerular volume, largely independent of gender and race, potentially reflecting compensatory glo-merular hyperfiltration [55, 61, 70] . Therefore, glomeru-lar volume has also been proposed as a surrogate marker for reduced nephron numbers in the absence of other causes. A promising innovative method for nephron enu-meration is the use of cationic ferritin as an MRI-detect-able contrast agent, which highlights the glomerular base-ment membrane of each nephron [71–74] . This contrast allows for the quantification of all glomeruli in a nonde-structive manner and may potentially be useful in vivo. A more definitive quantification of nephron numbers in real time would permit more comprehensive and larger-scale studies of the relationship between nephron num-ber, clinical parameters, and the risk of hypertension and renal disease.
Nephron numbers increase in proportion to birth weight and gestational age [60] . Importantly, there is no known discrete threshold above which a nephron num-ber is “high enough”; nephron numnum-bers occur along a continuum in the population, as does disease risk. It is likely, however, that individuals with nephron numbers on the lower side of the spectrum are those at higher risk of hypertension and kidney disease [52] . The relationship between an individual’s body size (metabolic demand) and nephron numbers is probably an important modula-tor of this risk [75] . Superimposed renal “hits” or other risk modifiers, therefore, likely determine the phenotypic expression of disease along the spectrum of nephron number. It is clear that better biomarkers for the early de-tection of renal structural changes are needed to help pre-dict which LBW, SGA, or preterm infant will develop hypertension and CKD.
Developmental Programming of Hypertension and Kidney Disease
Programmed Associations with Blood Pressure LBW and preterm birth are both associated with an increased risk of elevated blood pressure in later life. Me-ta-analyses have shown that systolic blood pressure levels were higher in preterm or VLBW adolescents than in controls born at term (mean increase of 2.5 mm Hg; 95% confidence interval, CI, 1.7–3.3 mm Hg from 10 studies) and in subjects with birth weights <2.5 kg compared with ≥ 2.5 kg (mean increase 2.28 mm Hg; 95% CI, 1.24–3.33
from 9 studies). In the latter study, the odds ratio (OR) of overt hypertension was 1.21 (95% CI, 1.13–1.3) for those with birth weights <2.5 kg compared with ≥ 2.5 kg [22] . A systematic review of the impact of HBW on blood pres-sure, however, also found a risk ratio of 1.18 (95% CI, 1.05–1.32 from 6 studies) for hypertension in children who had birth weights ≥ 4 kg compared with birth weights <4 kg, but this effect did not persist in adults [27] . In a further meta-analysis of 13 studies including 1,115 chil-dren aged 2–20 years exposed to diabetes during gesta-tion, systolic blood pressure levels were found to be high-er compared to controls (mean diffhigh-erence 1.88 mm Hg; 95% CI, 0.47–3.28); however, this effect appeared to pre-dominate in males [76] . Similarly, a systematic review found that systolic blood pressure levels were 2.39 mm Hg (95% CI, 1.74–3.05 from 18 studies) higher among young adults who had been exposed to preeclampsia [77] . Longer-term studies are required to determine the impact of preterm birth, exposure to diabetes, and preeclampsia on blood pressure in older cohorts.
Number of Nephrons in Human Subjects with Primary Hypertension
In white adults aged 35–59 years who died in acci-dents, nephron numbers were significantly reduced in 10 subjects with known essential hypertension compared with 10 matched normotensive controls [52] . Although birth weights were unknown, this study supports an as-sociation between reduced nephron numbers and the risk of essential hypertension. In other studies, nephron num-bers were found to be lower in Caucasians, or Aboriginal Australians, with higher blood pressure levels [52, 66, 78] . This relationship was not as strong in African-Ameri-cans, although hypertension was more prevalent in those with nephron numbers below the group mean, implying that nephron numbers likely have a modifying effect on hypertension in this population [78] . Hypertension in-creases with glomerular volume in both white and Afri-can-American subjects, although the probability of devel-oping hypertension is universally higher for African-American subjects [55] . A better understanding of the ethnic variability in developmental programming risks is important to refine our understanding of the pathophys-iology of the programming of hypertension. The findings that salt sensitivity of blood pressure in humans is associ-ated with LBW and a small kidney size are consistent with altered sodium handling having a role in the pathogenesis of hypertension in LBW subjects, which may at least par-tially be mediated by a reduction in nephron numbers [79–81] .
Other Programmed Factors Contributing to Increased Blood Pressure
Low nephron numbers alone are not always associated with programmed hypertension, suggesting that addi-tional factors also contribute to this phenotype. Restoring nephron numbers by supplementing a low-protein diet with urea or alanine in pregnant rats did not prevent the programmed rise in blood pressure of the rat offspring, whereas supplementation with glycine did, suggesting that varying amino-acid deficiencies during gestation may have different programming effects on the kidney [82] . Similarly, postnatal hypernutrition in normal rats led to obesity, hypertension, and glomerulosclerosis with age, despite a 20% increase in nephron numbers [83] . Other elegant studies have demonstrated changes in renal tubular sodium handling in all tubule segments and al-tered vascular function in developmentally programmed animals that likely also contribute to blood pressure and renal function changes later in life [84, 85] . As with neph-ron number studies, the varying experimental conditions and animals used are associated with variations in the programmed phenotype, which underscores the likely multifactorial nature and ramifications of developmental “hits.”
Clinical Associations of Renal Programming with Renal Function and CKD
LBW has been the best-studied marker for having ex-perienced an adverse intrauterine environment and renal developmental programming [15] . Studies have shown strong associations with fewer and bigger glomeruli, a greater risk of hypertension, proteinuria, salt sensitivity of blood pressure, and progressive CKD [16, 22, 60, 61, 65, 78–80, 86] . Overall, a meta-analysis of 31 studies,
in-cluding over 2 million subjects, documented that in LBW offspring the risk of developing CKD (defined as albu-minuria, a reduced GFR, or renal failure) in later life is increased by 70% [16] . In a Norwegian population-based study, the odds of a reduced GFR (<100 mL/min) were 1.66 (95% CI, 1.16–2.37) in men and 1.65 (95% CI, 1.17– 2.35) in women who were born SGA compared with AGA, which increased further among those who had been very small for gestational age, demonstrating a dose-response effect [32] . Studies examining renal function af-ter preaf-term birth have thus far been conducted predomi-nantly in children, and many have described an associa-tion with reduced GFR and increased urinary albumin excretion among those who had been born preterm [30, 31, 87–89] . In a cohort of young adults born preterm, birth weight correlated negatively with microalbumin-uria and positively with GFR [90] . In addition, those who had been preterm and SGA had a 2.4-fold (95% CI, 0.6– 9.3) increase in microalbuminuria, suggesting an addi-tional impact of growth restriction. Although changes in renal function are generally small and may still be within the normal range in children and adolescents, these may progress to overt renal dysfunction with age or superim-posed renal insults. Potentially consistent with this hy-pothesis is a population-based case-control study in sub-jects with known childhood CKD (<21 years of age); LBW was significantly associated with an increased risk of CKD (OR 2.88; 95% CI, 2.28–3.63), renal dysplasia/aplasia (OR 4.51; 95% CI, 3.47–5.85), and a reduced GFR (OR 6.36; 95% CI, 4.00–10.12) [91] ( Table 3 ).
Exposure to maternal diabetes and overweight/obesity are also increasingly being recognized as risk factors for renal developmental programming. It has long been known that exposure to diabetes during gestation leads to
Table 3. Prenatal risk factors for childhood CKD [adapted from 91] Neonatal factors Maternal factors
LBW HBW preexisting DM GDM overweight obesity
Crude OR 95% CI 2.41 2.08–2.80 1.17 1.03–1.34 1.97 1.15–3.37 1.40 1.11–1.77 1.19 1.02–1.38 1.27 1.08–1.49 Adjusted OR1 95% CI 2.88 2.28–3.63 0.97 0.79–1.21 1.12 0.4–2.84 1.54 1.13–2.09 1.24 1.05–1.48 1.26 1.05–1.52 CI, confidence interval; DM, diabetes mellitus; HBW, high birth weight; OR, odds ratio. Chronic kidney dis-ease (CKD) defined by ICD-9 code 585.x, including obstruction and dysplasia.
1 Adjustments listed in primary reference included maternal body mass index, smoking, and gestational hy-pertension.
congenital malformations of the kidney, and the risk seems to persist after controlling for maternal body mass index (BMI) [91] . Diabetes during pregnancy is associ-ated with HBW, which in turn has been associassoci-ated with increased risks of proteinuria and ESKD [26, 39] . It has been suggested that exposure to diabetes during gesta-tion, rather than genetic factors, is a mediator of renal programming in offspring based on the finding that renal functional reserve is lower in young adult offspring of mothers with diabetes during gestation than in those with diabetic fathers [92] . In animals, maternal diabetes expo-sure (models of type 1 and 2 diabetes) is associated with reduced nephron numbers in offspring, which would be consistent with a reduction in renal functional reserve [93, 94] .
As shown in Table 3 , the adjusted OR for childhood CKD following exposure to maternal diabetes was in-creased in unadjusted analyses but was attenuated in those with pregestational diabetes after adjustment for maternal BMI and smoking [91] . Exposure to maternal overweight and obesity was also independently associat-ed with increasassociat-ed odds of childhood CKD [91] . The OR for renal dysplasia or aplasia was significantly increased with maternal pregestational type 1 or 2 diabetes, where-as gestational diabetes mellitus (GDM) wwhere-as where-associated with an increased risk of obstructive uropathy [91] . Among a Pima Indian population with type 2 diabetes (aged 12–77 years), the OR for albuminuria in those who were the offspring of mothers with diabetes mellitus
com-pared with mothers with prediabetes was 3.8 (95% CI, 1.7–8.4), and the age- and sex-adjusted incidence rate for ESKD in this population was 4.12 (95% CI, 1.54–11.02) [26, 95] . As maternal diabetes and maternal obesity are both increasing worldwide and are highly correlated with each other, the impact of these conditions on the blood pressure and renal health of future generations is likely to increase [96–98] .
Clinical Associations of Renal Programming with ESKD
Several large studies have demonstrated associations specifically between LBW and the risk of ESKD [16, 39] . The strongest evidence probably comes from a Norwe-gian birth registry study where birth weight <10th per-centile for the population (around 2.8 kg) was associated with a relative risk (RR) of 1.7 (95% CI, 1.4–2.2) for ESKD during the first 38 years of life [86] . In separate analyses with LBW defined as <2.5 kg, even stronger effect esti-mates were seen [29] . This dose-response relationship suggests that the degree of IUGR is an important pro-gramming factor [29] ( Table 4 ).
LBW was associated with an increased risk of ESKD due to any cause. The association was, however, stronger in the first 15 years of life and was strongest for congen-ital malformations/hereditary diseases [48] . Taking this further, an investigation into the programmed risk in a subgroup aged 18–42 years, excluding subjects with con-genital renal disease, found that LBW per se was not
Table 4. Risk of ESKD according to birth weight and gestational age category [derived from 29]
All 1–18 years >18–42 years
HR 95% CI HR 95% CI HR 95% CI
LBW
All (BW <10%ile) 1.63 1.29–2.06 2.72 1.88–3.92 1.23 0.9–1.68 <2.5 kg 2.25 1.59–3.19
SGA (all; <37 weeks) 1.67 1.3–2.07 1.93 1.28–2.91 1.53 1.15–2.03 Preterm (<37 weeks) 1.36 0.94–1.99 LBW Term 1.56 1.18–2.07 Preterm 1.89 1.25–2.86 1.42 0.82–2.48 Term SGA 1.54 1.2–1.96 1.41 1.05–1.90 Preterm AGA 1.09 0.69–1.73 SGA 4.03 2.08–7.80 4.02 1.79–9.03
AGA, appropriate for gestational age; BW, birth weight; HR, hazard ratio; LBW, low birth weight; SGA, small for gestational age. All comparisons for term birth, LBW term, AGA term as relevant.
nificantly associated with developing ESKD, but being SGA was [29] . In these studies, LBW, SGA, and preterm birth were overlapping groups. When using the defini-tion of <10th percentile of birth weight for LBW and <10th percentile weight for gestational age for SGA, among the 10% with LBW, 61.0% had SGA, and 31.7% were preterm. When using the 2.5-kg cutoff for LBW, 52% were also considered SGA, and 65.6% were preterm [29] . Although LBW can be explained simply by short gestational age in prematurity, SGA is more often ex-plained by intrauterine nutritional restriction. It is pos-sible, therefore, that being SGA and/or being preterm are better markers for an adverse intrauterine environ-ment. Previous studies have suggested LBW, SGA, and preterm birth are all associated with hypertension, pro-teinuria, and a reduced GFR [21, 22, 30–32, 87] . Indeed, in the Norwegian study cited above, among those 18–42 years old, being SGA (birth weight <10th percentile for gestational age) was significantly associated with the risk of ESKD, and the effect was much stronger in those born preterm with SGA than those born at term with SGA (RRs of ESKD of 4.02 [95% CI, 1.79–9.03] and 1.41 [95% CI, 1.05–1.9], respectively; Table 4 ) [29] . These popula-tion level data suggest that both SGA and prematurity are important risk factors and likely potentiate each oth-er’s effects, with preterm SGA infants being at highest risk.
Maternal Nutrition and Health, Pregnancy Outcomes, and the Intergenerational Impact of Programming
Maternal health and nutrition are important determi-nants of healthy pregnancies and impact kidney develop-ment [15, 99] . These factors are strongly impacted by so-cioeconomic and structural factors [65, 100] ( Table 5 ).
Throughout life, maternal nutrition is an important determinant of pregnancy outcome and offspring birth weight ( Table 6 ).
Short maternal stature is a risk factor for offspring SGA or preterm birth, and may result from the mother herself having been born preterm or SGA [104, 105] . In animal studies, deficiencies in total calorie, protein/ami-no acid, iron, vitamin A, and zinc intake in pregnancy have been associated with reduced nephron numbers in offspring [reviewed in 15 ]. In humans, mothers being un-derweight or iron deficient during pregnancy have an in-creased risk of having an LBW infant [103] . Maternal vi-tamin A levels have been shown to correlate with off-spring kidney size and nephron number [15, 106] . Supplementation of iron, micronutrients, balanced
en-ergy, calcium, zinc, and iodine in pregnant women have all been associated with reductions in LBW or preterm birth and, therefore, may have a positive impact on devel-opmental programming in the kidney [103, 107] . Mater-nal intake of alcohol, caffeine, as well as tobacco con-sumption are also known to be associated with an in-creased risk of LBW, preterm birth, as well as program-ming of childhood blood pressure, kidney size, and func-tion [108–115] . Intervenfunc-tions to reduce smoking in preg-nancy have been associated with reductions in the risk of LBW and preterm birth [107] .
Table 5. Maternal factors that modify a healthy pregnancy and comments [reprinted with permissions from 15]
Developmental factors
Maternal birth weight <2.5 or >4.0 kg Short stature, stunting (height <145 cm)
Behavioral factors
Cigarette smoking Alcohol consumption Substance and/or drug abuse
Demographic factors
Age <18 or >40 years Ethnicity
Health-related factors
Undernutrition, low maternal body mass index Iron deficiency
Malaria
Diabetes mellitus or gestational diabetes mellitus Hypertension
Preeclampsia, eclampsia
Chronic kidney disease, transplant, dialysis Birth before term
Multiple gestations Multiparous (≥3) Assisted reproduction Infections Obesity Social factors
Highly active antiretroviral therapy for HIV Prenatal care
Unplanned pregnancy, birth spacing Teenage pregnancy
Marriage during childhood Conflict, war, stress Education level Poverty
Environmental factors
Seasonal variations in nutrient availability Toxin or pollutant exposure
Chronic maternal illness and acute infections increase the maternal risk of LBW, SGA, preterm birth, and pre-eclampsia [15, 116, 117] . Acute infections such as ma-laria are an important cause of LBW, SGA, and preterm birth, which was estimated to contribute to 900,000 LBW deliveries in sub-Saharan Africa in 2010 [118] . Registry data from Denmark reported an increase in maternal chronic disease in pregnancy from 3.71 to 15.76% be-tween 1989 and 2013 [119] . A population survey in Ger-many reported 20% of pregnant women having at least 1 chronic disease, which was associated with an increased risk of preterm delivery [120] . Specifically, women with all stages of CKD in pregnancy have increased risks of preterm birth, SGA, and LBW, which increase with wors-ening renal function [121, 122] . The major maternal risk factors for preeclampsia identified in a secondary analysis of the WHO Global Survey on Maternal and Perinatal Health included chronic hypertension, GDM, cardiac disease, renal disease, urinary tract infections, pyelone-phritis, and severe anemia [123] . Among these, chronic hypertension had the highest OR (7.75; 95% CI, 6.77– 8.87) followed by cardiac/renal disease (OR 2.3; 95% CI, 1.86–3.05), and GDM (OR 2.00; 95% CI, 1.63–2.45). In turn, the odds of offspring preterm birth (2.86; 95% CI,
2.68–3.06) and LBW (OR 2.32; 95% CI, 2.16–2.50) were significantly increased in pregnancies complicated by preeclampsia.
A mother’s own birth history and circumstances im-pact her risk of pregnancy complications. The risk of GDM or gestational hypertension including preeclamp-sia or eclamppreeclamp-sia was significantly increased in women who themselves were born preterm [124] . The risk in-creased with decreasing gestational age and with super-imposed SGA, again demonstrating a dose-response re-lationship with the degree of prematurity and the impact of growth restriction on long-term risk (OR for ≥ 1 com-plication 1.95; 95% CI, 1.54–2.47, if the mother was born <32 weeks, and 1.14; 95% CI, 1.03–1.25, if the mother was born between 32 and 36 weeks). Preeclampsia is associ-ated with an increased risk of LBW, SGA, and preterm birth [123] . Based on the programming paradigm, the offspring of these pregnancies in turn would be at in-creased risk of pregnancy complications, perpetuating the intergenerational cycle of developmental program-ming. Similarly, maternal LBW or prematurity are risk factors for LBW or preterm infants. Interestingly, the risk of offspring prematurity was significantly increased if the mother was premature, in inverse proportion to her
Table 6. Global distribution of maternal nutritional indices
Obesity Anemia (defined as hemoglobin <110 g/L)
(2011) Vitamin A deficiency (1995–2005) Global prevalence 11% 38% (34–43) 15.3% (7.4–23.2) HIC USA (2011–2012): 31.8% (28.3–35.5) 22% (16–29) European region (2009): 7.1–25.2%
LMIC European region (2003–2012): 5.0–21.2% Central and Eastern Europe: 24% (14–40) Eastern Mediterranean region (2003–2013): East and Southeast Asia: 25% (17–38)
9.7–31.0% Oceania: 36% (18–59)
African region (2004–2012): 0.7–26.8% South Asia: 52% (40–63)
American region (2008–2012): 6.4–26.3% Central Asia, Middle East, and North Africa: Southeast Asian region (2006–2011): 31% (22–42)
0.9–12.1% Central and West Africa: 56% (46–62)
East Africa: 36% (30–41) South Africa: 31% (20-48%)
Andean and Central Latin America and Caribbean: 27% (21–34)
Southern and Tropical Latin America: 31% (13–56)
Reference 101 102 103
HIC, high-income country. Numbers in parentheses are study durations and 95% confidence intervals. Vitamin A deficiency was defined as serum retinol <70 μmol/L.
tational age, but was not increased if the father was born preterm, suggesting a direct programming effect in the mother [125] . Maternal obesity is a risk factor for both HBW and LBW, and maternal diabetes increases the risk for HBW in the offspring. These outcomes associate with renal developmental programming [100] . Importantly, the risk of LBW was highest in mothers who had been born preterm but became obese before pregnancy, again indicating the compounding hazard of obesity after being born small [126] . Both maternal LBW or HBW was also associated with an increased risk of GDM [127] . Whether all of these intergenerational risks transmitted through developmental programming and alterations in offspring phenotype are mediated directly or via epigenetic mecha-nisms is not yet clear and requires further study [46, 128– 130] .
The majority of maternal factors impacting LBW and prematurity do not exist in isolation. Their developmen-tal effects on the kidney are highly relevant for women in developing countries, where the prevalence of SGA in-fants, preterm birth, and LBW infants is known to be higher than in developed countries, but also remain highly relevant in developed countries with increasing maternal age, more frequent maternal chronic disease, and use of assisted reproduction technologies (ART) ( Fig. 2 ).
Renal Programming and Congenital Anomalies of the Kidneys and Urinary Tract
Congenital anomalies of the kidneys and urinary tract (CAKUT) account for 50% of pediatric kidney trans-plants, with obstructive nephropathy and hypoplasia/ dysplasia constituting the majority of these [131] . Mono-genic mutations have been established in approximately 17% of CAKUT, but, in most cases, the etiology remains undetermined and is likely the result of multiple genetic, epigenetic, and fetal environmental factors. In a recent population-based case-control study of children <21 years of age with CKD, LBW (OR 4.51; 95% CI, 3.47– 5.85) and maternal pregestational diabetes (OR 7.52; 95% CI, 3.97–14.24) were significantly associated with the risk of renal dysplasia or aplasia [91] . Similarly, maternal GDM (OR 1.50; 95% CI, 1.07–2.09), maternal overweight (OR 1.27; 95% CI, 1.05–1.52), maternal obesity (OR 1.27; 95% CI, 1.05–1.55), and LBW (OR 2.53; 95% CI, 1.95– 3.29) were all significantly associated with childhood ob-structive uropathy [91] . Many gestational stress factors can, therefore, potentially impact renal development.
An important but underrecognized clinical correlate of reduced nephron numbers is congenital urinary tract obstruction. Animal models have been developed to ex-amine the relationship of kidney development to injury resulting from urinary tract obstruction. In contrast to
Fig. 2. Prevalence of SGA, preterm birth, and LBW infants by United Nations Millennium Development Goal regions in 2010 (reprinted with permission according to CC Creative Commons Attribution-NonCommercial-noDerivs from Lee et al. [28] ).
humans, in whom all nephrons are formed before birth, nephrogenesis continues in the first postpartum week in rats and mice. Surgical unilateral ureteral obstruction (UUO) in the early postnatal period, therefore, models obstruction in the human third-trimester pregnancy. Complete UUO in the newborn rat reduced nephron number by 40%: release of obstruction after 5 days nor-malized GFR at 1 month of age, but did not restore neph-ron number [132] . When these rats were followed to 1 year of age, nephron number remained 40% of normal, but GFR of the postobstructed kidney decreased by 80%, and glomerular sclerosis and interstitial fibrosis were in-creased in both kidneys [133] . There is a linear correla-tion between the duracorrela-tion of UUO and the nephron num-ber reduction in the neonatal rat [134] . In contrast to the neonate, however, release of complete UUO in the adult rat does not result in a decreased nephron number [134] . These studies suggest that the developing kidney is par-ticularly susceptible to obstructive injury, and that early surgical release of urinary tract obstruction can improve long-term nephron number.
In most children requiring RRT for CAKUT, the onset of renal failure is delayed until adulthood [135] . Nephron number at birth may, therefore, be an important determi-nant of outcome after relief of congenital obstruction and a modulator of the decline in renal function over time. Consistent with this possibility, the risk of ESKD was found to be significantly higher among SGA subjects with CAKUT or inherited causes of renal disease compared to those with normal birth weights (OR 2.5; 95% CI, 1.6–3.7) [86] .
Neonatal AKI and Perinatal Drug Exposure
AKI occurs in 16–70% of neonatal populations [136– 138] . Some of this variability comes from reports of neo-nates and preterm infants with varying comorbidities (e.g., congenital diaphragmatic hernia, cardiac surgery, and asphyxia) but also reflects the challenge of diagnosing AKI in the neonate and the lack, until recently, of a uni-form diagnostic classification [136] . A neonatal KDIGO classification has been proposed, but serum creatinine may not be reliable as it reflects maternal creatinine and is also dependent on maturity of renal tubule function [136] . Cystatin C levels may reflect renal function better than creatinine, and various biomarkers are being inves-tigated as a tool to detect AKI early [139, 140] . The major risk factors for neonatal AKI are preterm birth, LBW, re-duced nephron numbers, critical illness, and nephrotoxin exposure [58, 136, 141–143] . All of these factors in turn may also reduce the potential for postnatal
nephrogene-sis, which can occur for a limited period following pre-term birth [58] .
The kidney is vulnerable to the toxic effects of many drugs [144] . Preterm neonates are often exposed to po-tentially nephrotoxic drugs during ongoing renal devel-opment [141] . Aminoglycosides are frequently prescribed in the neonatal intensive care unit (ICU) and can lead to tubular injury and AKI [144–147] . Furthermore, in ani-mals, aminoglycosides have been shown to lead to re-duced nephron numbers [148, 149] . Nonsteroidal anti-inflammatory drugs (NSAID) are used to treat patent ductus arteriosus (a congenital defect of the heart) in the postnatal period, and, particularly in preterm infants, this can potentially impact ongoing nephrogenesis and nega-tively influence short-term renal function [150] . The true risk of AKI in neonates exposed to nephrotoxic medica-tions is not well described, however, as the toxicity cannot merely be extrapolated from knowledge in older children and adults. A prospective study of 269 infants exposed to medication perinatally (i.e., medication prescribed to mothers during late pregnancy or administered to the in-fant within the first 7 days of life) and stratified according to whether they had a GFR below or above the group me-dian on day 7 found that ibuprofen administration before day 7 was associated with an OR of 2.6 (95% CI, 1.2–5.3) for having a lower GFR [151] . The lower GFR in infants administered ibuprofen persisted for the month of fol-low-up. Importantly, aminoglycoside serum concentra-tions were higher in infants receiving ibuprofen, suggest-ing potentially enhanced toxicity [151] . Exposure to ami-noglycosides was not associated with a lower GFR in this study although 7 days could be too soon to detect an ef-fect. Others have reported higher serum creatinine values at 2 months of age in preterm infants born SGA who re-ceived aminoglycosides compared with those who did not [152] . Given that many infants receive multiple med-ications, and that infants with the lowest birth weights tend to receive more nephrotoxic medications per day, increased awareness of risks and of potential interven-tions to minimize the risk of toxicity are crucial [136, 141, 146, 147] . A medication that is frequently used in the neo-natal ICU that may be protective against AKI is caffeine, but more study is required to better determine the true effect [153] . Current guidelines recommend prophylactic administration of theophylline, pharmacologically simi-lar to caffeine but with a greater side effect profile, to in-fants at high risk of AKI after perinatal asphyxia [154] .
Medications given to mothers before delivery have also been associated with an impact on neonatal renal function. Tocolytic therapy administered to the mother
until the day of delivery was significantly associated with a lower GFR in the infant on day 7, and administration of the COX-2 inhibitor nimusulide as a tocolytic has been reported to induce renal failure and ESKD in neonates in multiple case reports [151, 155, 156] . In animals, multiple medications that could be prescribed during pregnancy have been found to impact offspring kidney develop-ment, including β-lactam antibiotics, cyclosporine, and long-term steroids, although their renal impact in hu-mans is largely not known and long-term follow-up is needed [48, 65, 157] . In humans, antibiotic treatment during pregnancy has also been associated with LBW, al-though the effect was strongest for the nonpenicillins [158] .
The risk of neonatal AKI increases with increasing de-gree of prematurity, demonstrating a dose-response ef-fect in the susceptibility of the developing kidney to in-jury [159] . Neonatal AKI is associated with poor short-term outcomes, such as increased mortality and longer hospital stays [159, 160] . In addition to the association between neonatal AKI and short-term outcomes, AKI is linked to the development of CKD both in epidemiology studies and in studies of LBW subjects (weighing <1.5 or 1.0 kg), an effect that may be modulated by the develop-ment of obesity [20, 161–164] . There is academic debate surrounding the pathway linking AKI and CKD. Some
believe AKI permanently damages nephrons, and this re-duction in nephron numbers causes CKD. Others believe AKI is a “red flag” or a harbinger for patients at risk, with a reduced number of nephrons, and these patients were destined to develop CKD. In either case, AKI may be a potentially modifiable risk factor for later-life CKD [165] . Importantly, it has been reported that episodes of AKI occurring during neonatal hospitalization are often not recorded in hospital discharge letters [159] . Such infor-mation is crucial to communicate as ongoing follow-up of infants with AKI is necessary.
LBW Is Associated with More Rapid Progression of CKD
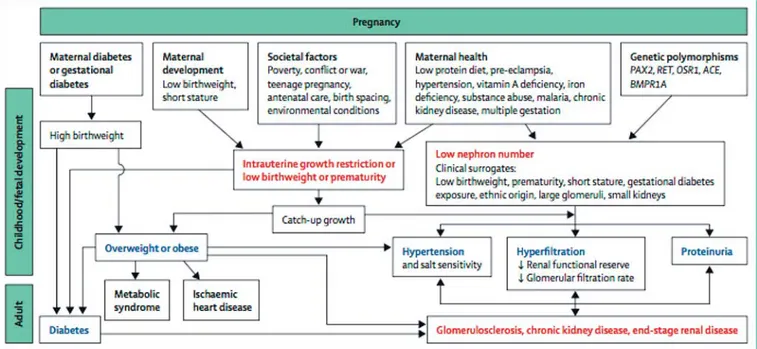
It is unlikely that developmental changes in the kidney associated with LBW, prematurity, or other developmen-tal stressors alone are enough to lead directly to renal dis-ease except in severe cases, but a kidney with fewer neph-rons would plausibly be less able to withstand additional “hits” such as AKI, glomerulonephritis, or renal injury imposed by other developmentally programmed condi-tions such as diabetes, CVD, and obesity, which all exac-erbate the risk of renal injury [20, 23, 166, 167] ( Fig. 3 ).
IgA nephropathy (IgAN), for example, is the most fre-quent primary idiopathic glomerulonephritis worldwide [168–170] . Patients with IgAN tend to be younger and
have fewer confounding conditions than other CKD pa-tients, but they are at risk of rapid disease progression. IgAN is therefore a good model to study the impact of renal programming. Lower glomerular density has been shown to predict the long-term prognosis of IgAN [171] . In children with IgAN, LBW was associated with higher rates of progressive disease [172] . In a further analysis of a Norwegian population-based study, LBW and SGA were independently associated with an increased risk of reaching ESKD in adult males (OR 2.2; 95% CI, 1.1–4.4, and OR 2.7; 95% CI, 1.4–5.5) compared to controls; how-ever, the risk was further increased among those with both LBW and SGA (OR 3.6; 95% CI, 1.6–8.2) [173] . There were no associations found between birth param-eters and ESKD among females, but the numbers were small and statistical power was limited. Preterm birth alone was also not associated with ESKD risk in this study, and among those born SGA, those born preterm had a higher risk of developing ESKD (OR 10.8; 95% CI, 2.6– 4.5) than those born at term [173] . In this study, IgAN patients with LBW/SGA had lower estimated GFR at the time of diagnosis, and, after adjustments for this, the as-sociation was no longer significant [173] . Exactly how
LBW/SGA modulates the risk of renal disease progres-sion in IgAN is thus not yet clear, although unpublished data show that the patients with LBW/SGA had larger glomerular volumes, potentially consistent with reduced nephron numbers. Other studies have also shown more rapid progression of other primary renal diseases in hu-mans associated with LBW [174–181] ( Table 7 ).
Aging and Programming of Renal Disease
Observational data in humans show that GFR normal-ly declines with age, usualnormal-ly beginning after about 30 years of age, but at variable rates [183, 184] . Such decreas-es in GFR are seen in the healthidecreas-est of the healthy (living kidney donors) [185] . In normal subjects studied longi-tudinally, the distribution of the slopes of change in renal function over time is nearly Gaussian, with an increased rate of decline in the “tail” [183] . The changes in GFR with aging can be dissociated from blood pressure and cardiovascular function [186] . The variability in the rate of “renal senescence” might be traceable to renal endow-ment. If renal senescence, whatever the mechanism, is a programmed phenomenon, then it is reasonable to pos-tulate that the number of nephrons present at the begin-ning of life will directly influence the rate of GFR decline with aging. Indeed, experimental data in animals have suggested that inbred strains with impaired nephrogen-esis develop glomerulosclerosis later in life [187, 188] . Ex-perimentally induced LBW and low nephron numbers are associated with the acquisition of an accelerated “renal senescence” phenotype, especially after catch-up growth [189–191] . Premature renal senescence may, therefore, be a programmed phenotype.
The association between LBW and ESKD has not been studied in subjects older than 50 years apart from 1 Japa-nese study suggesting that diabetic nephropathy was more common among elderly patients on hemodialysis who had been born with LBW [16, 192] . Whether this finding suggests an effect of programming on diabetes, renal disease, or both, is not known [29] . As the impact of prenatal programming is expected to be compounded with age, the association of LBW and SGA with the risk of ESKD seen in younger adults may become greater with age [29] ( Table 4 ).
Potential Effects of Programming on Kidney Transplantation
Kidney donation involves the loss of one half of exist-ing nephrons. Donors havexist-ing a sexist-ingle remainexist-ing kidney with a reduced number of nephrons per kidney may be at increased risk of loss of renal function over time [193] .
Table 7. Examples of primary kidney diseases that progress more rapidly in patients with low birth weight (LBW)
Clinical findings
IgA nephropathy [172, 173]
Increased hypertension and glomerulosclerosis in LBW children Increased progression to end-stage renal disease if LBW and/ or small for gestational age, especially among males
Membranous nephropathy [181]
LBW associated with steeper decline in glomerular filtration rate
Minimal change disease [172, 174, 177]
More relapses and steroid dependence in LBW children
Chronic pyelonephritis [179]
Patients with progressive deterioration in renal function had lower birth weight
Autosomal dominant polycystic kidney disease [178]
Earlier onset of end-stage renal disease with lower birth weight
Focal-segmental glomerulosclerosis [180]
Very LBW and preterm birth are risk factors for focal-segmental glomerulosclerosis
Alport syndrome [182]
Animal studies have demonstrated that a reduction in re-nal mass in rats with congenitally reduced nephron num-bers leads to accelerated loss of renal function compared to similar renal mass reduction in genetically identical rats with normal nephron numbers [187] . These data are relevant to both transplant recipients and kidney donors. In recipients, mismatch of kidney size to donor size, i.e., smaller kidneys transplanted into larger donors, is associ-ated with accelerassoci-ated loss of renal function over time [194, 195] . It is conceivable that kidneys from donors with low nephron numbers would be at the highest risk of failure [196] . Nephron numbers in donated kidneys have not been studied, but smaller kidneys, by weight or volume, which are proportional to nephron number, have been shown to have shorter graft survival [197–199] . Similarly, a donor with a reduced nephron number may also be at increased risk of loss of renal function over time with a single kidney [193] ( Table 8 ).
Similarly, women who have experienced preeclampsia are themselves at increased risk of developing ESKD, a risk which may increase after the donation of 1 kidney [204] . Indeed, women with preeclampsia have a 4- to 15-fold increased risk of all-cause ESKD compared to wom-en without preeclampsia [86, 205] . The risk was highest in women who also gave birth to offspring with LBW, in women with only 1 lifetime pregnancy and in women with recurrent preeclampsia.
Programmed Risk of Hypertension and Kidney Disease May Be Different for Different Ethnic Groups and Socioeconomic Environments
Hypertension and renal disease prevalence vary be-tween populations from different ethnic backgrounds,
with very high rates being observed among Aboriginal Australians, Native Americans, and people of African de-scent [26, 40, 206] . Renal programming has largely been studied in western Caucasian populations; therefore, the impact of developmental programming of hypertension and kidney disease in high-risk populations, although suggestive, has not been comprehensively studied [66, 207] . The incidence rates of major risk factors for devel-opmental programming of CKD in LMIC are highlighted in Table 9 [20] .
For example, only 3.3% of subjects in a Norwegian study on the association of birth weight with ESKD had birth weight under 2.5 kg, whereas LBW in sub-Saharan Africa has an incidence of 13–15% [3, 29] . In lower-in-come countries, maternal undernutrition is a significant contributor to IUGR, whereas in higher-income coun-tries multiple gestations, ART use, and placental insuffi-ciency are more frequent causes [117, 208, 209] . It is not known whether the varying causes of IUGR affect neph-ron development similarly or not. Importantly, however, maternal undernutrition in lower-income countries may be a frequent cause of impaired nephron development and may impact the future risk of renal disease and high blood pressure in these populations [15, 210] .
Hoy et al. [211, 212] have described a strong and con-sistent association between LBW, reduced nephron num-bers, hypertension, susceptibility to renal disease, and premature death in the Australian Aboriginal population, in which LBW is more prevalent and socioeconomic dis-advantage is greater than in their white counterparts. How observations of developmental programming apply from one population to another, however, has not been well studied and may be different. In India, for example,
Table 8. Hypertension and renal function in living kidney donors at risk of renal programming
Population US [200] Australia [201] Canada [202] Germany [203]
black donor/ nondonor white donor/ nondonor indigenous donors nonindigenous donors aboriginal donors white donors BW ≤2 .5 kg BW >2.5 kg Donor number 12,387 71,769 22 28 38 76 18 73 Population programming risk factors
LBW prem. LBW Ref HBW (offspring
DM pregnancies)
Ref LBW Ref
HT – – 50% 6% 42% 19% 39% 15%
Proteinuria – – 81% 6% 21% 4% 81% 35%
↓ GFR – – 81% 38% Not different Not different
ESKD 74.7 vs. 23.9/ 10,000 22.7 vs. 0.0/ 10,000 19% 0% 1 0 0 0 Follow-up, years (IQR) 7.6 (3.9–11.5) 16.1 (1.27–20.2) 6.37 (2.54–21.2) 14.6±9.3 13.4±9.5 ≥5 ≥1–3 BW, body weight; DM, diabetes mellitus; ESKD, end-stage kidney disease; GFR, glomerular filtration rate; HBW, high birth weight; HT, hypertension; LBW, low birth weight; Ref, referring group.
LBW is common and has also been associated with high-er blood pressure in some studies, but the programming effects appear to be more consistent for insulin resistance and type 2 diabetes in this population, possibly modu-lated by the “thin-fat” phenotype [213] . As discussed above, the inverse relationship between nephron num-bers and blood pressure observed in Aboriginal Austra-lians was similar to that seen among Caucasian Ameri-cans, but not as evident in African-Americans [66] . Sim-ilarly, the relationship between LBW and blood pressure is more consistently shown in Caucasian than African-American children [214, 215] .
An increase in blood pressure among adults exposed to famine during gestation and early development was, however, found to be similar among Nigerians exposed to the Biafran famine (1967–1970) and those exposed to the Dutch famine (1944–1945) [216, 217] . Among Bia-fran subjects, studied at age 37–43 years, fetal and infant exposure to famine was associated with an increased risk of hypertension (OR 2.87; 95% CI, 1.9–4.34) compared to those born after the famine [216] . Among Dutch subjects, studied at age 59 years, the risk of hypertension was in-creased after exposure to famine for 10 weeks or more (OR 1.44; 95% CI, 1.04–2.0) compared to unexposed sub-jects [217] . Earlier analysis in the Dutch subsub-jects between ages 48–53, however, did not find significant differences in blood pressure among those exposed or not exposed to famine [218] . The effect of famine on blood pressure may, therefore, be accelerated in the African compared with the European populations, which suggests that addition-al factors likely contribute to hypertension in African populations. In both studies, exposed compared with nonexposed subjects also had increased risks of obesity and glucose intolerance in adulthood, demonstrating the multisystem impact of developmental programming [216, 218] .
Although the prevalence of childhood undernutrition is declining, the global estimate for childhood wasting in 2011 was still 8%, of whom 70% lived in Asia [103] . The long-term consequences of infant malnutrition on blood pressure and renal function have been scarcely studied. Among African-Caribbeans aged 28 years who survived Kwashiorkor or Marasumus, exposure to infant malnutri-tion was associated with alteramalnutri-tions in cardiac funcmalnutri-tion, higher systemic vascular resistance, and increased diastol-ic blood pressure [219] . These data emphasize the impor-tance of early childhood nutrition in modulating CVD risk and highlight the need for further studies to understand the pathophysiology and determine how best to intervene.
At present, there is also compelling evidence of an as-sociation between variants in the apolipoprotein L1 (APOL1) gene and CKD in African-Americans and in West Africans [220–222] . A key question is whether these variants interact with LBW in a way that influences the development of CKD given that LBW is prevalent in sub-Saharan Africa and among African-Americans compared to their Caucasian counterparts [34, 223] . The relation-ship between nephron number and birth weight in sub-jects of African origin has been found to be consistent with that seen in Caucasian subjects; therefore, despite studies in adults with unknown birth weights showing a large variation in nephron numbers among African-Americans, with the mean being similar between Cauca-sians, African-Americans, and Senegalese, LBW is likely associated with reduced nephron numbers [60, 61, 224, 225] . One study reported that African-Americans with 1–2 APOL1 variant alleles did not have fewer glomeruli or larger glomeruli than African-Americans without risk alleles, but kidneys from subjects with 1–2 APOL1 risk variants experienced accelerated loss of nephrons after age 38 years, which was further increased by concurrent obesity [226] . This possible interaction between APOL1 Fetal/maternal circumstances Proportions in LMIC
LBW (2010) 15% (138 LMICs)
Prematurity (2010) 11.3% (138 LMIC)
HBW (2004–2008) 0.5–14.9% (24 countries)
Gestational diabetes (2013) 0.4–24.3% (15 countries) Maternal overweight (2003–2009) 13.7% (27 sub-Saharan countries) Maternal obesity (2003–2009) 5.3% (27 sub-Saharan countries)
HBW, high birth weight; LMIC, low- and middle-income countries. In gestational diabetes, rates vary in part related to differences in cutoff values for diagnosis.
Table 9. Prevalence of LBW, prematurity, maternal diabetes, and obesity in low- and middle income countries [18, 28, 96, 97]
risk variants and the effect of LBW on kidney disease in these ethnic groups needs further investigation.
Catch-Up Growth and Nutrition in Early Childhood as Modulators of Developmental Programming
Postnatal nutrition also has potential programming consequences. Especially in preterm infants or those born SGA, optimal early nutrition is important for growth and survival [227] . Through experimental and human stud-ies, it has been shown that postnatal nutrition in terms of calories, protein content, and micronutrients can impact nephron numbers and long-term renal function [15, 20, 31, 82, 83, 228–230] . Animal data suggest some reversal of programmed renal changes can occur with the restora-tion of normal dietary composirestora-tion, but overfeeding leads to obesity and hypertension independently of nephron numbers and may therefore be harmful [83, 228] . In pre-term children studied at age 7 years, both intra- and ex-trauterine growth restriction were associated with re-duced GFR (although still within the normal range), suggesting an impact of postnatal growth restriction on kidney development [31] . Optimizing postnatal nutri-tion in preterm infants is a challenge.
Evidence is mounting to show that rapid “catch-up” growth (i.e., upward crossing of weight centiles) or in-crease in BMI leads to the development of higher blood pressure, insulin resistance, and cardiovascular risk al-ready in childhood [231–233] . These findings are most marked in those who were born small and became rela-tively larger [213, 231, 234, 235] . In resource-limited coun-tries, catch-up growth is necessary as it improves child survival, stunting, and malnutrition [227] . The timing of catch-up growth appears to modulate the risk/benefit ra-tio, as early catch-up seems beneficial and later catch-up appears to be more harmful [227, 233, 234, 236] . The ef-fects of catch-up growth may be different if the catch-up occurs predominantly in height (linear growth) or in weight, and, in most studies, the adverse effects were most marked among those who had been LBW or preterm and became overweight or obese [233–237] . Effects of catch-up growth may also differ between developed and developing countries [238] . HBW and exposure to GDM are also risk factors for childhood overweight and obesity [239] .
It has been suggested that in individuals born small (LBW, SGA, or preterm), the superimposition of a high metabolic demand from a large body on a relatively small kidney may be a factor leading to hypertension and kid-ney disease over time [75] , termed the “capacity load” model. Indeed, in a pediatric renal clinic population, chil-dren who were preterm and became obese had more
rap-id progression of renal disease compared to similar pre-term children who were not obese [240] . In a separate cohort, in a follow-up of extremely LBW preterm chil-dren who had experienced neonatal AKI, GFR were low-er at age 7.5 years among those with elevated BMI [241] . In a population study where birth weights were unknown, obesity in adolescents was found to be a risk factor for later-life ESKD [242] . Finding the inflection point where postnatal nutrition is optimal to improve short-term sur-vival and not increase the long-term risk of CVD is an ongoing challenge. It would seem that close monitoring of growth trajectories in early life and life-long preven-tion of overweight and obesity through educapreven-tion, diet, and exercise in those born small is a safe and achievable principle [243, 244] .
Nature versus Nurture in the CKD Developmental Programming Debate
There has been ongoing debate as to the underlying causes of the associations between LBW and later hyper-tension and kidney disease [245–247] . The relationship between birth weight and nephron number and the asso-ciations between intrauterine malnutrition and cardio-vascular risk factors suggest a direct programming effect signaled by growth restriction [59, 82, 248–250] . On the other hand, LBW, CVD, and CKD do aggregate in fami-lies, suggesting possible genetic or environmental factors determining or confounding the association [247, 251– 255] . The association between LBW and hypertension has been studied the most. A meta-analysis of small twin studies suggested that family factors do confound the re-lationships, but a large Swedish twin study suggested fetal growth was the most dominant programming factor [245, 256, 257] . In another study, higher blood pressure, BMI, and dyslipidemia in the father were found to be associ-ated with LBW, which may also support genetic or envi-ronmental causes [258] . A recent follow-up Norwegian study examined the potential familial confounding of the association between LBW and ESKD risk [29] . In this study, the positive association between being LBW or SGA and later ESKD risk was not significantly modified by having a sibling with LBW or SGA. This study, there-fore, argues that LBW or SGA per se have a greater impact compared to familial factors. Twin studies of renal func-tion have also shown a lower GFR and more rapid pro-gression of inherited renal disease in the lower birth weight twin in both dizygotic and monozygotic twins, which argues for a greater impact of fetoplacental over genetic factors in renal developmental programming [182, 259] .