Online ISSN 2424-6166. EKONOMIKA 2017 Vol. 96(1)
DOI: https://doi.org/10.15388/Ekon.2017.1.10664
CONCENTRATION AND BEHAVIORAL BIASES
IN THE ACTIVE MANAGEMENT OF BRIC FUNDS
Antonio Fasano*
University of Rome LUISS and Salerno, Italy
Claudio Boido
University of Siena, Italy
Abstract. This study addresses two targets: first, the relationship between performance measurement and the
focusing of fund investment strategies on local risk factors; second, the behavioral considerations which fall under this topic, in particular with regard to fund managers’ overconfidence.
Brazil, Russia, India and China were supposed to represent a force of new demand growth and spending power, but the recent financial crisis in China (July and August 2015) and the former problems in the Russian economy, also caused by an embargo by other countries, have contributed to a shift which has occurred more quickly than expected. In this context, weak active management strategies, handicapped by behavioral bi-ases, will be more evident and will cause more harm to the industry. Connections between these biases and the performance of funds are identified with the managers in charge, who are not only misguided by strong beliefs, but also take big bets on risky assets without producing significant alphas. To investigate the relation-ship between local bias and activism, we compare stock picking skills of local managers, the managing of domestic funds and non-local managers; therefore, we assume that local information can be exploited by a local manager with an active management strategy. It is also true that overconfident managers might be too focused on the specific stocks for which they believe to possess superior information. The results show that BRIC local managers are not closely tied to replication strategies of domestic indices and do not produce significant domestic alphas.
Keywords: Behavioral bias, Home bias, Overconfidence, BRICs, Asset Allocation. Introduction
In this research, particular attention was paid to two targets: the relationship between performance measurement and the focusing of fund investment strategies on local risk factors and the behavioral considerations falling under this topic, in particular those con-cerning the subject of fund manager overconfidence.
In the last decade, starting with the global financial crisis of 2007-2008, the emerg-ing markets have attracted significant attention of analysts and investors, as a new asset class to select in a portfolio. Brazil, Russia, India and China were supposed to represent a * Corresponding author:
CASMEF Centre – LUISS University, Viale Romania, 32 – 00197 Rome, Italy E-mail: [email protected]
force of new demand growth and spending power, but the recent financial crisis in China (July and August 2015) and the former problems in the Russian economy, due also to an embargo by other countries, have contributed to a shift which has occurred more quickly than expected.
It is important to understand the different economic and policy characteristics shown by the four BRICs. Brazilians and Russians live in urban areas and are primarily natural resource-based economies and well known commodity exporters. On the other hand, the Chinese and Indians live mostly in rural areas and their capital markets are more difficult to entera, as they are controlled by the state. Their economy is based on domestic indus-trialization for export markets.
Atale (2010) affirmed that the concept of the BRIC countries as an alternative in-vestment class was only a singular factor. These nations in particular were expected to create economic miracles, but they must still overcome structural problems and position themselves as the backyard of global economic growth offering more than just alterna-tive investment choices and low cost solutions within a framework of risk-return. Since 2001, the Gross Domestic Product per capita has increased at annual rates ranging from 2.6 percent for Brazil to 10 percent for China – these performances easily beat the 1 per-cent rate managed by the United States and major European economies.
In a report, Goldman Sachs (2010) explained the key economic strength of the BRIC countries, which clarified the fact that the BRIC countries had sizable economic powers in 2010 and shall act as key growth drivers for many decades to come. Some key factors, they emphasize, are the following:
1. It is now possible that China could become as big as the US by 2027. 2. The BRICs could become as big as the G7 by 2032.
3. Between 2000 and 2008, the BRICs contributed almost 30% to global growth in US Dollar terms, compared with around 16% in the previous decade.
4. Since the start of the financial crisis in 2007, 45% of global growth has come from the BRICs, up from 24% in the first six years of the decade.
5. Long-term projections suggest that the BRICs could account for almost 50% of global equity markets by 2050.
6. The BRIC economies will probably account for more than 70% of global car sales growth in the next decade, with China expected to account for almost 42% of this increase.
Aloui, Aissa and Nguyen (2011) examined the extent of the past global crisis and its contagious effects by analyzing the extreme financial interdependences of some selected emerging markets with the US. Their results, using daily return data, showed strong evi-dence of time-varying depenevi-dence on the BRIC markets and US markets. This relation-ship is stronger for the commodity price in both situations: bullish and bearish markets.
However, to the extent of our knowledge, explicit behavioral interpretations of active management as to whether portfolio concentration is related to performance in the BRIC markets have rarely been investigated.
The complex and different financial crisis of the last years has shown how in such a short period of time financial and economic problems have reached every part of the world. Many practitioners state that the worst financial period followed the Lehman Brother’s bankruptcy in the US in September 2008. That crisis also hit the emerging markets more intensely. Gurdgiev and Trueick (2016) have shown the inter-dependency between the BRIC economies and the developed economies in terms of market volatil-ity. The author states that the VIX index has significant negative correlation at the 1-5% level for returns in Brazil, Russia and China and at the 10% level for India. This leads to the conclusion that the BRIC markets cannot be viewed as a hedge against the volatility of the VIX-implied expected future global markets.
We extend the results of active management strategies in relation to the BRIC mar-kets. We will see how and if the local and global results differ and if we can outline any specific and consistent behaviors for BRIC countries. Attention will also be paid to behavioral biases, while emphasizing the possible presence of overconfidence.
1. Active management
Warren Buffett (2016) observed that “diversification is a protection against ignorance. It makes very little sense for those who know what they’re doing.”
In effect, concentration could have a negative impact for risk-adjusted returns. The most obvious disadvantage of concentration is that it results in higher risk. We can state that the right balance between diversification and skill also depends on the investor’s ability to take and diversify the risk. The concept of being active in asset management describes the difference between the managed portfolio return and the benchmark port-folio return, while active risk is the standard deviation of active return.
Active management is the virtue of skilled professional managers who try to outper-form the market. These managers buy or sell securities in pursuit of a superior combina-tion of risk and return.
The recent past has been irrelevant for active managers and most final or intermediate results of funds have shown that underperformance beats outperformance.
In this context, many investors like to select index funds to take a market risk, avoid-ing the elusive alpha (the portion return not explained by the market) because, even if practitioners are looking for the alpha, not all investors will reach it, since alpha is a zero-sum game.
Active managers declare that asset classes are chosen by applying active selection and by using, for example, market timing, sector or country rotation. Indeed, their port-folio replicates the preferred benchmarks and only a remaining percentage, one between
15%-35%, is really active. The objective in following the selected benchmarks is to guarantee that over the short term the investor’s investment decisions do not cause a problem in reaching a prefixed result and to permit an optimal result to be reached in the long run.
Active management received a great impulse from Grinold and Kahn (2000). They state that the information ratio of a portfolio is the product of a manager’s “skill” in se-lecting securities and of the strategy’s “breadth”. In this context, skill is measured by the correlation between the manager’s expected returns and the ones achieved, and breadth is the square root of the number of independent positions in the portfolio. The research-ers affirmed that active deviations are a function of two factors: skill (playing well) and breadth (playing often). In this way, investors can reach the same target information ratio, but the manager who trades infrequently needs a much higher success rate than the one who takes positions more often. The right trade-off between skill and breadth is one of the reasons for obtaining high returns in the portfolio.
We imagine that active returns are earned through skill, but it is hard to reach. It is easier to keep the same information ratio by focusing on breadth. Active managers try a great number of trades and thereby justify the high returns and their expensive fees for active management, without having any outstanding skill but simply by selling alpha as a “holy grail”.
Clarke, de Silva and Thorley (2002) introduced the concept of a “transfer coefficient” to account for the constraints that active managers face when implementing a smart strategy.
To be precise, a transfer coefficient is the correlation between active weights and forecasted residual returns and it is equal to one in the absence of constraints in portfolio construction. These authors have tested the application of the “fundamental law of ac-tive management” to measure ex-post performance attribution. We have noted that the practical application of the fundamental law of active management remains difficult. In fact, two main reasons regarding the explanation of this problem may be summarized in the following way:
a) The analyst must know the manager’s expected returns, which are not easy to obtain, because they are not formalized in such a way to allow the computation of the “information coefficient” that shows the relationship between the forecasted residual return (alpha) and the one obtained. Furthermore, it signals the quality of skill to avoid potential chances of replicating their hidden strategies.
b) This law is based on the assumption that managers follow the principles of theory developed by the researchers. It would otherwise lead to questionable results. Various studies have proposed methodological approaches and corresponding meas-ures to quantify the level of “managerial activism” and the consequential impact on performance. In general terms, we might identify active investment strategies as those
where managers build a portfolio concentrated in specific markets trying to overperform a selected benchmark.
Cremers and Petajisto (2009) have proposed a measure called active share, which proposes an assessment of the level of active management used by managers. The au-thors indicate the size of the portfolio underweighing the benchmark as the active share and they denote it as a predictor of fund performance. There is a simple rule: funds with the highest active share outperform the benchmark indexes both before and after ex-penses, while funds with the lowest measure underperform their benchmark.
Modern portfolio theory, in the rational context, states that the investors, not only professionals, have to reduce the idiosyncratic risk of their portfolios. On the other hand, active managers could try to build concentrated portfolios because they affirm that some factors, such as country areas, style of management or sectors, could outperform the overall market or a selected benchmark. These strategies are based on the skill of active managers who could have informational advantages in specific sectors.
Bearing this in mind, a positive relation between fund performance and industry con-centration may be observed.
Some researchers (Nanda, Wang and Zheng 2004,), considering that 80% of mutual funds are members of fund families, claim that these funds follow more focused invest-ment strategies due to their informational advantages. These authors find a strong posi-tive spill over effect from a star performer, also because these funds attract money to the other family funds.
Kacperczyk, Sialm and Zheng (2005) analyzed the relation between the concentra-tion and the performance of US active funds from 1984 to 1999 and they found that more concentrated portfolios performed better than diversified portfolios.
Baks, Busse and Green (2006) document a positive relation between mutual fund performance and the willingness of managers to take high risks in a relatively small number of stocks: specifically focused managers outperform 30 biasis points per month or 4 percent per year l, net expenses. They concluded that it is advantageous to invest in these concentrated funds instead of diversified mutual funds.
Huij and Derwall (2011) have compared concentrated funds to diversified funds. They found that the relation between portfolio concentration and performance is driven by the breadth of the fund strategies. In their research based on a dataset of global eq-uity funds they showed that concentrated funds with higher levels of tracking error and breadth had obtained a better result.
Amihud and Goyenko (2013) showed that fund performance could be predicted by R-squared values calculated by a regression of its return on a multifactor benchmark model. Low R-squared values indicate greater selectivity and it is positively associated with fund size.
2. Behavioral implications
Economics has implemented interdisciplinary features by using developments in the fields of sociology and psychology to explain economic behavior of individual agents and whole markets.
The term overconfidence is a well-known bias when an individual shows high con-fidence in his judgement, such as overoptimism, so the likely mistakes are justified by the difference between the accuracy rate and the probability assigned to the correctness of the given answers.
In other cases, overconfidence could be defined as a particular form of wrong calibra-tion, for which the assigned probability, one which would lead to belive that the answers given are correct, exceeds the true accuracy of the answers.
In finance, some puzzles, which are not explained using the standard economic the-ory, are well justified by the overconfidence of investors. These situations cause: wrong valuations on securities, excessive trading volumes and the disposition effect or a ten-dency to sell well-performing stocks and to hold on to losing ones. In behavioral finance, overconfidence is often interpreted in the following ways:
a) as investors overestimating the accuracy of their information or, more specifically, overestimating private signals and underestimating public ones;
b) as investors underestimating the risk.
Research in finance uses both dimensions, either explicitly or implicitly, to generate predictions about the effect of individual overconfidence on economic decisions.
Skala (2008) notes that these two dimensions are often mingled and simply referred to as “overconfidence” in finance literature.
The primary applications of overconfidence in contemporary finance are analyzed from the perspective of financial markets and corporate behavior. This rough definition of overconfidence, as a form of wrong calibration, began in the 1990s. Since then, over-confidence has also become a field of interest for economists, mainly in the context of behavior on financial markets.
The potential presence of overconfidence on the markets and its persistence in the longer term spurred an ongoing discussion on the well-established idea of efficient mar-kets and economic agent rationality.
The existence of overconfidence on financial markets is demonstrated experimentally in varying conditions. The overconfidence of financial experts, including professional traders and investment bankers, proves higher than that of students in different experi-mental tasks (taken from the area of finance) designed by Glaser and Weber (2005). In the behavioural finance models analyzed below, overconfidence is often interpreted as any of these conditions: investors overestimating the accuracy of their information (sometimes, more specifically, overestimating private signals and underestimating pub-lic ones), and/or investors underestimating risk, which, for example, makes them hold
riskier portfolios. Assuming the existence of such (and similar) facets of overconfidence, they are analyzed as their effects on financial markets, including: excessive trading vol-umes, trading profitability, short- and long-term asset miss valuations and stock returns. Various scenarios proving the persistence of overconfidence on the market are also fre-quently modelled.
Odean (1998) assumes that traders, insiders and market makers may unconsciously overestimate the accuracy of their information and rely on it more than is warranted, while traders display the better-than-average effect, evaluating their information as bet-ter than that of their peers. Such overconfident market participants cause an increase in the trading volume.
The same results are demonstrated by Benos (1998) in his model of an auction market with informed traders, where again the participation of risk-neutral investors overesti-mating the accuracy of their information leads to an increased trading volume. Overcon-fidence can also lead to larger market depth and volatility (Odean 1998, Benos 1998), as well as higher market efficiency, lower expected results (utility) of traders, market under the reaction to new information of rational traders (Odean 1998) and more informative prices (Benos 1998). On the other hand, Gervais and Odean (2001) assume that over-confident traders generally make lower gains, as they increase both trading volume and volatility, which in turn negatively affect their trading results.
Its structure and development are currently studied from both a psychological and an economic perspective. Some discussions regarding the origins of overconfidence, its dy-namic or stable character and its dependence on the study context continue in both fields. A parallel issue of considerable interest both to academic and practitioner communi-ties is the overconfidence in stock-picking, which is demonstrated by those fund man-agers who overweigh the portfolio with those securities in which they have a strong belief and perhaps with which they have an emotional commitment. On the one hand, there is evidence that focusing on local risk factors can be regarded as a symptom of managerial skills, especially with regard to the capability of making the best use of the information sets available at that time. Indeed, skilled fund managers could have informational advantages in specific sectors and benefit from them to obtain superior performance by holding more concentrated portfolios and by selecting profitable stocks in specific sectors, once they believe that some country areas, style management or sec-tors will outperform the overall market. On the other hand, we might consider the lack of diversification in portfolios as a form of possible managerial overconfidence, that is, those managers who overestimate their own abilities to beat the market. For example, some small and unskilled fund managers might be tempted to take very large random risks in an attempt to “win the lottery,” become a top-performing fund, and attract large inflows. This overestimation of their skills results in the investment in specific risk fac-tors – secfac-tors or management styles – overweighing or underweighing the corresponding
benchmark standard loadings. This may result in large losses or even just disappointing results – such as it appears in our case, where we do not find a statistically significant result in terms of overperformance. This underlines the evidence that this overestimation of their skills is the result of their stubborness. It bears to mention some definitions re-lated to activism and overconfidence that were used here. Active managers are assumed not to diversify, but to focus on securities about which they have information and feel confident in order to beat the market and to earn a positive alpha. As for overconfidence, we assume it to be a risk perception which is distorted by subjective experience. A non-financial example is the perception of the risk of driving a car against that of flying, which might be biased for those who do not fly often. Self-declared confidence has to be compared with true accuracy. In the well-known Oskamp experiment, “accuracy did not increase significantly with increasing information, but confidence increased steadily and significantly”. Therefore, when summing up the overconfidence of traders, we might say that information on which judgements are based might be a source of overconfidence, which can affect the informed and active traders analyzed here.
3. Methodology for empirical analysis
In order to investigate the relationship between local bias and activism, we measure the stock picking selection of the local managers managing domestic funds against non-local managers. The idea is that local information can be exploited with an active manage-ment strategy by a local manager, but at the same time, an overconfident manager will be too focused on the specific stocks for which he or she believes to possess superior information. In discriminating funds by manager nationality, we follow an idea outlined in Fasano and Galloppo (2015), the novelty of our study is the introduction of a quintile approach.
Control with a global index is needed to capture portfolios not replicating local-in-dex, but which are still passive with respect to a global index.
Our data set consists of Bloomberg weekly equity fund quotes for the BRIC area dur-ing the window of 2009-2015.
Fund data is clustered according to three fields: • Fund Domicile;
• Geographic Focus; • Manager Location.
These data are individually collected for the four BRIC countries: Brazil, China, India and Russia.
The following local benchmarks are used:
• IBOV: Brasil Sao Paulo Stock Exchange Index;
• MICEX: (Ticker INDEXCF) 50 most liquid Russian stocks; • NIFTY: India National Stock Exchange CNX Index;
• SHSZ300: Shanghai Shenzhen CSI 300 Index; • S&P 500: NYSE or NASDAQ S&P 500 Index. Specifically, the following model is observed: rti=α+βxt+γgt+ϵti
where:
rti is the return of the i-th fund with respect to time t; xt is the return of the local index with respect to time t; gt is the return of the global index with respect to time t.
This model is run for each BRIC country and segregates the fund population into: • Domicile, the fund is domiciled in the given BRIC country;
• Geofocus, the fund declares focusing in the given BRIC country;
• Local Manager, the fund manager is local with the respect to the fund managed; • Non-Local Manager, the fund manager is not local with the respect to the fund
managed.
After running the model with respect to the i-th fund, we cluster regression results by quintiles of the local index beta and we analyze the average coefficients for each quin-tile. The benefit of this approach is in the way the survivorship bias is dealt with. The fund time series are normally in the form of unbalanced panels. This format makes the pooling of and the consequent application of the related panel data approach difficult. Some funds start before others and or end after. This entails missing values in the data sets, which are not random and therefore cannot simply be removed; at the same time, they are not replaceable with some consistent method or model, as funds are inexistent or ceased. Pooling existing data with those funds which survive in whole period of the analysis means selecting the best performers and therefore overestimating the perfor-mances. On the other hand, by running individual regressions, each fund is evaluated for its actual performances with respect to the period of its actual existence. Funds with poor performances will still be taken into account for overall data set returns.
By comparing the “quintile story” told in the clustered models, we can understand whether funds in different groups have the same allocation strategies. Besides, the com-parisons of coefficients between fund groups, when consistent for most of or all quin-tiles, might act as an informal test supporting the formal p-value logic.
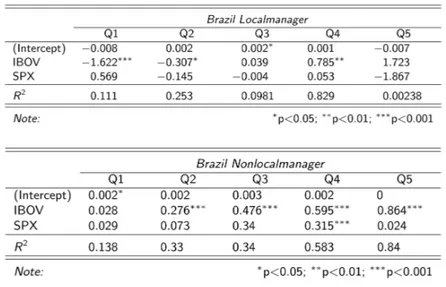
Due to space constraints, we limit data presentation and comments to the local man-agers and non-local manman-agers investing in the BRIC countries, that is, in geo-focused funds in a given BRIC region. Further output data are available on requests. Tables Nos. 1-4 show results for each fund group and country.
67 We start the analysis with Brazil in Table No. 1. Here, for most quantiles, the local index, IBOV, is significant in explaining fund returns. However, when comparing local and non-local managers, we observe quite different behaviors and results. The majority of the local mangers’ investments is scarcely driven by the local market index, both in relative and in absolute terms. Their lowest quintiles even show a negative correlation. Only in the upper two quintiles, this trend is inverted. Therefore, we can say that there is a restricted group of local mangers, focused on passive replicating strategy, while the remaining Brazilian managers tend to neglect strategy based on the local stock index. Locally or non-locally focused Brazilian managers do consistently worse in terms of alpha generation when compared with foreigner managers.
We start the analysis with Brazil in Table 1. Here for most quantiles the local index, IBOV, is significant in explaining fund returns. However, when comparing local and non-local managers, we observe quite different behaviours and results. The majority of the local mangers’ investments is scarcely driven by the local market index, both in relative and in absolute terms. Their lowest quintiles even show a negative correlation. Only in the upper two quintiles, this trend is inverted. Therefore, we can say that there is a restricted group of local mangers, focused on passive replicating strategy, while the remaining Brazilian managers tend to neglect strategy based on the local stock index. Whether locally or non-locally focused Brazilian managers do consistently worse in terms of alpha generation when compared with foreigner managers.
In Table 2, we analyse the China region. Chinese managers follow a more locally focused pattern and a smoother one too. The local Shanghai Shenzhen CSI 300 index is always significant in explaining
TABLE No. 1. Brazilian Funds
We start the analysis with Brazil in Table 1. Here for most quantiles the local index, IBOV, is significant in explaining fund returns. However, when comparing local and non-local managers, we observe quite different behaviours and results. The majority of the local mangers’ investments is scarcely driven by the local market index, both in relative and in absolute terms. Their lowest quintiles even show a negative correlation. Only in the upper two quintiles, this trend is inverted. Therefore, we can say that there is a restricted group of local mangers, focused on passive replicating strategy, while the remaining Brazilian managers tend to neglect strategy based on the local stock index. Whether locally or non-locally focused Brazilian managers do consistently worse in terms of alpha generation when compared with foreigner managers.
In Table 2, we analyse the China region. Chinese managers follow a more locally focused pattern and a smoother one too. The local Shanghai Shenzhen CSI 300 index is always significant in explaining fund returns, for both local and non-local managers. At the same time, the local index coefficient
68
In Table No. 2, we analyze the China region. Chinese managers follow a more locally focused pattern and a smoother one, too. The local Shanghai Shenzhen CSI 300 index is always significant in explaining fund returns, for both local and non-local managers. At the same time, the local index coefficient estimates are consistently higher than the esti-mates relative to foreign managers. Even in the lowest quintile, there is a positive beta. We do not observe asymmetric behaviour on the tails, as seen for Brazilian funds. The alpha, while not significant, is substantially null for all quantiles and types of managers. This result can be interpreted as the absence of a (positive) local information effect.
estimates are consistently higher than the estimates relative to foreign managers. Even in the lowest quintile, there is positive beta. We do not observe asymmetric behaviour on the tails, as seen for Brazilian funds. The alpha, while not significant, is substantially null for all quantiles and types of managers. This result can be interpreted as the absence of a (positive) local information effect.
With Table 3 we move to India. As we have seen for the local index in the other BRICs , the Indian SENSEX, is effective in explaining fund returns in terms of p-values for both manager types, except for the lowest local quintile. Apart from this, local managers show consistently lower beta than foreign managers which are more SENSEX-tracker than Indian ones. Indian managers’ strategies are slightly rewarding in the upper quantiles, where foreign managers show a statistically significant negative alpha unlike Indian managers.
TABLE No. 3. Indian Funds
With Table No. 3, we move to India. As we have seen for the local index in the other BRICs, the Indian SENSEX is effective in explaining fund returns in terms of p-values for both manager types, except for the lowest local quintile. Apart from this, local man-agers show consistently lower beta than foreign manman-agers which are more SENSEX-tracker than Indian ones. The strategies of Indian managers are slightly rewarding in the upper quantiles, where foreign managers show a statistically significant negative alpha, unlike Indian managers.
Table No. 4 analyzes the Russian market. Apart from the lowest quintile, the sig-nificance of the local MICEX index in explaining fund performances is confirmed once again. The upper quintile shows a very subtle difference in terms of Russian commitment in local index, but overall Russians are less committed to MICEX than their foreign counterparts. As regards alpha, there are no relevant differences in the two types of man-gers, as for both the average estimate is zero.
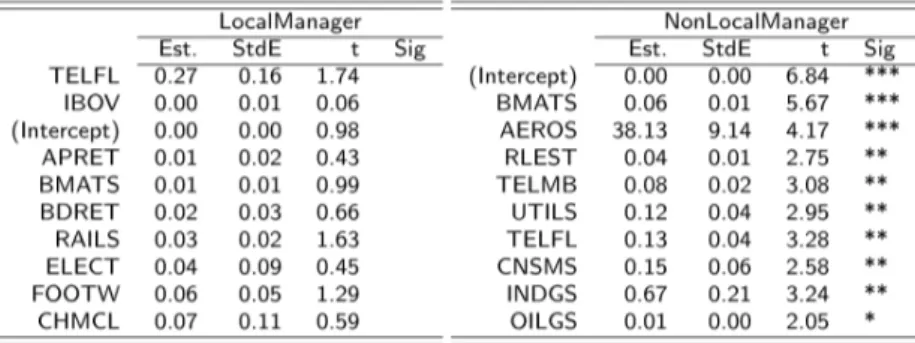
69 To understand better the asset allocation strategies of local and non-local managers, we compare the factor driving their portfolios. Factors are based on the Datastream In-dustry/Sector classification. Datastream ticker mnemonic follows the pattern:
Sector + country = 5+2
For example, OILGSRS stands for “Oil & Gas industry” with respect to Russia. In the regression tables, which are presented below, we remove the 2-character coun-try specification for the sake of readability.
Our objective is to compare side by side the factors for local and non-local managers. To allow a meaningful comparison, we filter regressors by a positive coefficient and order them by p-value significance, filtering by positive coefficients. Given the high number of explicative indices, only the first 10 rows ranked in this way are displayed.
In this case, regressions are pooled and, to overcome autocorrelation and heterosce-dasticity in the error terms, we use the Newey-West estimator.
Tables Nos. 5-8 show results for this type of inference for each country.
estimates are consistently higher than the estimates relative to foreign managers. Even in the lowest quintile, there is positive beta. We do not observe asymmetric behaviour on the tails, as seen for Brazilian funds. The alpha, while not significant, is substantially null for all quantiles and types of managers. This result can be interpreted as the absence of a (positive) local information effect.
With Table 3 we move to India. As we have seen for the local index in the other BRICs , the Indian SENSEX, is effective in explaining fund returns in terms of p-values for both manager types, except for the lowest local quintile. Apart from this, local managers show consistently lower beta than foreign managers which are more SENSEX-tracker than Indian ones. Indian managers’ strategies are slightly rewarding in the upper quantiles, where foreign managers show a statistically significant negative alpha unlike Indian managers.
TABLE No. 4. Russian Funds
Table 4 analyses the Russian market. Apart from the lowest quintile, the significance of the local MICEX index in explaining fund performances is confirmed once again. The upper quintile shows a very subtle difference in terms of Russian commitment in local index, but overall Russians are less committed to MICEX than their foreign counterparts. As regards alpha, there are no relevant differences in the two types of mangers, as for both the average estimate is zero.
To understand better the asset allocation strategies of Local and Non-Local managers, we compare the factor driving their portfolios. Factors are based on Datastream Industry/Sector classification. Datastream ticker mnemonic follows the pattern:
Sector + country = 5+2
For example, OILGSRS stands for “Oil & Gas industry” with respect to Russia.
In the regression tables, which follow, for the sake of readability, we remove the 2-character country specification.
Our objective is to compare side by side the factors for Local and Non-Local managers.
To allow a meaningful comparison, we filter regressors by a positive coefficient and order them by p-value significance, filtering by positive coefficients. Given the high number of explicative indices, only the first 10 rows ranked in this way are displayed.
In this case, regressions are pooled and, to overcome autocorrelation and heteroscedasticity in the error terms, we use Newey-West estimator.
Tables 5-8 show results for this type of inference for each country.
70
Table 4 analyses the Russian market. Apart from the lowest quintile, the significance of the local MICEX index in explaining fund performances is confirmed once again. The upper quintile shows a very subtle difference in terms of Russian commitment in local index, but overall Russians are less committed to MICEX than their foreign counterparts. As regards alpha, there are no relevant differences in the two types of mangers, as for both the average estimate is zero.
To understand better the asset allocation strategies of Local and Non-Local managers, we compare the factor driving their portfolios. Factors are based on Datastream Industry/Sector classification. Datastream ticker mnemonic follows the pattern:
Sector + country = 5+2
For example, OILGSRS stands for “Oil & Gas industry” with respect to Russia.
In the regression tables, which follow, for the sake of readability, we remove the 2-character country specification.
Our objective is to compare side by side the factors for Local and Non-Local managers.
To allow a meaningful comparison, we filter regressors by a positive coefficient and order them by p-value significance, filtering by positive coefficients. Given the high number of explicative indices, only the first 10 rows ranked in this way are displayed.
In this case, regressions are pooled and, to overcome autocorrelation and heteroscedasticity in the error terms, we use Newey-West estimator.
Tables 5-8 show results for this type of inference for each country.
TABLE No. 6. China: Comparison of factors driving local and non-local managers
We now take into account the relative manager performances, that is the performance adjusted with risk. To this end, we use the Sortino-Satchel index, using the local index as benchmark.
Given the performance of the fund and the benchmark (local index), , the Sortino-Satchel index for q =0 is obtained.
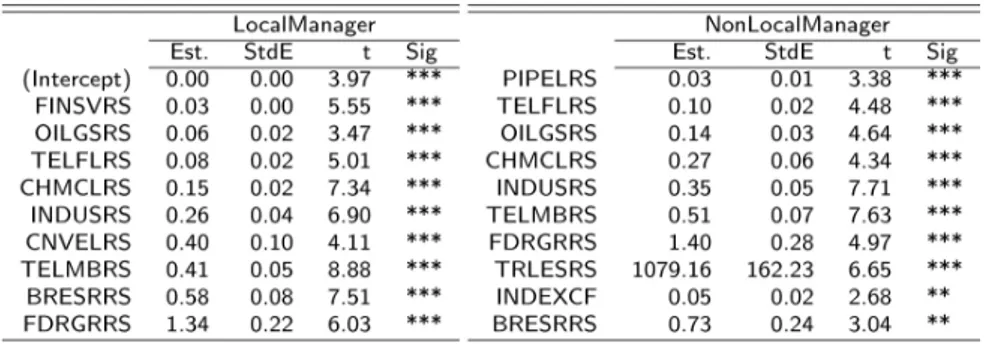
TABLE No. 7. India: Comparison of factors driving local and non-local managers
TABLE No. 8. Russia: Comparison of factors driving local and non-local managers
We now take into account the relative manager performances, which is the perfor-mance adjusted with risk. To this end, we use the Sortino-Satchel index, using the local index as benchmark.
We now take into account the relative manager performances, that is the performance adjusted with risk. To this end, we use the Sortino-Satchel index, using the local index as benchmark.
Given the performance of the fund and the benchmark (local index), , the Sortino-Satchel index for q =0 is obtained.
, with q > 0.
Given the performance of the fund and the benchmark (local index), the Sortino-Satchel index for q =0 is obtained.
71
We now take into account the relative manager performances, that is the performance adjusted with risk. To this end, we use the Sortino-Satchel index, using the local index as benchmark.
Given the performance of the fund and the benchmark (local index), , the Sortino-Satchel index for q =0 is obtained.
Conclusions
The analysis shows that, on average, the local index is significant in explaining the fund returns, while the global index is rarely a key in explaining fund performances, but on some occasions it is statistically significant for non-local mangers investing in the BRIC area, possibly as a form of diversification. The most interesting aspect here is the com-parison between the funds explicitly focused on a BRIC country and those which are simply manged by a local manager. In this case, different countries show different be-havior patterns.
With regard to Brazil, their investment pattern in terms of quintile are strictly differ-ent from their foreign counterparts and it is definitely less Brazil-cdiffer-entered than actual geofocused funds. Differently, Chinese managers show a symmetric pattern: they al-locate their wealth in different buckets, when compared to non-Chinese managers, but they are more inclined to domestic investments. Even at the lowest quantile, the local index still has a positive and significant coefficient explaining their fund returns, con-trasting foreign managers who, despite being geofocused or domiciled in China, show a negative relationship in the first quintile. Indian SENSEX coefficients are always posi-tive and generally highly significant (except for the lowest bucket). This, however, does not entail an actual home bias, as non-local managers show an even stronger propensity to the local index for all quintiles. Finally, the investment allocation pattern of Russian managers with respect to the Russian MICEX index is very similar to foreign managers investing in Russia, but Russians are slightly less focused in domestic assets, except for the highest quintile.
Risk-Adjusted Performance Relative to Benchmark
Brazil China India Russia
0.08 0.04 0.00 -0.04 Sortino-Satchell Ratio Domicile Geofocus Local manager Non Local manager
The “ultimate” overconfidence test lies in the results of the investment policies, which might reveal the ability to produce an alpha on behalf of those who choose to focus on the domestic assets.
Brazilian managers do worse in terms of alpha than non-local managers. This differ-ence is small, but persistent in all quintiles. For the Chinese, there is no significant and/ or persistent difference in any direction.
Indian managers obtain slightly better results than foreigners do and, while there is no evidence of them generating a true alpha, in five out of five quantiles they rank above non-local managers. Russian managers, too, can do better than their foreign counter-parts, again without producing a statistically significant alpha.
Overall, there is no pay-off in terms of alpha when the beta is higher, but distancing from the market index does not generate any alpha either. For all groups and countries, better alpha values are always visible in the central quantiles.
Comparing the performances with the asset allocation, we see that Chinese invest-ments present a home bias in the terms described here. While this might suggest they are trying to obtain an advantage by exploiting domestic information for which they have less access barriers, they are not able to turn this information into systematically better results. Under this perspective, these outcomes might also be regarded as a bias, mean-ing that these managers are too confident in light of the local information they possess.
As regards the sectors driving the fund portfolios, we observe that local and non-local managers show non-overlapping rankings, although some common factor weighings are often observable, for example, the Footwear Industry is always ranked third in India, and the Oil and Gas sector always ranked third in Russia.
Finally, when using the risk adjusted performance index (Sortino-Satchel), local managers appear to have better leverage on the domestic information by better assessing local risks. This is true for all BRICs, except for China.
REFERENCES
Aloui, R.; Aissa, M. S. B. & Nguyen, D. K. (2011), ‘Global financial crisis, extreme interdepend-ences, and contagion effects: The role of economic structure?’, Journal of Banking & Finance 35(1), 130–141.
Amihud, Y. & Goyenko, R. (2013), ‘Mutual fund’s R2 as predictor of performance’, Review of
Financial Studies 26(3), 667–694.
Atale, N. (2012), ‘A Decade of BRICS: Prospects and Challenges for Next Decade’, Indian Journal
of Management, Forthcoming.
Benos, A. V. (1998), ‘Aggressiveness and survival of overconfident traders’, Journal of Financial
Markets 1(3), 353–383.
Buffett, W. (2016), “Buffett on Diversification, Risk and Focus.” Available at http://rayhightower. com/blog/2016/09/02/buffett-diversification-risk-focus/.
Busse, J. A.; Green, T. C. & Baks, K. (2007), “Fund managers who take big bets: Skilled or over-confident”, AFA, working paper
Clarke, R.; De Silva, H. & Thorley, S. (2002), ‘Portfolio constraints and the fundamental law of active management’, Financial Analysts Journal 58(5), 48-66.
Cremers, K. J. M. & Petajisto, A. (2009), ‘How active is your fund manager? A new measure that predicts performance’, Review of Financial Studies 22(9), 3329-3365.
Fasano A, and Galloppo G., (2015) “Active Investing in BRIC Countries”, Procedia - Social and Behavioral Sciences (Elsevier), 448-454.
Gervais, S. & Odean, T. (2001), ‘Learning to be overconfident’, Review of Financial studies 14(1), 1-27.
Glaser, M. & Weber, M. (2005), ‘September 11 and stock return expectations of individual inves-tors’, Review of Finance 9(2), 243-279.
Goldman Sachs (2010) “Progress is everyone’s business” Global Annual report http://www.gold-mansachs.com/investor-relations/financials/fulfillment/reports/2010-annual-report.pdf
Grinold, R. C. & Kahn, R. N. (2000), “Active portfolio management”, McGraw Hill New York, NY. Gurdgiev, C. & Trueick, B. (2016), “Crisis Contagion from Advanced Economies into BRIC: Not as Simple as in the Old Days’ Lessons from the Great Recession: At the Crossroads of Sustainability and Recovery”, Emerald Group Publishing Limited, 1-20.
Huij, J. & Derwall, J. (2011), ‘Global equity fund performance, portfolio concentration, and the fundamental law of active management’, Journal of Banking & Finance 35(1), 155-165.
Kacperczyk, M.; Sialm, C. & Zheng, L. (2005), ‘On the industry concentration of actively managed equity mutual funds’, The Journal of Finance 60(4), 1983-2011.
Nanda, V.; Wang, Z. J. & Zheng, L. (2004), ‘Family values and the star phenomenon: Strategies of mutual fund families’, Review of Financial Studies.
Odean, T. (1998), ‘Are investors reluctant to realize their losses?’, The Journal of Finance 53(5), 1775-1798.
Skala, D. (2008), ‘Overconfidence in psychology and finance-an interdisciplinary literature re-view’, Bank i Kredyt (4), 33-50.