UNIVERSITY OF SIENA
Department of Biotechnology, Chemistry and Pharmacy
PHD SCHOOL IN BIOCHEMISTRY AND MOLECULAR
BIOLOGY, XXXIII CYCLE
PhD coordinator: Prof. Lorenza Trabalzini
Recovery of rare cells and single cells
analysis : different opportunities and
challenging applications
S.S.D: BIO/10
Tutor: PhD student:
Prof.ssa Ottavia Spiga Rebecca Maiocchi
Dott.ssa Cristina Tinti
Prof.ssa Paola Ricciardi-Castagnoli
Vivere momento per momento, volgersi interamente alla luna, alla neve, ai fiori di ciliegio e alle foglie rosse degli aceri, cantare canzoni, bere sake, consolarsi dimenticando la realtà, non preoccuparsi della miseria che ci sta di fronte, non farsi scoraggiare, essere come una zucca vuota che galleggia sulla corrente dell’acqua: questo, io chiamo ukiyo. Asai Ryōi, Racconti del mondo fluttuante (Ukiyo monogatari – 1662)
A Kyoto Il mio 清水 の 舞台 から 飛び降りる
INDEX
ABSTRACT ... 8
STUDY 1: SINGLE-CELL RESOLUTION FOR PRECISION DIAGNOSTICS AND NEW THERAPIES ... 10
Introduction ... 10
Personalized Medicine ... 10
Single-cell omics ... 11
Recovery of single cells ... 15
Biomarkers and monoclonal antibodies: powerful weapon for Personalized Medicine 22 Materials and Methods... 29
Cell cultures ... 29
Plasmid Design ... 29
Heat shock bacterial transformation and plasmid extraction, precipitation and quantification ... 30
Transfection and supernatant recovery ... 31
FACS staining ... 32
TLS1 stable clone (F4) creation ... 33
Purification of IgG-tagged protein ... 34
Ides/IdeZ cleavage ... 34
Lightning-Link APC/R-PE Conjugation ... 35
Mice’s immunization ... 35
Purification of HIS-tagged protein ... 35
Protein quantification ... 36
Volume reduction and concentration ... 37
SDS-PAGE and Westen Blot ... 37
ELISA test ... 39
Antigen-specific plasma cells identification ... 39
RT and TAP-PCR ... 41
Sequencing ... 47
Peptide mass fingerprint (PMF) ... 48
Results ... 49
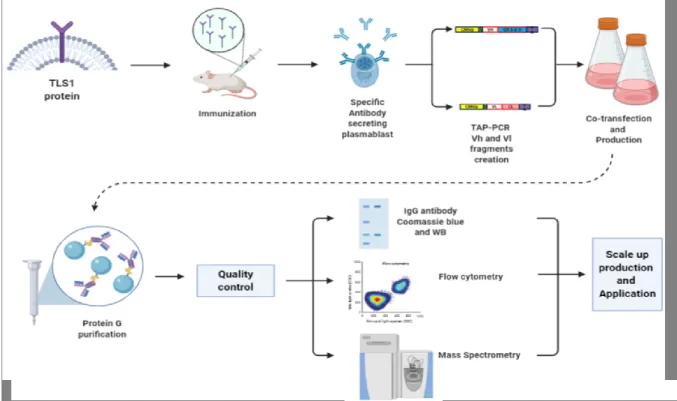
Graphic experimental workflow ... 49
Plasmids design ... 49
Expression and purification of TLS-L-ECD-hIgG1e1-F ... 50
Expression and purification of TLS-L-ECD-HIS ... 53
Expression of 3xFLAG-TLS1full-pEF5-F and creation of the stable clone F4 ... 54
Balb/c Mice immunization ... 56
TLS1 antigen-specific plasma cells identification ... 58
Optimization of Expi293 transfection with pCDM8-GFP plasmid in 96 Deepwell plates 62 Assessing best promoter, poly-adenilation and leader sequences to create TAP-PCR products ... 64
Single plasma cell RT-PCR and TAP-PCR constructs creation ... 69
Transfection into Expi293 cells in Deepwell plate and verification ... 71
Sequencing of recombinant TAP-PCR Vh and Vl ... 72
Cloning in plasmid, expression and purification of recombinant Vh and Vl ... 73
Transfection into Expi293 cells in flasks and production of α-TLS1 mAb ... 73
Purification, concentration and quantification of α-TLS1 mAb ... 75
Activity and specificity tests of α-TLS1 mAb ... 76
Discussion ... 81
STUDY 2 – CD8+ T CELLS EXHAUSTION: FIRST INSIGHTS FOR FUTURE SINGLE-CELL OMICS APPLICATION ... 83
Introduction ... 83
Materials and Methods... 88
Cell cultures ... 88
Animals ... 88
Murine CD8+ T cell isolation ... 88
Human PBMC isolation ... 89
RNA isolation and RT-PCR ... 89
PCR ... 89
Cloning ... 90
CRISPR/CAS9 ... 92
Sequencing ... 92
Electroporation ... 94
Flow cytometry analysis... 94
Intranuclear staining ... 95
qRT-PCR ... 95
Measurement of oxygen consumption rates and extracellular acidification rate ... 95
Results ... 97
Overexpression of TFX ... 98
TFX genes contain many mutations ... 99
TFX overexpression correlates with PD-1, γH2AX and cell death... 102
Creation of pMXS-TFX-EGFP vectors ... 104
KO of TFX ... 105
Creation of pGuide-it-ZsGreen1 vectors ... 107
TFX -/- doesn’t change inhibitory receptors expression ... 109
TFX reduction confirms a metabolic change in GFP+ sorted cells ... 110
Discussion ... 112
BIBLIOGRAFY ... 114
ABSTRACT
Single-cell biology is a new discipline which aims to address and solve the problem of cellular heterogeneity. Single-cell omic, which allows the molecular investigation of different cell types in a high throughput manner, is driving the Precision Medicine approaches.
Single B cell isolation strategies, the starting points of the single-cell omics, have become essential research procedures for efficiently sampling the natural repertoire of immunized animals and humans (Tiller et al, 2008). The goal of the first study is to demonstrate the feasibility of a novel approach to rapidly generate recombinant mAbs recovering rare antigen-specific plasma cells from complex samples derived from immunized mice. TLS Foundation, where this work has been carried out, has recently invested in Precision Medicine activities and, in particular, in the development of an alternative method to hybridomas technology to isolate rare antigen-specific B cells from blood of immunized or infected individuals. In Study 1 we have set-up a FACS sorter-free method for a fast identification and isolation of antigen-specific plasma cells producing IgG with unique and desirable features and, moreover, we have obtained high yield TAP-PCR products. This could simplify the actual hybridomas technology procedure for the identification and molecular cloning of antigen-specific antibodies from single-B cells.
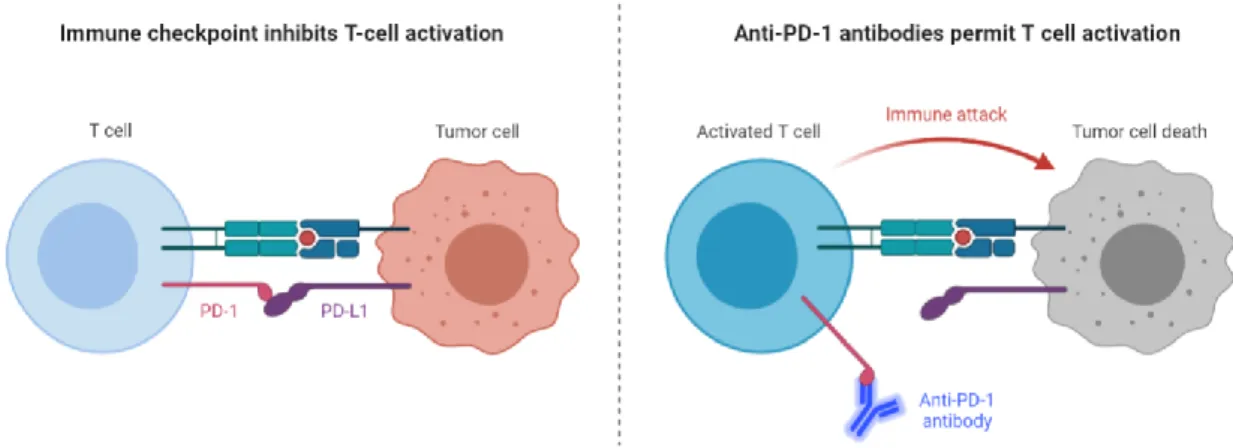
Single-cell biology is also used to address and solve problems related to tumour heterogeneity. Cancer is one of the research areas that has greatly benefited from single-cell analysis. The complexity of immune responses to cancer has hampered the development of novel therapeutical approaches with the exception of monoclonal antibody based-therapies that target specific immunomodulators. In the last 10 years PD-1 blockade monoclonal therapy has indeed revolutionized cancer treatments but a substantial population of patients is still unresponsive. To rescue unresponsive patients, the mechanism of unresponsiveness and phenotype must be elucidated. The second part of this work (Study 2) deals with the possibility to reveal one of the
mechanism responsible for T cells exhaustion in patients that are non-responsive to monoclonal anti-PD-1 therapy. We demonstrated that there is a correlation between the overexpression of TFX (Transcriptional Factor X, the real name of the factor has been hidden for confidentiality issues) and the onset of the characteristic features of exhaustion. Indeed the KO of this gene restores in T cells their functionality through a more active metabolism. Further in-depth study of the modulation of this transcription factor may elucidate the pathways and the genes responsible for the exhaustion phenotype in T cells.
STUDY 1: SINGLE-CELL RESOLUTION FOR
PRECISION DIAGNOSTICS AND NEW
THERAPIES
Introduction
Personalized Medicine
In the last few years the “one-size fits all” healthcare approach (Lehrach, 2015) has been questioned. The individual molecular landscape of the patient has been taken into account when looking at the effectiveness and safety of therapies. We know that patients do not respond to therapies and drugs in the same way (Hafen et al., 2014; Lehrach, 2015; Roden, 2015) for their different genomic and epigenomic profiles (Leyens et al., 2014).
Personalized Medicine is currently an exciting topic in medicine. The concept of Personalized Medicine was introduced for the first time on April 16th, 1999, in a short article appeared in The Wall Street Journal (Langreth et al., 1999). Personalized Medicine is a value-based, patient-centric paradigm that has the potential to deeply transform medical interventions by providing ‘the right drug, with the right dose at the right time to the right patient’ (Sadée et al., 2005), based on the genomic, epigenomic and proteomic profiles of an individual, whilst also remaining mindful of a patient's personal situation.
Thus, the main aims of Personalized Medicine are:
to favour research and understanding a wide range of diseases;
to identify the causes of different responses to drugs (pharmacogenomics) commonly used to treat different patients;
to identify biological markers able to objectively and accurately describe signals of the risks of developing specific diseases.
According to the FDA, the aim of Personalized Medicine is to elevate benefits and reduce risks to patients by targeting prevention and treatment more effectively. It does not seek to establish novel medication for patients, but to stratify individuals into
11 subpopulations that vary in their response to a therapeutic agent for their specific disease. Increased utilisation of molecular stratification of patients, for example assessing for mutations that give rise to resistance to certain treatments, will provide medical professionals with clear evidence upon which to base treatment strategies for individual patients (Mathur et al., 2017). Furthermore, the power of Personalized Medicine lies not only in treatment, but in prevention.
In fact, the term “stratification” delineates the identification of a group of patients with similar biological characteristics and who could respond to a same drug in a similar way (Laifenfeld et al., 2012) and this would be possible via identification of biomarkers. With this development, there will no longer be a dependence on the adverse outcomes of trial and error prescribing methods (Vogenberg et al., Part1 and Part2 , 2010).
Biomarkers are biological indicators which could have a specific molecular, anatomic, physiologic, or biochemical character, which can be detected and evaluated accurately (Biomarkers Definition Working Group, 2001). They play a key role as indicators of an ordinary or a pathogenic biological process, having a specific physical characteristic or a biological changing produced.
Personalized Medicine is an innovative approach towards delivering improved healthcare and reducing overall healthcare costs. This would be achieved by implementing the digitalization of healthcare, by improving the healthcare IT system and by introducing innovative technologies, such as developing single-cell omics, which permit the investigation of different single-cells in a high throughput manner (Hood et al., 2003).
Single-cell omics
Probing cellular population diversity at single-cell resolution became possible only in recent years and it helped to answer biological questions with unprecedented resolution. The popularity of single-cell “omics” approaches, which allow researchers to dissect samples heterogeneity and cell-to-cell variation, continues to grow. Single-cell omics are becoming increasingly prevalent, thanks to the continuous and rapid
12 technological improvements, and contribute to the discovery of new and rare cell types and to the deciphering of disease pathogenesis and outcome.
Animal tissues are heterogeneous, encompassing numerous types of cells with unique functions, features and stages of differentiation. So far, the study and the understanding of homeostatic or pathologic mechanisms progressed by studying cell population in bulk but, in this way, the analysis revealed only the average features of the population and could hide the cell-to-cell variability present in all tissues which have direct and significant consequences on the cell function (Altschuler and Wu, 2010; Strzelecka et al., 2018), but also the importance of rare populations. A deep understanding of cellular variability and the impact of this variability in tissue function will allow us to understand how changes in cellular dynamics can influence the entire organism and even lead to cancer, diabetes, metabolic disorders and accelerated ageing (Cheung et al., 2018; Ecker et al., 2018; Enge et al., 2017; Hurria et al., 2016). In parallel, isolation and characterization of rare cell populations may uravel different sensitivity to therapies but also identify novel accurate biomarkers.
Recent advantages in methodology and cost effectiveness of high-throughput ‘omic’ technologies have enabled their application to the study of single cells, allowing a complete and unbiased analysis of the content of individual cells.
Individual –omic, as well as the integrated profiles of multiple -omes, such as the genome, the epigenome, the transcriptome, the proteome, the metabolome, the antibodyome, and other omics information, are expected to be valuable for health monitoring, preventative measures, and for the application of the Personalized Medicine paradigm (Chen et al., 2013).
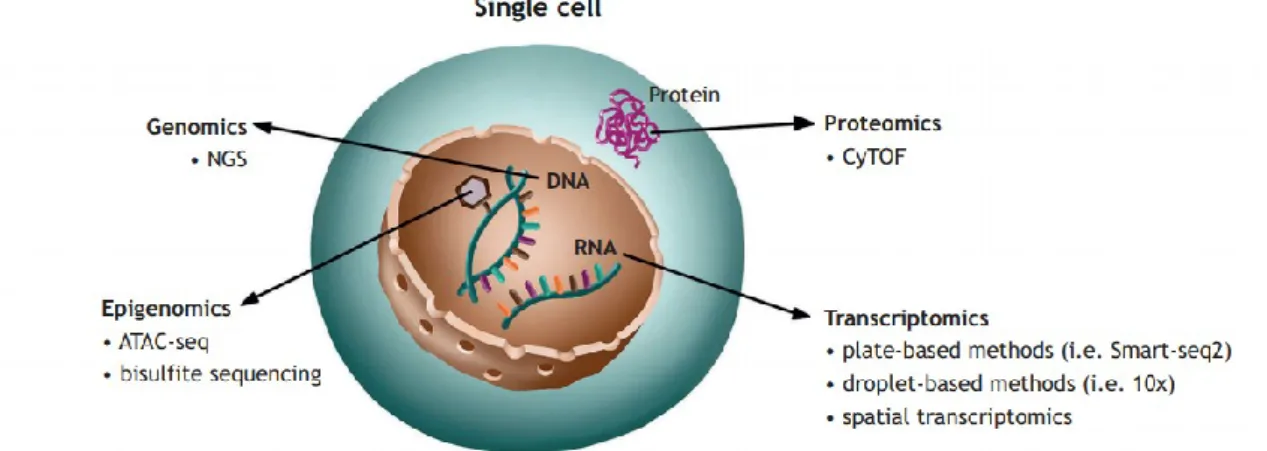
Diverse approaches for studying different “layers” of single-cells have been developed (Fig.1):
Single-cell genomics: this technology could be used to resolve the variation between individual cells at the genomic level, including the analysis of single-nucleotide variants (SNVs) and subchromosomal copy-number variants (CNVs), but also somatic mutations and insertions or microdeletions. Several amplification methods have been developed for single-cells DNA sequencing
13 (Gawad et al., 2016; Wang and Song, 2017) allowing researchers to reconstruct cell lineages and to study genetic alterations of rare cell types, such as cancer stem cells (CSCs). Indeed, cancer biology is one of the research areas that greatly benefited from the application of single-cell DNA sequencing;
Single-cell epigenomics: the identification of epigenetic events at the single-cell level is particularly informative during development where key epigenetic signatures correlate to active or inactive transcriptional states (Clark et al., 2016);
Single-cell transcriptomics: single-cell RNA sequencing (scRNA-seq) technologies have also advanced. These technologies rely on the conversion of RNA into complementary DNA, which is then amplified to obtain large enough quantities for sequencing. Studying the transcriptome of individual cells is a useful tool since it allows an unbiased determination of the cell state, representing a step forward from the use of cell surface markers, wherein cells that homogeneously express such markers can differ substantially in their transcriptome, state and function (Altschuler and Wu, 2010). A wide adoption of scRNA-seq approaches have shifted the application of this method from descriptive analyses of cell heterogeneity towards the understanding of disease mechanisms, to the discovery of new biomarkers to be used in research (Strzelecka et al., 2018);
Single-cell proteomics: Proteome analysis at the single-cell level could provide essential information on the actual state and function of a cell. However, analysing the protein content of a single cell is still challenging, even if approaches based on FACS, single-cell mass spectrometry, liquid chromatography and tandem mass-spectrometry have been successfully applied (Strzelecka et al., 2018);
14 Single-cell multiomics: this discipline integrates of data from diverse single omics platforms, providing muti-faceted insight into the interrelation of these omics “layers”. Such parallel analysis of the genome and transcriptome is appealing as it allows to link the genotype of a cell to its phenotype.
Fig. 1. Schematic representation of single-cell omic technologies. Combined information about
the transcriptome, genome, proteome and epigenome of a single cell, obtained with constantly evolving technologies, will drive the progress of personalised medicine and generation of improved targeted therapies.
As single-cell multi-omics technology becomes progressively high throughput, computational resources and time needed for processing the raw data will be an important aspect. Raw files for each omic type must be separately processed, aligned, filtered and quality-controlled in a manner that accounts for complications inherent in single-cell measurements, such as low signal-to-noise ratio, technical amplification artifacts and technical variation (Bock et al., 2016). Each omics layer of processed data is then assigned back to the single cell and co-analyzed with both mathematical and statistical models to reveal patterns of regulation. Pipelines and new algorithms that treamline and shorten the computational time needed for a data processing will be essential for increasingly complex, multi-dimensional experiments (Hu et al., 2018). The harmonization and standardization of single-cell technologies will lead to unprecedented discoveries and translational applications from bench to clinic (Shalek and Benson, 2017; Strzelecka et al., 2018; Wang and Song, 2017).
Single-cell genomic and epigenomic techniques have become necessary for early disease detection, accurate diagnosis and prognosis, monitoring disease progression in
15 tissues, paving the way for personalized treatment and next-generation health care (Kamies and Martinez-Jimenez, 2020).
Recovery of single cells
At present, the isolation and separation of rare single cells is still a technically challenging task. Main challenges are the yield and quality or, in other words, the integrity and purity of the cells as well as the throughput and the sensitivity of single cell isolation methods (Gross et al., 2015). Another challenge with rare cells is the enrichment procedures that are necessary when the target cells have a frequency below one out of one million contaminants.
Then, isolating multiple types of molecules from a single cell is the starting point for single-cell omics measurement.
The first step is to collect a single cell randomly from a heterogeneous population. The standard protocol is based on the disaggregation of complex biological matrices into a single intact and viable cell by mechanical or enzymatic dissociation and, in a second step, to capture single cells from the dissociated cell suspension.
Several approaches can be used and rely on different working principles, mainly physical and biological properties, including size, density, cellular charge, and specific expression of cellular markers, including serial dilution, robotic micromanipulation, flow-assisted cell sorting (FACS) and microfluidic platform (Wang and Navin, 2015). The outcome of this first collection step is critical and many limitations persist, despite the rapid development of new techniques. One of them is the variations induced by sample processing (van den Brink et al., 2017). Currently new protocols that minimise dissociation-induced gene and protein expression changes are being developed (Lambrechts et al., 2018). Moreover, generation of single-cell suspensions that are representative of the initial cell population of interest, including the spatial contextualisation, is still challenging.
Technologies for single-cell separation can be briefly classified according to their: • Level of automation, distinguishing manual methods from automated devices
16 • Ability to isolate specific/individual cells, distinguishing statistical methods
from a targeting specific rare populations one;
• Compatibility with certain future application requirements, distinguishing technologies mainly applied for production of monoclonal cell cultures (derived from single cells) from technologies preferably used for single-cell genome/proteome analysis (Gross et al., 2015).
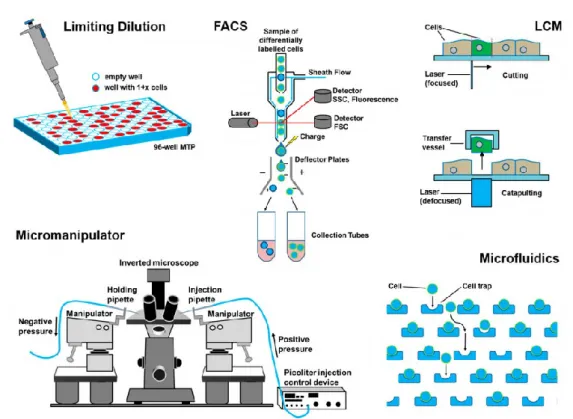
In general, the method to be applied strongly depends on the nature and origin of the sample and the processing or analysis to be performed on the cells once being isolated. The most widespread technologies used for the handling of single-cells are (Fig.2):
• Limiting Dilution: Due to the statistical distribution of cells in a suspension, the number of cells in a highly diluted sample can be as low as one per aliquot, when the suspension is split into small volumes (aliquots). Such seeding of cells in low concentration is indeed simple to carry out with standard pipetting tools, but it is not very efficient since the probability of achieving a single-cell in an aliquot is of statistical nature and the technique is subjected to manual errors. The probability to obtain a certain number of cells per aliquot (i.e., 0, 1, 2, etc.) is described by Poisson’s distribution (Staszewski, 1984). In order to confirm the presence of one single cell per well, an additional control step (e.g., by microscopy) is required (Gross et al., 2015). The advantages of serial dilution include the simplicity and manual operator’s immediacy of moving single cells from the cell suspension to individual reaction chambers. This helps limit the degradation of more volatile molecules such as RNA or protein and may reduce the possibility of non-physiologic changes in chromatin accessibility and conformation (Wang and Navin, 2015; Svensson et al., 2017), but it results time/effort consuming.
• Flow cytometry: FACS systems employ laser excitation to exctract information by fluorescent staining. Indeed, cell suspensions are pressure driven through a flow cell and then the cell stream rapidly passes by a laser which gives signal,
17 which, on their turn, are converted into cells’ respective physical, chemical, or optical properties often enhanced by synthetic markers such as fluorescent dyes. This approach results more expensive for this reason. Apart from size analysis and counting, the bypassing cells can also be sorted. After the analysis, the cell stream is forced through a small nozzle (typically 60–100 µm orifice diameter) and, applying ultrasound vibrations, it is broken in droplets, some of which carry cells. Using electrically charged plates, these droplets can be guided to a collector vessel. FACS technology is nowadays an accepted, worldwide standard in analysis and sorting of cell populations (Underwood et al., 1988; Herzenberg et al., 2002. Nevertheless, for certain applications, FACS systems are still limited: cells must be in suspension, so tissues need to be dissociated resulting in loss of cellular functions and cell-cell interactions as well as tissue architecture (Jahan et al., 2012); Subpopulations with similar marker expression are difficult to differentiate and overlap of emission spectra between fluorochromes may lead to an increasing noise level and difficulty for a good separation of sub populations; Further, FACS sorting may have non-negligible effects on cell viability.
•
Laser capture microdissection (LCM): it is an advanced technique to isolate individual cells or cell compartments from mostly solid tissue samples which are fixed in formalin, embedded in paraffin, or cryo-fixed (Emmert-Buck et al., 1996; Espina et al., 2007; Esposito, 2007). Using a microscope, the target cells are identified on a tissue section. The operator marks the section to be cut off on the display by drawing a line around it. Along this trajectory the laser cuts the tissue and the isolated cell (or compartment) is extracted. Analysis of solid tissue is of great interest when investigating heterogeneous tissue sections regarding their cellular structure as well as physiological and pathological processes (Fink et al., 2006). In oncology, the correlation of molecular information obtained from single-cells with their location in the tissues has become an important research field. In combination with immune histological staining, LCM is a powerful tool for solid sample analysis at the single-cell level18 (Nakamura et al., 2007). However, for full exploitation of this technology, the spatial mapping of single-cell in the tissue is required. Moreover proceeding with the extraction, single-cell integrity might be compromised (Liu, 2010) but also some contaminants as adjacent cells could be transferred together.
•
Manual Cell Picking: it consists in micromanipulators which, combined with a microscope and micro-pipettes, to pick cells manually form suspensions in dish or well-plate. Micropipettes are made of ultrathin glass capillaries coupled to an aspiration and dispensation unit. Via microscope observation the operator selects a specific cell, moves the micro-pipette in close proximity and aspirates the cell by applying suction to the micropipette. The aspirated liquid volume, including the selected cell, can be transferred to a collection vessel, where it is released by dispensation. Similar to LCM systems, the targeted isolation of a specific cell under microscope vision is one of the key benefits of this technology. However, the manual process limits the throughtput and it should always be coupled with an additional microscope to confirm that the single-cell has been successfully transferred (Gross et al., 2015).•
Microfluidics (Lecault, 2012): several microfluidic devides have been proposed for single-cell analysis and all of them have been created following one of the following microfluidic principles to extract single cells:• Droplet-in-oil-based isolation (Brouzes et al., 2009) which uses channels filled with oil to hold separated aqueous droplets (similar to an emulsion). Within these droplets, single cells can be contained and thus be isolated according to Poisson’s distribution;
• Pneumatic membrane valving (Gomez-Sjoberg et al., 2007) uses pressurized air, digitally managed from an operator, to open and close a membrane which controls a microfluidic channel;
• Hydrodynamic cell traps (Di Carlo et al., 2006) where a microfluidic channel allows only one cell to enter the “trap”.
19 Microfluidic systems can be operated with very low volumes regarding cell sample as well as reagents, which is advantageous for rare cell applications.
.
Fig. 2 Schematic overview of single-cell separation technologies;
Furthermore, approaches to miniaturize flow cytometers by use of microfluidic technologies have been proposed (Zhang et al., 2014). One of the goals of this field of research is to combine the advantages of each technology to create new more performing technological solutions.
In the last decade, Menarini Silicon Biosystems has developed an image‐based cell‐sorting technology, named DEPArray™, which synergistically combines microelectronics and microfluidics in an highly automated platform, enabling a simple and reliable way of isolating pure, single, viable rare cells from the heterogeneous sample, with unprecedent purity for molecular analysis (Gambari et al., 2003; Polzer et
al., 2014; Manaresi et al., 2003). It is based on the ability of a non-uniform electric field to exert forces on neutral, polarizable particles, such as cells, that are suspended
20 in a liquid. This electrokinetic principle, called dielectrophoresis (DEP), can be used to trap cells in stable levitation in DEP cages by creating an electric field above a subset of electrodes in an array that is in counter phase with the electric field of adjacent electrodes. When a DEP cage is moved by a change in the electric field pattern, the trapped cells move with it (Fig.3).
Fig.3 Main components of DEPArray™ NxT system: the benchtop instrument (left), the cartridge (middle) that combines microfluidics and microelectronics, and the CellBrowser™ software (right) to elaborate fluorescence and bright field images for automatic or operator‐assisted cell selection (a); Schematic representation of dielectrophoresis (b); Schematic representation of DEPArray™ chip (c).
The ability to manipulate individual cells is combined in the DEPArray™ with high quality image-based cell selection and it allows the user to identify and recover specific individual cells of interest from complex, heterogenous samples. Indeed, in the instrument, the illumination is provided by a stabilized LED lamp, which combines high efficiency excitation and emission filters, providing the possibility to get images in up
21
to five fluorescent channels. Moreover, the fluorescent microscope allows acquiring high‐resolution images for each individual cell in the sample thus enabling a high‐definition analysis of in‐cage events, detecting the specific expression markers. Bright field filter visualization coupled to fluorescence signals allows an accurate selection based on the combination of physical and biological parameters, including cell size, shape, circularity, and fluorescence intensity. Then, the elaboration of high‐resolution images minimize the possibility to select inappropriate events, such as debris and doublets (Fig.4).
Fig.4 Images of individual trapped cells, identified by high‐resolution optical system, which gives a real‐time acquisition and multichannel analysis of cell population during the chip scan.
Once identified, each target cell can be isolated from the bulk population, automatically, moving the selected DEP cages and eluting cells in various supports, through an accurate microfluidic control.
22
The DEPArrayTM technology is a promising technology which finds broad application from translational research—to identify biomarkers of response and resistance— toward routine clinical application (Di Trapani et al., 2018).
Biomarkers and monoclonal antibodies: powerful weapon
for Personalized Medicine
For the development and rapid adoption of Personalized Medicine it is vital that pharmaceutical companies invest in these new technologies and show willingness to work collaboratively with research teams. Identification of more accurate biomarkers are fundamental to pave the way to a pro-active approach to Personalized Medicine. Biomarkers have a key role in identifying patients’ sub-groups, but also, in a more specific and microscopic-vision, they can be a potent tool for identifying and isolating rare populations from homogenous suspensions and identify rare populations. It is impossible to implement with this last mentioned approach during a bulk analysis. In the workshop “Stratification biomarkers in Personalized Medicine” held in Brussels on June 2010 (European Commission, DG Research) biomarkers have been described as biological indicators which could have a specific molecular, anatomic, physiologic, or biochemical characteristic, which can be detected and evaluated accurately (ec.europa.eu/research/health/pdf/biomarkers-for-patient-stratification_en.pdf). From this point of view, a biomarker can be used for different purposes:
Diagnostic biomarker: to detect a specific disease as early as possible;
Susceptibility/risk biomarker: used to assess the risk of developing a disease; Prognostic biomarker: to monitor the evolution of a disease (indolent or
aggressive) but can also be predictive. These biomarkers provide further understanding of disease mechanisms, not necessarily linked to drug treatment;
Predictive biomarker: used to value the response and the toxicity to a given treatment. In this case the markers are able to predict the evolution of a disease.
23 Biomarkers are used in order to stratify dissimilar patient groups and thus have an important role in the development of personalized, preventive or therapeutic strategies.
Genomics, transcriptomics and proteomics have largely contributed to the identification and the development of biomarkers. Understanding the patient’s genetic make-up is essential for providing the best possible care approach for many disorders. Gene therapy is coming “back to center stage” (Naldini, 2015) in fact, recent clinical trials have shown its significant therapeutic benefits and a brilliant safety record. However, the genomic approach has some technological limitations, such as the occurrence in same cases of false negative results that could be misleading. For this reason, a multiplex approach integrating various fields such as proteomics, phenotype studies, imaging and functional in vivo studies should be privileged (ec.europa.eu/research/health/pdf/biomarkers-for-patient-stratification_en.pdf). The identification of biomarkers remains a key element in the research of both common and rare diseases (Trusheim et al., 2011). The related process is quite complex and comprises of four steps:
Discovery; Development; Validation; Application.
Once biomarkers have been identified, monoclonal antibodies (mAbs), acting as “molecular probes” able to selectively recognize and bind a specific marker, are a fundamental tool to exploit this technology for both research and clinic.
Since the first generation of monoclonal antibodies in 1975, the antibody industry has grown exponentially. Even if this industry has largely focused its efforts on the development of mAbs for therapeutic and diagnostic purposes, it is important to point out that the antibody discovery field fuels the growing demand of these novel diagnostics and therapeutics (Mike Fan, 2018).
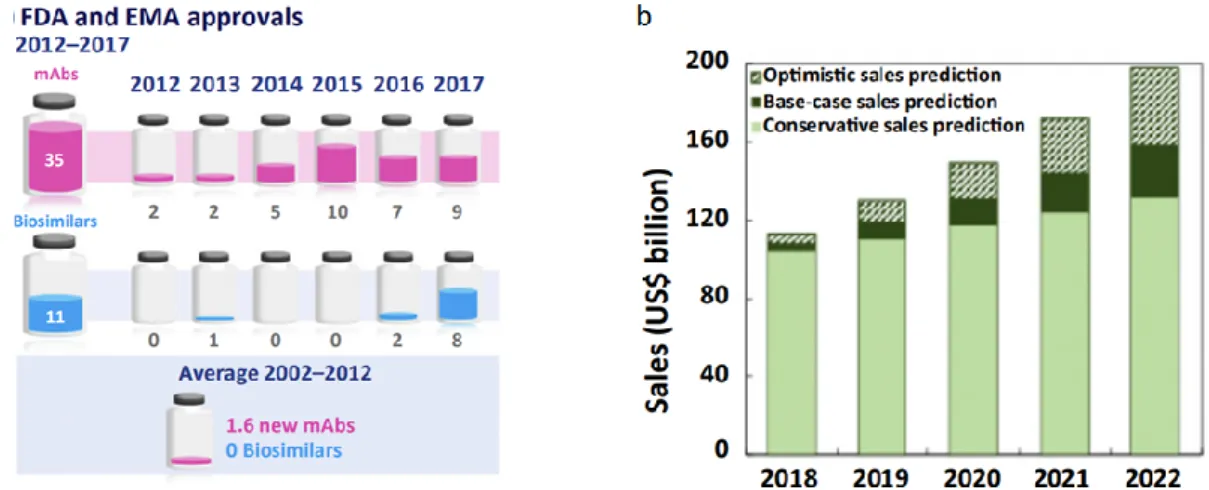
24 Past market data (2012–2017) indicated a doubling of the mAbs market, a trend that is anticipated to continue to 2022 when mAbs sales are expected to reach US$130–200 billions driven by a healthy pipeline and increasing roles for biosimilars and emerging economies (Fig. 5b). Following a decade of stagnation (2002–2012) with an average of 1.6 new mAbs approved per year between 2002 and 2012, recently the regulatory bodies in the USA and the EU have streamlined approvals, resulting in 35 mAbs entering the market since 2013 and an additional ~350 are currently in clinical trials (Reichert, 2012) (Fig.5a). To counteract the ‘biosimilars effect’, pharmaceutical companies are attempting to identify new disease targets for existing mAbs (drug repositioning) and the development of new technologies that facilitate faster drug discovery and shorter time-to-clinic processes, including single-cell printing and cloning, high-throughput screening, and selection of the best clones and culture in miniaturized bioreactor systems for improved scalability (Grilo et al., 2018).
Fig. 5 Schematic representation of FDA and EMA approuved mAbs and Biosimilars between
2012 and 2017 (a); Schematic representation of mAb sales prevision from 2018 to 2022 (b).
Since Köhler and Milstein first described a method for the generation of mAbs via their hybridoma technology in 1975 (Köhler and Milstein, 1975), monoclonal antibodies have become both essential research reagents and highly successful therapeutic molecules. The rapid production of monoclonal antibodies isolated from an immunized animal is an essential starting step to develop therapeutic and diagnostic agents and to support vaccine studies.
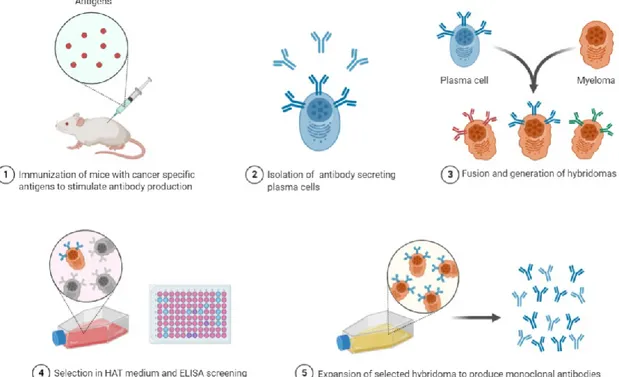
25 Although the traditional hybridoma method has revolutionised the use of monoclonal antibodies (Aman et al., 1984; Kozbor et al., 1982; Redmond et al., 1986; Stahli et al., 1980; Steinitz et al., 1977; Striebich et al., 1990), the technology is relatively inefficient due to genomic instability (loss of chromosomes and onset of mutations) and low mAb expression in the resulting cell lines. Moreover, its reliance on fusion of a B cell to a suitable myeloma partner, means that only a very small percentage of splenocytes from an immunized animal are immortalized (5 × 10⁻⁶ efficiency with conventional PEG fusion) (Yu et al., 2008). As a result, the vast majority of B cells are not sampled, and it is possible that rare antibodies, with desirable properties, will not be identified and recovered. Hybridoma screening is also mostly restricted to rodent immunizations, limiting the potential diversity, and time consuming (Fig.6).
Fig. 6 Schematic representation of the traditional hybridoma protocol to obtain immortalized
cells producing mAbs.
To solve these limitations, display methodologies have been developed, such as phage, yeast, ribosomal or mammalian display platforms (Beerli et al., 2010; Lim et al., 2014; Saggy et al., 2012; Strohl, 2014). PCR amplified variable heavy- (VH) and light- (VL)
26 regions from an immunized organism are randomly paired within a library that can be successively screened for antigen binding. Finally, the VH-VL region pairs binding with higher affinity are subcloned into mammalian expression plasmids for large-scale production (Fig.7).
However, the random combination of antibody variable region genes results often in the loss of natural cognate heavy and light chain pairings that are evolved and selected in vivo during an immune response, resulting in reduced specific diversity (Meijer et al., 2006; Smith et al., 2009). Moreover, as a result of this random pairing, antibodies from naïve antibody libraries typically require further engineering steps in vitro in order to increase affinity and stability prior to progression as a therapeutic molecule.
27 To deal with these problems associated with both hybridoma/immortalized cell lines and combinatorial display platforms, new techniques have been developed to isolate and clone variable region of cDNA from antigen-specific single B cells into antibody expression vectors (Scheid et al., 2009; Smith et al., 2009).
In recent years, there has been an emergence of a number of single-B cell technologies that allow the direct sampling of the immune repertoire (Tiller, 2011). Antigen-specific memory B cells expressing surface IgG have been utilized extensively as a source of monoclonal antibodies. For example flow cytometry, but also B cell panning were used to sort single, antigen-labelled B cells (Di Niro et al., 2017; Dohmen et al., 2005; Townsend et al., 2001; Scheid et al., 2009; Kodituwakku et al., 2003; Lagerkvist et al., 1995; Lightwood et al., 2006). Alternatively, memory B cell culturing and screening followed by micromanipulation of single antigen-specific B cells (Lightwood et al., 2013) or single-cell memory B cell cultures (Kwakkenbos et al., 2010) have also been successfully employed as methods for monoclonal antibody generation.
The terminally-differentiated plasma cell subset of B cells also represent an excellent source of high quality antibodies (Fairfax et al., 2008; Radbruch et al., 2006; Reddy et al., 2009; Shapiro-Shelef et al., 2005; Slifka et al., 1998; Slifka et al., 1998; Smith et al., 1997; Tarlinton et al., 1997; Tarlinton et al., 2000; Manz et al., 1997; Manz et al., 2005; Benner et al., 1981). Plasma cells represent <1% lymphoid cells, but are responsible for the production of the vast majority of circulating IgG (Shapiro-Shelef et al., 2005; Manz et al., 2005). Therefore, following screening of an immune serum for a particular target, it is an attractive option to “go fishing” for the plasma cells that are directly making the antibodies against the antigen of interest.
To exploit the high secretory capacity of plasma cells, a number of techniques have been developed that allow for the identification and isolation of antigen-specific cells. Manz et al. (1995), and more recently Carroll and Al-Rubeai (2005), described the use of a cell-surface affinity matrix to capture secreted immunoglobulin and allow for phenotypic screening via flow cytometry. Babcook et al.(1996) described a hemolytic plaque assay that allowed the identification of plasma cells producing antibody against
28 a target protein attached to sheep red blood cells. The use of microengraved array chips, designed to harbor and screen single plasma cells or activated B cells, has also been described (Jin et al., 2009; Jin et al., 2011; Love et al., 2006; Ogguniyi et al., 2009; Ozawa et al., 2012; Park et al., 2011; Yoshimoto et al., 2013). Anyway, the number of antibodies capable of being cloned and expressed using this method is limited by the methods for single cell isolation which currently rely on manual micromanipulation and are therefore time/effort consuming and low throughput.
Plasma cells also benefit from an increased level of immunoglobulin mRNA compared with memory B cells (Shapiro-Shelef et al., 2005; Coronella et al., 2000; Chen-Bettecken et al., 1987), thereby facilitating the recovery of variable-region genes from single isolated cells.
Since the heavy- (HC) and light- (LC) chains are already paired, there is no need to screen large libraries to identify correctly paired mAbs and avoid the inefficient hybridoma fusion step, thereby enabling efficient mining of the immune B cell population. This approach can facilitate the discovery of rare antibodies that may possess unique highly desirable properties as well as the generation of large and diverse panels of antibodies. The preservation of the natural heavy and light chain pairings during cloning of antibody genes favours the generation of recombinant antibodies with high affinity, specificity and stability.
Only a single cloning and expression step and a single round of screening are required to select the highest affinity mAbs whose recombinant production will be then accomplished by establishing high-producing stable cell lines.
The goal of the first study is to demonstrate the feasibility of a novel approach to recover unique and single plasma cells and, then, to rapidly generate recombinant mAbs through TAP-PCR protocol. This platform contains a single high-throughput cloning step followed by rapid generation of a continuous source of recombinant mAbs.
Materials and Methods
Cell cultures
- Expi293™ (Life Technologies – catalog #A14527) were cultivated in 25mL of Expi293 medium (Gibco - Life Technologies – catalog #A1435101) in sterile PC Flasks, Vented, Plain Bottom, 125mL (Fisher Scientific) at 37°C in a 8% CO2 environment at 125rpm in
the Benchtop CO2 incubator with built in shaker Brunswick™ S41i (Eppendorf)
incubator. Deepwell plate 96/2mL white border (Eppendorf) were also used in the same conditions but at 1000rpm with Eppendorf Mixmate Shaker (Eppendorf).
- Ramos (ATCC – catalog #CRL-1596), TF-1 (ATCC – catalog #CRL-2003), NIH-3T3 (ATCC – catalog #CRL-1658) and Flp-In™-3T3 Cell Line (Thermo Fisher Scientific – catalog #R76107) cell lines were cultured in RPMI1640™ or D-MEM™ medium (Corning – catalog #10-040-CV and #10-017-CV, respectively) with 10% (v/v) heat inactivated fetal bovine serum (FBS – Gibco – Life Technologies), 1% (v/v) penicillin-streptomycin mixed solution (Gibco - Life Technologies – catalog #15140122), 2mM (v/v) glutamine (Gibco - Life Technologies – catalog #35050038) and 1% (v/v) Sodium Pyruvate (NaP - Gibco - Life Technologies – catalog #11360070).
Cell lines were free of mycoplasma contamination. Cell cultures were maintained in cell culture dishes or 6-12-24-96-384 wells sterile plates for cell culture (Corning) and at 37°C in a 5% CO2 and humified environment in the GalaxyS incubator (RS Biotec).
For the TF-1 cell line, 2-5ng/mL of Human Granulocyte Macrophage Colony Stimulating Factor (Human GM-CSF – Sigma Aldrich – catalog #H5666) was added to the medium.
Plasmid Design
The pEF5/FRT/V5-DEST™ Gateway™ (Invitrogen - Thermo Fisher – catalog #V602020) vector, containing the DNA sequence of the full length of the protein TLS1 (3XFLAG-TLS1full-PEF5-F), and the pcDNA™ 3.4 TOPO® vector (Invitrogen - Thermo Fisher – catalog #A14697), containing the DNA sequence of the same protein
30
sequence of the heavy chain of IgG1 (TLS1-L-ECD-HIS and TLS1-L-ECD-hiGg1E1-F, respectively), but also the plasma cell #3 heavy and light variable regions (PB3_mIgG12 and PB3_mIgK), were obtained from GeneArt Gene Synthesis (Thermo Fisher Scientific). pGLuc, pCDM8-GFP plasmids were already available in house. Each plasmid was resuspended in 50μL of TE buffer (10mM Tris pH8, 1mM EDTA – Sigma Aldrich) to reach a final concentration of 100 ng/μL.
Heat shock bacterial transformation and plasmid
extraction, precipitation and quantification
All plasmids, at a final concentration of 10ng/μL, were amplified in Escherichia coli DH5α or Mach1 T1R competent cells (Life Technologies – Invitrogen – catalog #18265-017 and #C869601, respectively), following manufacturer’s instructions. Briefly, an aliquot of 50μL of competent cells for each transformation was thawed on ice into a 1.5mL microcentrifuge tube. Each plasmid was diluted 1:10 in TE buffer and then 1μL was added to the cells and mixed gently. Tubes were incubated on ice for 30 minutes and then heat-shocked for 20 seconds in a 42°C heating block module (Eppendorf). Tubes were placed again on ice for 2 minutes. Afterwards, 950μL of pre-warmed sterilized LB medium (Miller LB broth - Sigma Aldrich – catalog #L3522) were added to each tube and they were incubated at 37°C for 1 hour at 225 rpm, using Minitron Incubator Shaker (Infors HT) . Then 100μL and 900μL from each transformation were spreaded on pre-warmed selective plates for bacterial cultures (Fisher Scientific) previously prepared with Lennox LB broth with agar (Sigma Aldrich – catalog #L2897) and 100μg/mL Ampicillin (Ampicillin Sodium Salt - Shelton Scientific – catalog #171254). Plates were incubated at 37°C O/N. The following day a single colony was spotted and added to 25mL of LB medium and 100μg/mL Ampicillin in Glass Flasks (Schott Duran) and incubated at 37°C, O/N at 225rpm. 50% of the culture, recovered the next day, was used to create a working seed with the addition of 10% glycerol (Glycerol for molecular biology, >99% Sigma Aldrich – catalog #G5516) and kept at -80°C, while the other part was submitted to the plasmid extraction using QIAprep Spin Miniprep Kit (Qiagen – catalog #27104), following manufacturer’s instructions. To
31 quantify, plasmids were eluted in 40μL of TE buffer pH 8 and then the absorbances at 260 and 280nm were misured with Nanovue (GE Healthcare). Only plasmid preparations with A260/A280 ratios between 1.75 and 2.00 were used. If DNA was too
much diluted, DNA was extracted by ethanol precipitation. Briefly, 0.1 volumes 3M Sodium acetate, SigmaUltra, minimum 99% (Sigma Aldrich – catalog #S2889) and 3 volumes ice cold 100% Ethanol (Sigma Aldrich – catalog #51976) were added to each sample and then we incubated at -20°C O/N. The following day samples were centrifuged at 13000rpm at 4°C for 30 minutes through Microcentrifuge 5415-R (Eppendorf), the recovered pellet washed twice with 0.5mL ice cold 75% ethanol and spinned again at 4°C for 10 minutes each time. Next, ethanol was removed and we spinned quickly to remove any trace of it. In the end samples were air dried and resuspended in 20µL of UltraPure Distilled Water DNAse/RNAse free (Invitrogen – catalog #10977049). The absorbance at 260 and 280nm were measured again.
Transfection and supernatant recovery
The plasmids TLS1-L-ECD-HIS, TLS1-L-ECD-hiGg1E1-F, PB3_mIgG12 and PB3_mIgK were transiently transfected into Expi293 cells using ExpiFectamine 293 Transfection Kit (Gibco - Life Technologies – catalog #A14524) in sterile PC Flasks, Vented, Plain Bottom, 125mL (Fisher Scientific) as per manufacturers’ instructions.
Plasmids PB3_mIgK and PB3_mIgG12 were transiently cotransfected with a proportion of 70% and 30%, respectively, but optimization of the protocol has been made: the number of cells was reduced from 7.5 x 10^7 to 2x10^7, the quantity of the transfected DNA from 30µg to 26µg (70% Vh + 30% Vl) and, in proportion, also the quantities of Expi medium, OptiMEM I 1x + Glutamax–I (Gibco - Life Technologies – catalog #31985062), Expifectamine and Enhancers to use were modified. The recombinant mAb’s transfection was performed in quadruplicate for a total of 10 times. The flasks were incubated for 6 days at 37°C in a 8% CO2 environment at
125rpm in the Brunswick™ S41i incubator. Two recoveries of the supernatants were made after 48h and 6 days from the addition of enhancers. Supernatants were harvested by centrifugation through Juan MR23-I centrifuge (Thermo Electron) at
32 1800rpm for 15 minutes, filtered with 0.22µm syringe filters (Fisher Scientific) and 5mL syringe (PIC indolor) and kept at +4°C for further characterization, while pellets were resuspended with fresh medium and placed in incubation again.
The fragments obtained through TAP-PCR were transiently transfected maintaining the proportion of 70% and 30%, for Vl and Vh respectively, but scaling down the protocol from 125mL flasks to Deepwell plate 96/2mL white border (Eppendorf – catalog #DWP962000W2-EP), following manufacturers’ instructions. Optimization of the protocol has been made: the number of cells was reduced from 2x10^6 to 4.5x10^5, the quantity of DNA to transfect from 0.7µg to 0.4µg (70% Vl + 30% Vh) and, consequently, we have modified also the quantity of Expifectamine, OptiMEM I 1x and Enhancers used in proportion. Plates were incubated for 48h at 37°C in a 8% CO2
environment at 1000rpm with Eppendorf Mixmate Shaker (Eppendorf). Supernatants were then harvested by centrifugation through Microcentrifuge 5415-R (Eppendorf) at 1800rpm for 5 minutes after 24h and 48h after the addition of enhancers.
FACS staining
To assess the efficacy of the supernatants of the miniaturized and the scaled-up to flasks transfections, to value mice’s sera antibody titer, but also to identify the positive plasma cells to sort and of the final product mAb α-TLS1, the flow cytometry analysis was carried out. FACS analysis was executed coating Assay Round-bottom 96 well plates (Corning) with 10µL of surnatants/well and then adding 10.000 cells/well. Each sample was analyzed with two different cell lines : Flp-In-3T3 as negative control, as it did not express the antigen on the membrane, and the stable clone called ‘F4’, which was transfected to stably express the antigen on the surface. mAb α-TLS1 was also tested on TF-1 cell line and it was used at 2.3µg/mL. Plates were incubated for 1 hour at 4°C. Then 100µL of 1XPBS were added to each well, centrifuged at 1200 rpm for 5 minutes, supernatants were recovered and replaced with 10µL of 1:1000 anti-mouse IgG APC-conjugated (Life Technology). The secondary antibody was also used as negative control. Plates were incubated for 1 hour at 4°C and then washed again with
33 100µL of 1XPBS. At the end, cells were resuspended in 20µL of 1XPBS and analyzed at the cytofluorimeter BD FACS Canto II (Beckton Dickintson).
Moreover a serial dilution of α-TLS1 from 10µg/mL to 0.0003µg/mL in 1XPBS was tested to have a dose-response data. Once the mAb was limiting diluted by hand, the protocol used was the same as reported before. The dose-response was tested on F4 and TF-1 cell lines.
FACSCanto was used also to analyse the GFP positivity on TAP-PCR constructs to assess the best promoter, poly-adenilation and leader sequences.
Results were analyzed using the FlowJo software (FLOWJO, LLC, Ashland, OR, USA).
TLS1 stable clone (F4) creation
1.2 x 10⁶ Flp-In™-3T3 (Thermo Fisher Scientific) were seeded into p100 tissue culture dishes (Corning) and allowed to adhere overnight. The next day, 1.5mL of OptiMEM I 1X (Gibco - Life Technologies) containing 50µL Lipofectamine LTX Plus (Gibco - Life Technologies – catalog #15338100) was then combined with the DNA mixture, which contained in one hand 10µg Recombinase plasmid (available in house – pOG44) and pEF5-FRT-GFP plasmid, as control, and in the other hand the Recombinase plasmid with 10µg 3XFLAG-TLS1full-pEF5-F plasmid, previously purified. Complexes then were added drop-wise to the cells. After 24 hours of incubation, the transfection medium was replaced with fresh growth medium supplemented with Hygromycin B (300μg/mL – Thermo Scientific – catalog #10687010). Every two days of selection, the medium was replaced and the selection was monitored with the Leica DMI 3000 B Fluorescence Microscope (Leica), indirectly comparing the GFP emission with the expression of the antigen of our interest on the membrane. After 12–14 days of selection, well-isolated, drug-resistant colonies were removed from the plates using Cloning Rings (Sigma Aldrich) and plated in new 24-well plates to selectively expand only the clones of our interest. We waited until clones reached the confluence and then we tested their positivity in the expression of TLS1 with a FACS staining analysis through α-Flag-tag M2 antibody (1:50 - Sigma Aldrich – catalog #F1804) as primary antibody and Goat Anti-mouse IgG DyLight 633 Conjugated (1:1000 – Invitrogen) as secondary antibody. Only
34 the clones that were staining positive were kept, expanded and kept frozen in -80°C until their use.
Purification of IgG-tagged protein
The IgG-tagged protein was purified from the supernatants using HiTrapTM Protein G HP 1mL columns (GE Healthcare – catalog #17-0402-01) using a peristaltic pump P1 (Pharmacia), following the instructions reported in Rial DV, Ceccarelli EA ‘Protein Expression and Purification’ (2002). Briefly, the pump tubing must be filled with buffer A (50mM Tris-HCl , 150mM NaCl) and then connected with the column, drop-to-drop to avoid introducing air into the column. Once the column was conditioned with 10mL of buffer A at 1mL/min, the sample was applied by pumping it onto the column and recovering the flow-through. The column was washed with 4mL of buffer B (50mM Tris-HCl, 150mM NaCl, 25x PMF and 5mM ATP) for 3 times. A 4th wash was made with buffer A, followed by elution with 2.5mL of a suitable solution (0.1M Glycine-HCl pH 2.7) and buffered with 200µL of 1M Tris-HCl, pH 9. In order to regenerate the column and prevent cross contamination, each run included a strip of the protein G column using 20mL of buffer A followed by 20mL of 20% EtOH.
α-TLS1 mAb was also purified from the supernatants using HiTrapTM Protein G HP 1mL columns (GE Healthcare), following the same protocol reported before, but substituing buffer A with 20mL of binding buffer (20mM Sodium Phosphate, pH 7) to condition the column and to do 3 washes after the application of the sample.
The good quality of purifications was then confirmed through SDS-PAGE analysis.
Ides/IdeZ cleavage
IdeZ Protease, Lyophilized (Promega – Catalog #V834A) specifically cleaves IgG molecules below the hinge region to yield F(ab)2 and Fc fragments. After having reconstituted the protease with 100µl of deionized water to make a 50units/µl solution, the antibody fragmentation was reached adding 1 unit of IdeZ Protease per
35 1µg of IgG to be digested. Samples were incubated at 37°C for 30–60 minutes in the heating block module (Eppendorf). The cleavage was then confirmed through SDS-PAGE analysis, as described below.
Lightning-Link APC/R-PE Conjugation
Once the IgG-tagged protein was obtained, part of the main fraction was labeled with two fluorochromes (R-PE and APC) with Lightning-Link Conjugation Kit (Innova Biosciences) following manufacturer’s instructions.
Mice’s immunization
10 Female BALB/c mice (Charles River) were maintened in specific germ-free conditions in the animal facility in the TLSF (Toscana Life Sciences Foundation) building n°36, inside the GSK campus (Siena). Once 4 weeks old, they were immunized intra-peritoneally every 14 days with a total volume of 100μL 1XPBS containing 20μgr of the purified protein TLS1-L-ECD-hiGg1E1-F, 1μL of 200mM Dithiothreitol (DTT – Invitrogen – catalog #P2325) and Incomplete Freund’s Adjuvant and Complete Freund’s Adjuvant (IFA and CFA, catalog #F5506and#F5881 respectively - Sigma Aldrich) per mouse for 5 injections . CFA was used only for the first dose and IFA for the subsequent boosts. Blood for sera analysis was recovered after the 3rd and the 5th immunization to evaluate the antibody titer through ELISA test and FACS staining analysis. At the end of the study, the mice were anesthetized with IsoFlo (Zoetis – catalog #50019100), terminal bleeds were taken and then sacrificed with cervical dislocation to recover also the spleens and bone marrows, that were cryopreserved until their use.
Purification of HIS-tagged protein
Proteins were purified from the supernatants using Ni-Seph resin 2.5mL (GE Healthcare – catalog #17-5268-01 ), previously prepared with 3 washes with dH2O and
36 and recovering the flow-through by gravity. The column was washed with 5mL of washing buffer (20mM Sodium Phosphate pH 7.4, 0.5M NaCl, 10mM Imidazole) for 5 times. We proceeded with 5 elutions with 2mL of elution buffer (20mM Sodium Phosphate pH 7.4, 0.5M NaCl, 500mM Imidazole). Aliquots were stored at -80°C and used for ELISA tests. The good quality of the purification was then confirmed through SDS-PAGE analysis.
Protein quantification
To quantify the proteins and the eluted antibody , we measured the A280 absorbance
with Spectramax M2 (Molecular Devices) through the help of a black quartz cuvette (STARNA Scientific). After having set the reference (Elution buffer and Tris pH9 or 1XPBS), only for the antibodies’s main elutions were evaluated and divided for the molar extinction coefficient of 1.35. To confirm the quantification obtained, we evaluated the eluted fractions also with Pierce BCA Protein and Bradford Assay Kits (Thermo Scientific – catalog #23225 and #23236, respectively), following manufacturer’s instructions. Samples were valuated into 3 different dilutions (1:1, 1:5 and 1:10). To confirm quantification of the concentrated mAb, we created a standard curve with IgG mAb, as control, and we compared known concentrations of the control mAb with the measured concentrations of the new antibody through SDS-PAGE analysis, reported below.
Buffer exchange
The main purified fractions were buffer exchanged using Slide-A-Lyzer MINI Dialysis Devices 3.5 or 20K MWCO (Thermo Scientific – catalog #88405) in 1XPBS at 4°C for 3-4 hours at 10-15 rpm through Orbit 300 refrigerated shaker (LABNET). Then, 1XPBS was substituted with fresh one and the dialysis step proceeded O/N at 4°C at 10-15 rpm. The samples then were recovered the next day in LoBind tubes (Eppendorf – catalog #Z666505).
37
Volume reduction and concentration
For the antibodies, the sample was then concentrated through PierceTM Protein Concentrator PES, 30K MWCO (Thermo Fisher – catalog #88531), previously conditioned with 3mL of 1XPBS, at 4000rpm for 5 minutes and then at 3000rpm for 1-2 minutes reducing the volume to reach the requested concentration of 1mg/mL.
SDS-PAGE and Westen Blot
To verify the correct outcome of the purifications, each fraction was analyzed with SDS-PAGE and Western Blot. Briefly, 30µL of each fraction was added to 10µL of NuPAGE™ LDS Sample Buffer (4X) (Invitrogen – catalog #NP0007), the resulting solution was mixed and then boiled at 95 °C in the heating block module (Eppendorf) for 10 min. Subsequently, 12µL were loaded onto NuPAGE 4-12% Bis-Tris pre-cast Gel ( Invitrogen – catalog #NP0326BOX ) as well as 5µL of SeeBlue™ Plus2 Pre-stained Protein Standard (Invitrogen - catalog #LC5925). At the same time, the reduced sample was prepared adding 4µL of BoltTM Sample Reducing Agent (Invitrogen – catalog #B0009). 50mL of 20x NuPAGE™ MOPS SDS Running Buffer (Invitrogen – catalog #NP0001) were added to 950mL of deionized water to prepare 1x SDS Running Buffer and it was added to the XCell SureLock™ Mini-Cell (Invitrogen – catalog #EI0001) to proceed with the run at 150 V for 1h through 200M Dual Power (Invitrogen). At the end of the run, the gel was stained using SimplyBlue™ SafeStain (Invitrogen – catalog #LC6060) at RT for 1h at 10-15 rpm. Then, the staining solution was removed and the gel was rinsed with deionized water until it became clear again. Images of the gels were obtained by ImageQuant LAS4000 (GE Healthcare).
Alternatively, the gels were subjected to Western Blot analysis using iBlot™ Transfer Stacks with PVDF membranes (Invitrogen – catalog #IB24002) through the iBlot™ Gel transfer Device (Invitrogen) following manufacturer’s instructions. At the end of the transfer, the immunoassay was performed on the PVDF membrane, made ready with an incubation of 1 hour with Skin Milk Powder (Fulka – catalog #70166) to block the free sites left on the membrane to avoid non-specific binding of the antibody on them.
38 We proceeded with the incubation for one hour with primary antibodies directed against the protein of interest at 4°C under agitation and, then, with the secondary antibodies Goat Anti-Mouse IgG (H-L)-HRP Conjugated (Bio-Rad Laboratories – catalog #1706516), diluted at 1:5.000/10.000.
At the end of the incubation, three TBS-T (50 mM Tris-Cl, pH 7.6; 150 mM NaCl; Tween 0.1%) washes were performed. The detection of the bands was obtained using the ECL reagent (Enhanced ChemioLuminescence – Invitrogen – catalog #WP20005) for 2-5 minutes and images were taken by ImageQuant LAS4000 (GE Healthcare). Even if the Western Blot analysis is performed, gels were in any case recovered and subjected to Coomassie blue staining.
To confirm quantification of the concentrated mAb, we created a standard curve with IgG mAb, as control, and we compared known concentrations of the control mAb with the measured concentrations of the new antibody. The standard curve was created by limiting dilution 1:2 of the control antibody from a concentration of 1mg/mL to 31μg/mL, taking 10μL and diluting in 10μL of dH2O. Then we added 8μL of dH2O and
6μL of 4x-NuPAGE LDS Sample Buffer. For the new antibody preparation, 10μL were taken and added to 8μL of dH2O and 6μL of 4x-NuPAGE LDS Sample Buffer. At the
same time, the reduced sample was prepared replacing 8μL of dH2O with 2.4μL of 10x
BoltTM Sample Reducing Agent and 5.6μL of dH2O. We proceeded with the SDS-PAGE
and Western Blot analysis as described before.
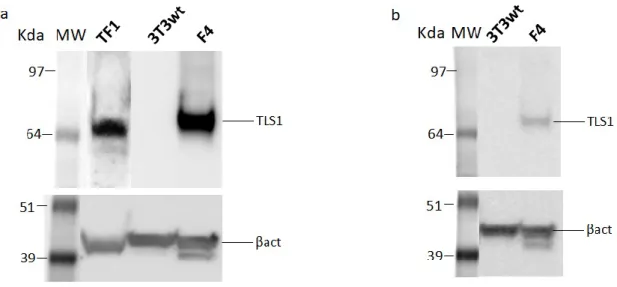
Western Blot analysis was done also on NIH-3T3, F4 and TF-1 cell lines’s lysates obtained with RIPA Buffer (Sigma Aldrich – catalog #R0278), following manufacturer’s instructions. Lysates were quantified by Pierce™ BCA Protein Assay Kit. 20µg of NIH-3T3 and F4, and 200µg of TF1 cell lysates were loaded on NuPAGE 4-12% Bis-Tris pre-cast Gel and transferred then to iBlot™ Transfer Stacks with PVDF membrane, as described before. The α-TLS1, the α-FLAG-tag (M2 – Sigma Aldrich – catalog #F4049) and the α-βActin (Sigma Aldrich – catalog #A5441) antibodies were used at 10µg/mL as primary antibodies. For all was used the 2nd Goat Anti-mouse IgG(H+L) HRP-conjugated diluted at 1:5000.
39
ELISA test
Antibody titres in mice sera and levels in Expi293 supernatants were assessed via ELISA. Briefly, the purified TLS1-L-ECD-HIS or TLS1-L-ECD-hiGg1E1-F were used to coat ELISA assay plates 96well Flat Bottom, Black (Corning) at 10 μg/mL in 50µL 1XPBS/well, O/N at 4°C. The following day plates were washed 3 times with 1XPBS and then blocked with 5% BSA (Bovine Serum Albumine – Fisher Scientific) in 1XPBS 200µL/well for 2 hours at 37°C. Afterwards, washes with 1XPBS were repeated (200µL) and then sera or supernatants were applied (50µL/well) to the plates at various dilutions along with a purified mouse IgG standard for 1 hour at RT. Following washing with 0.05% Tween-20 (Sigma Aldrich) in 1XPBS, Anti-mouse IgG Fc specific HRP-conjugated antibody (Sigma Aldrich – catalog #A0168) was added at a 1:2500 dilution in PBS-BGT (0.5% BSA, 2.5% FBS, 0.05% Tween-20 – 50µL/well) for 1 hour at RT. Plates were developed with 50µL/well of 3, 3′, 5, 5′-Tetramethylbenzidine Substrate Solution (TMB – Sigma – catalog #N301) for 30 minutes at RT and then the reaction was stopped with 1M HCl (50µL/well – Siigma Aldrich). Plates then were read at 492nm with Spectramax M2 (Molecular Devices).
Antigen-specific plasma cells identification
Cryopreserved bone marrow samples, derived from immunized mice, as previously described, were thawed and crushed pipetting several times up and down into a petri dish to resuspend all the cell suspension contained in them. Cells were then washed twice with 1XPBS by centrifugation at 1200rpm for 5 minutes. The enrichment of cells of interest was performed using the CD138+ Plasma Cell Isolation Kit, an LD and two MS Columns, a MidiMACS™ and a MiniMACS™ Separators (Miltenyii Biotec – catalog #130-092-530), following the manufacturer's instructions. Briefly, cells were fluorescently stained with CD45R (B220)-APC, CD19-FITC, and CD138-PE. Cell debris and dead cells were excluded from the analysis based on scatter signals and propidium iodide fluorescence by flow cytometry analysis. Enrichment of the sample was around 40%.
40 As first attempt, isolated in bulk cells were inserted into the DEPArrayTM cartridge to be used in the DEPArrayTM technology (Menarini Silicon Biosystems). The following monoclonal antibodies (mAbs) were used to detect and to sort single plasma cells: Rat Anti-Mouse CD3 (17A2), Rat Anti-Mouse CD4 (GK1.5), Rat Anti-Mouse CD8 (53-6.7), Rat Anti-Mouse Ly6C/Ly6G (RB6-8C5 - RUO), Rat Anti-Mouse F4/80-Like receptor (6F-12), Rat Mouse IgM (R6-60.2), Rat Mouse IgD (11-26c.2a) and Rat Anti-Mouse CD19 (6D5) from BDPharmingen; and Anti mouse CD335 (29A1.4) from Invitrogen. Image-based selection allowed us to identify and isolate of cells of interest and to plate them in multiplate PCR plates 96 well clear (Biorad), following
manufacturer’s instructions.
As second attempt, we proceeded to seed them by hand in 384 wells-plate (Corning) and then in Terasaki plates (available in house) with a distribution of 0.3 cells per well, with the addition of RPMI1640™ (Corning). After 24h of incubation at 37°C with 5% CO2, the supernatant of each well was tested for the capability to bind to the target
antigen. FACS analysis was executed through BD FACS Canto II (Beckton Dickintson), coating U bottom 96 well plates with 10µL of surnatants/well and following the same protocol as reported before for the staining.
Cells, which supernatant resulted positive, were identified, washed with 1XPBS and moved to 96-well PCR-plate containing 4µl of Lysis buffer (Table n.1), in sterile conditions, frozen and stored at -80°C until Reverse Transcription-PCR was performed.
Table n.1
Lysis Buffer 96X Final conc.
UltraPure™ DNase/RNase-Free Distilled Water
(Invitrogen – catalog #10977035):
310 µL
10X sterile PBS 20 µL
DL-DTT 100mM: 40 µL (18.3ng/µL)
RNasin Plus RNase inhibitor 40U/µL (Promega – catalog
#N2611):
30 µL (40U/µL)