UNIVERSITÀ
DEGLI
STUDI
DEL
MOLISE
Department of Agricultural, Environmental and Food Sciences
PhD Course in:
A
GRICULTURET
ECHNOLOGY ANDB
IOTECHNOLOGY(CURRICULUM:SUSTAINABLE PLANT PRODUCTION AND PROTECTION)
(C
YCLEXXXI)
Related disciplinary scientific section: AGR/14 (Pedologia)
PhD thesis
NEW APPLICATIONS OF VISNIR SPECTROSCOPY FOR THE PREDICTION OF SOIL PROPERTIES
Coordinator of curriculum: Prof. Giuseppe Maiorano
Supervisor: Prof. Claudio Colombo
Co-Supervisor: Prof. Edoardo A. C. Costantini
PhD Student: Romina Lorenzetti
155901
Summary
Soil is known to be an unrenewable limited natural resource. All the ecosystemic functions that it absolves are required for the survival of humanity, such as agricultural and forestal products, regulation of water movement in the landscape, sink for Carbon in the frame of climate change, environmental filter for pollutants, space for infrastructure and recreation.
Preserving these functionalities requires to preserve needs an appropriated knowledge and interpretation of the information about soils. Since the biggest limits to data availability are by the spendable amounts of time and money, researches are currently focused on new faster and cheaper instruments of investigation. By the time that multivariate statistical methodologies and computer-based analysis took widely place, visible (Vis) (400–780 nm) and near-infrared reflectance (NIR) (780–2500 nm) (VisNIR) spectroscopy seemed one of the fair solutions for this needing. VisNIR spectroscopy is recognized to be a non-destructive, fast, inexpensive and precise alternative to wet chemistry, enable to obtain a large amount of data partly losing the reliability of traditional analyzes, due to the inevitable error that occur in predicted data.
Several studies were carried out primarily to test the predictive power of VisNIR spectroscopy, and several data was been produced by the last three decades. Nevertheless, some potentialities and limits of VisNIR soil spectroscopy are still a little unexplored and new questions may occur as a result of the huge amount of available data.
This thesis embodies a collection of novel studies related to the use of multivariate information provided by VisNIR spectroscopy. As a whole they experienced questions: at different reference scales (national and local); with different investigation method (multivariate calibration and multivariate classification); in different field of application (taxonomy, monitoring, scientific purpose). The idea was to focus on some of the main issues that are emerging at the state of the art of knowledge about VisNIR spectroscopy in soil science.
Briefly, Chapter 1 contains the object of study, focusing on what is already known and what may need to be further discussed. Thus, the first part is about the soil that is the object of investigation and the second in about the VisNIR spectroscopy.
Chapter 2 deals with the possibility to explore VisNIR potentiality over some still poorly explored properties. A case study for taxonomic purpose was carried out over volcanic soils. The results of this chapter show the close connection between soil spectroscopy attribute variation and soil taxonomic units linked to volcanic properties.
Chapter 3 deals with a national library used at local scale for organic carbon (OC) monitoring. It highlights the increasing economic advantage of NIR with the decrease of OC change.
Chapter 4 focuses on the possibility of using the raw information contained in the VisNIR region of the spectra to characterize the soils rather than using individual soil attributes. In this chapter, VisNIR showed a higher power in detaching slight differences due to effect of a very recent changing in the forest management respect to wet biochemical analyses.
Chapter 5 focuses on the status of the large spectral library in Italy. To my knowledge, this PhD represents the first study that included the building of an Italian National Spectral Library.
Finally, Chapter 6 discusses the main findings of this thesis.
Riassunto
Il suolo è una risorsa naturale limitata e non rinnovabile e le funzioni ecosistemiche da esso assolte sono indispensabili alla sopravvivenza dell’uomo. Tra queste: le produzioni agricole e forestali, la regolazione del movimento dei corpi idrici, lo stoccaggio del carbonio nella cornice del cambiamento climatico, l’azione filtrante per le sostanze inquinanti, e infine superficie per le infrastrutture e le attività ricreative.
Preservate tali funzionalità richiede una profonda e dettagliata conoscenza della risorsa suolo e un adeguata interpretazione delle informazioni. Dal momento che diponibilità di tempo e disponibilità economiche rappresentano i maggiori limiti alla raccolta di dati relativi alla risorsa suolo, le ricerche sono attualmente incentrate su nuovi strumenti di indagine più veloci e meno costosi. Con la diffusione di metodologie statistiche multivariate e l'analisi computerizzata, la spettroscopia visibile (Vis) (400-780 nm) e nel vicino infrarosso (NIR) (780-2500 nm) (VisNIR) ha iniziato a prendere piede come valida alternativa alla chimica tradizionale. La spettroscopia VisNIR è riconosciuta come uno strumento non distruttivo, veloce, economico e preciso, consente di ottenere una grande quantità di dati, perdendo in parte l'affidabilità delle analisi tradizionali, a causa dell'inevitabile errore che si verifica nei modelli di stima.
Negli ultimi tre decenni sono stati condotti diversi studi principalmente per testare la potenza predittiva della spettroscopia VisNIR e sono stati raggiunti numerosi risultati. Tuttavia, alcune potenzialità e limiti della spettroscopia del suolo VisNIR rimangono ancora poco esplorate e in virtù dell’ingente quantità di informazione che si sta producendo, nuovi interrogativi potrebbero insorgere nella comunità scientifica.
Questa tesi comprende una raccolta di studi su tematiche attuali e innovative relative all'uso della spettroscopia VisNIR in abito pedologico. Nel complesso le attività di ricerca sono state svolte: a diverse scale di riferimento (nazionali e locali); con diversi metodi di indagine (calibrazione multivariata e classificazione multivariata); in diversi campi di applicazione (tassonomia, monitoraggio, finalità scientifica). L'idea era di affrontare alcuni dei principali problemi che stanno emergendo allo stato dell'arte dell’uso della spettroscopia VisNIR nella scienza del suolo.
In breve, il Capitolo 1 contiene l'oggetto di studio, riassumendo ciò che è già noto e ciò che potrebbe essere necessario discutere ulteriormente. Quindi, la prima parte riguarda il suolo che è l'oggetto di indagine e il secondo la spettroscopia VisNIR.
Il capitolo 2 riguarda le potenzialità del VisNIR nella predizione di alcune proprietà ancora poco esplorate, nello specifico: le proprietà vulcaniche dei suoli. Rappresenta un caso di studio di uso del VIsNIR per scopi tassonomici. I risultati di questo capitolo mostrano la stretta
connessione tra la variazione dell'attributo della spettroscopia del suolo e le unità tassonomiche del suolo legate alle proprietà vulcaniche.
Il capitolo 3 viene affrontato il tema dell’uso di una libreria spettrale nazionale a livello locale per il monitoraggio del carbonio organico (OC), con l’obiettivo di evidenziare per quali range di variabilità e differenze attese da monitorare, l’uso del Vis NIR è da preferisti alla chimica tradizionale.
Il capitolo 4 si concentra sulla possibilità di tracciare la qualità relative di un suolo, utilizzando le informazioni grezze contenute nella regione VisNIR degli spettri piuttosto che i singoli attributi biochimici del suolo. Sono stati indagati campioni di suolo relativi ad aree boschive avviate a differenti tipi di gestioni forestali Il VisNIR ha mostrato una maggiore potenza nel l’evidenziare le lievi differenze dovute all'effetto di un cambiamento molto recente dei trattamenti, rispetto alle analisi biochimiche tradizionali.
Il capitolo 5 riguarda la costruzione di un’ampia libreria spettrale dei suoli in Italia. Per quanto è a mia conoscenza, questo dottorato di ricerca rappresenta il primo tentativo di costruzione di una biblioteca nazionale spettrale dei suoli italiani.
Acknowledgements
This period as a PhD student represented the possibility to introduce a high formative parenthesis in my working career, since it was arrived in my life after more than 10 years from my master thesis and after about 6 years of research activity at the research Center CREA-AA. For this reason, I firstly wish to thank my colleagues which I had by my side before and during my PhD, collaborating in the most suitable way: Simone Priori, Maria Fantappiè, Roberto Barbetti, Giovanni L’Abate, and Lorenzo D’Avino, thanks for sharing with me achievements, expectations and defeat. I’ m proud to belong to this working stuff up to now. I want especially to thank Edoardo Costantini for believing in me, and for embodying a great example of love for scientific working.
A big thank you is also for Cesar Guerrero, my tutor in the foreign university, for his generosity in teaching me whatever he could.
At the end, I need to say many thanks to the people closest to me. They have been my indispensable energy to carry out this project in the frame of a so insecure job, and my courage to overcome the misgivings, looking to the future.
Publications
Colombo C., Lorenzetti R., Di Iorio E., Costantini E. A. C., 2017. Stima delle proprietà andiche tramite spettroscopia diffusa nel dominio visnir su suoli vulcanici europei. 42° Congresso Nazionale della Società Italiana della Scienza del Suolo. FIRENZE 5-7 dicembre 2017
Lorenzetti R, Guerrero C., Di Iorio E., Agnelli E.A., Colombo C., Lagomarsino A., 2018. Discriminating the effects of forest management on litter and soil in a medioterranean pine forest by VisNIR. In: ATTI DELLA ESSC Conference "Soil and Water Security: challenges for the next 30 years!". Imola, 6-8/06/2018. (BEST POSTER AWARD session 2).
Submitted pubblications
Lorenzetti R, Guerrero C., Minimum detectable difference: using composites or using NIR spectroscopy? Congress Pedometrics, 2-6 June 2019 (poster)
Erika Di Iorio , , Luana Circelli, , Romina Lorenzetti, Edoardo A.C. Costantini, Sara Perl Egendorf, Claudio Colombo. Estimation of andic properties from Vis-NIR diffuse reflectance spectroscopy for volcanic soil classification. Catena
Alessandra Lagomarsino; Alessandro Elio Agnelli; Gianluigi Mazza; Romina Lorenzetti; Claudio Colombo; Caterina Bartoli; Carlo Viti; Roberta Pastorelli. "Litter fractions and dynamics in a degraded pine forest after thinning treatments". European Journal of Forest Research (EFOR).
TABLE OF CONTENTS Summary………. Riassunto………. Acknowledgements………. Pubblication……… Tableof content………... List of figures ………. List of tables ……….. Introduction ……… Cap 1: SUBJECT OF STUDY………... 1. 1 Components and characteristics of soil ……….. 1.1.1 Mineral component of the soil………... 1.1.2 The organic component of the soil……….…..……... 1.1.3 Water and air in the soil………. 1.1.4 Main chemical soil properties……….... 1.1.5 Main physical soil properties……… 1.1.6 Soil quality………..…….…. 1. 2 The Visible and Near Infrared Spectroscopy ………..………
1.2.1.1 Principles of Visible and Near Infrared Spectroscopy………... 1.2.1.2 The reflectance………... 1.2.2 Soil spectral signatures in the VisNIR domain………. 1.2.2.1 The mineral component... 1.2.2.2 The organic component……….. 1.2.2.3 The water content of soil……… 1.2.2.4 Soil physical properties ………. 1.2.2.5 Soil quality ……….. 1.3 Extracting information from soil spectra in VisNIR domain………. 1.3.1 Multivariate calibration………. 1.3.2 Multivariate classification………. 1.4 Large library………. 1.5 Economic advantage by VisNIR Soil Spectroscopy…...………. 1.6 Thesis objectives……….. References……….. Cap 2: ESTIMATION OF ANDIC PROPERTIES FROM VISNIR DIFFUSE
REFLECTANCE SPECTROSCOPY IN EUROPEAN VOLCANIC SOILS……….. 2.1. Introduction………. 2.2. Materials and Methods………
2.2.1 Soil selection and analysis………. 2.2.2. Sample preparation and DRS measurement……….
i ii iii iv v 1 3 5 8 8 8 9 10 11 12 14 15 15 17 19 19 21 22 23 23 24 24 27 28 28 29 30 41 41 43 43 43
2.2.3. Preprocessing analysis……….. 2.2.4. Discriminating soils with different andic properties…...………. 2.2.5. Predictive models…...………... 2.2.6. Models comparison………... 2.3. Results……….. 2.3.1. Soil properties………... 2.3.2. Spectra properties of the dataset………... 2.3.3. PCA and discriminant analysis………. 2.3.4 Prediction of andic soil properties using PLSR and SVM……… 2.4. Discussions………..
2.4.1 Estimation of andic properties with VisNIR………. 2.4.2 Model comparison………. 2.5. Conclusions……….. Acknowledgements………. References……… Cap 3 MONITORING SOIL ORGANIC CARBON BY NEAR INFRARED
SPECTROSCOPY (NIR)…...………...……. 3.1 Introduction………..………... 3.2. Materials and methods………..
3.2.1.Site………. 3.2.2. Samples and laboratory analysis……….. 3.2.3. Scenarios………..……… 3.2.4. Activities carried out in the frame of each scenario………
3.2.4.1. Samples size……….………. 3.2.4.2. Selection of subsets for NIR models………. 3.2.4.3. NIR models……… 3.2.4.4. Predictions of SOC……… 3.2.5. Data analysis – Experimental setup……….. 3.2.5.1. MDD……….………. 3.2.5.1.1. MDD with reference method (Walkley-Black)……. 3.2.5.1.2. MDD using NIR ……… 3.2.5.2 Comparison of costs of WB and NIR at different scenarios…. 3.3. Results and discussions……….. 3.3.1. SOC contents under conventional tillage, 20 years of no tillage, and in the hypnotized scenarios……….. 3.3.2. Sample size to detect SOC in the scenarios……… 3.3.3. NIR models and predictions ………. 3.3.4. MDDWB vs MDDNIR, y MDDNIR vs MDDNIRc……….. 3.3.5. Estimation of economic efforts and comparison of costs of WB and NIR at different scenarios………
46 46 46 47 49 49 50 51 55 58 58 59 60 60 61 66 66 68 68 69 69 69 69 70 70 71 71 71 72 72 73 74 74 75 76 81 83
3.4. Conclusions……… Acknowledgements……… Reference……… CAP 4: CHECKING THE EFFECTS OF THINNING TREATMENTS ON LITTER IN A DEGRADED MEDITERRANEAN PINE FOREST BY VISNIR……….…… 4.1 Introduction………. 4.2 Materials and methods……….
4.2.1 Experimental site……….. 4.2.2 Sampling and characterization……….. 4.2.3 Wet chemistry analyses………. 4.2.4. Spectral data……….. 4.2.5. Statistical analysis………. 4.3. Results………..
4.3.1 Forest floor composition and characterization……… 4.3.2. Enzyme activities……….. 4.3.3. Discriminating thinning effect by VisNIR reflectance ……… 4.4. Discussions……….. 4.4.1 Forest floor composition and characterization……….. 4.4.2 Thinning effects………. 4.5. Conclusions………..
Acknowledgements………..
Reference………
CAP 5 Building the Italian national soil spectral library……….
5.1 Introduction ………
5.2. Materials and methods……….
5.2.1 Soil sample………
5.2.2 Metadata……….
5.2.3 Spectra collection………
5.2.4 Library organization………... 5.2.5. Italian spectral variability from free large library……… 5.2.6. Calibration and validation………..
5.2.6.1 Pre-treatment of spectral data……… 5.2.6.2. Explorative analysis……… 5.2.6.3 Calibration of models ………..
5.3. Results and discussion………
5.3.1 Metadata: representativeness of Italian soil variability by Italian Spectral Library and a comparison with LUCAS……… 5.3.2 Spectral variability………..
5.3.3 Example modeling ………
5.3.3.1 Calibrating model for SOC prediction ………..
85 86 86 90 90 91 91 93 94 94 94 95 95 95 97 100 100 101 102 102 102 106 106 107 107 108 108 109 109 111 111 111 111 112 112 115 118 120
5.3.3.2 Comparing 10-fold and leave - one - out cross-validation ……… 5.4 Conclusions………..
Acknowledgements………..
Reference……… ………
6 CAP. 6 GENERAL CONCLUSIONS………...……….……….
Reference………..……….. 120 121 121 121 125 126
List of figures
Figure 1.1: Range of Electromagnetic radiation (Aenugu et al., 2011).
Figure 1.2: Soil spectra in VisNIR domain (400-2500 nm), showing approximately where the combination, first, second, and third overtone vibrations occur (Stenberg et al., 2010).
Figure 1.3: Schematic representation of an integrating sphere used to obtain a diffuse reflectance spectrum (modified by Springsteen, A. (1994)).
Figure 1.4: Spectral signatures of the most common soil minerals. Reflectance was augmented 1 unit for each signature. (Stenberg et al., 2010).
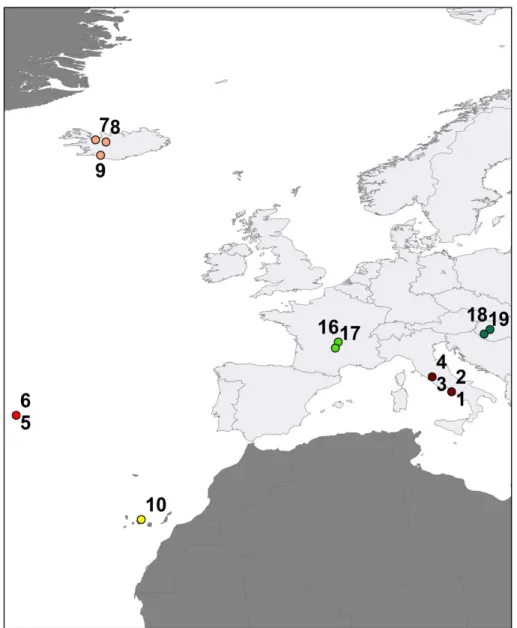
Figure 1.5: Overview of solutions for non-linearity (modified by Naes et al., 2002). Figure 2.1. Geographic distribution of European volcanic soils. 1-4: Italy; 5,6: Portugal (Azores); 7,8,9: Iceland; 10: Spain (Tenerife); 15,16: France; 18,19: Hungary.
Figure 2.2. Summary of the 67 soil spectra in reflectance (a) and their transformation (b) into log10(1/Reflectance) units used in the modelling.
Figure 2.3. Spectra reflectance of the Italian profiles (EUR1-4).
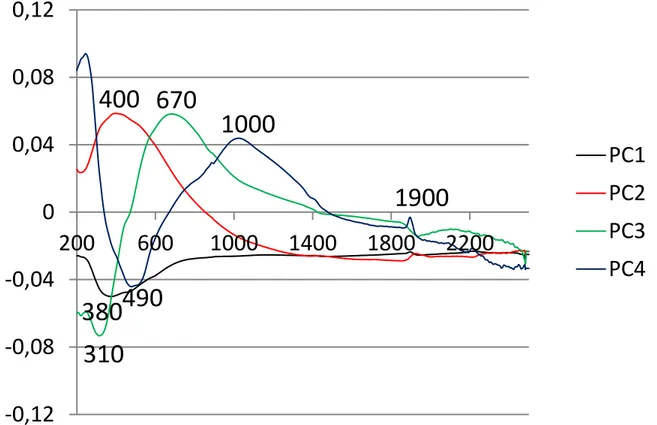
Figure 2.4: Loadings weights of the wavelengths in the first four PCs components
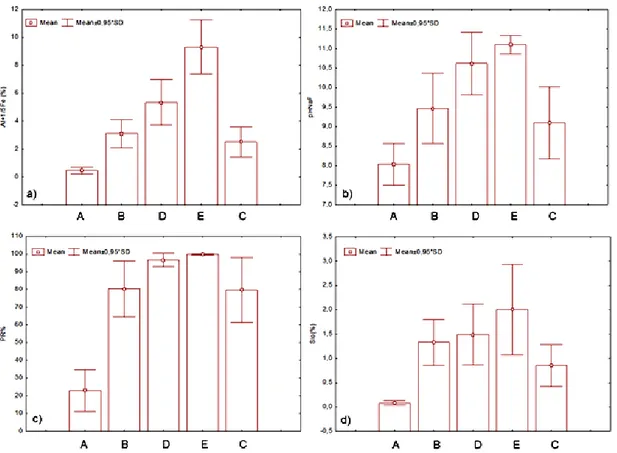
Figure 2.5: Andic parameters of the andic groups. a) mean values and standard deviation of Alo+1/2Feo; b) mean values of pHNaF; c) mean value and standard deviation of PR; d) mean
value and standard deviation of Sio.
Figure 2.6. Discriminant analysis of the soil samples grouped by andic degree. The biplot axes represent the first two dimensions that provide maximum separation among the groups.
Figure 2.7. Scatterplots of observed (x-axis) vs. predicted values (y-axis) for validation dataset of some soil parameters (starting from the top-left: Fed; Ald; Alo+1/2Feo; P ret); the
predictions were performed by Partial Least Squares Regression (PLSR). Full line is regression line, dashed line is target line.
Figure 2.8: Scatterplots of observed (x-axis) vs. predicted values (y-axis) for validation dataset of some soil parameters (starting from the top-left: Fed; Ald; Alo+1/2Feo; P ret); the predictions were performed by Supported Vector Machine (SVM). Full line is regression line, dashed line is target line.
Figure 3.1: Map of the investigated area. The field on the left with lower SOC % values is the conventional one, the field on the right with higher SOC% values is under 20 years of no tillage (ortophoto image from http://www.ign.es/iberpix2/visor/).
Figure 3.2: Mean values (± standard deviation) of Organic Carbon in the conventional field, after 20 years of no tillage practice, and in the scenarios after 5, 10 and 15 years no tillage.
Figure 3.3: Curves of the MDD as function of the sample size (n) and the pooled variance (σ2NT5: pooled variance after 5 years of no tillage, etc.)
Figure 3.4: Representative illustration of observed vs predicted OC%. Left: predictions obtained from geographically-local models. Centre: predictions obtained from spiked models. Right: predictions obtained from models with extra-weighted spiking dataset. First row: models obtained with a local sample size=8 (4+4). Second line: models obtained with a local sample size=12 (6+6). Third line: models obtained with a local sample size=22 (11+11). Fourth line: models obtained with a local sample size=56(28+28). Axes X: observed OC%; axes Y: predicted OC%.
Figure 3.5: Curves of the MDD as function of the sample size (n) and the mean variance of the four scenarios after 5,10, 15 and 20 years of no-tillage. Black symbols point at the
MDDWB that was for each scenario. On each line there are a black symbol and 4 red ones. The res symbols represent the MDDNIRc that can be obtained from data estimated by NIR models with different number size of the spiking dataset. The stars stood for the MDD reached when all the 148 (74+74) WB data were used. It coincides with the MDDNIR before the correction.
Figure 3.6: comparison of the costs of both approaches (DMDWB and DMDNIRc), in the 4
scenarios. The red line denotes the change to be detected in each. The grey area refers to the cost by WB for the analysis of the required samples and lines denote the NIR costs when different spiking datasets were used.
Figure 4.1: images from Montemorello forest (on the left) and its litter and soil profile (on the right) (by Lorenzetti et al., 2018).
Figure 4.2. a) Control (no thinning); b) Traditional thinning (thinning from below), c) Innovative selective thinning (growth and development of best trees are actively promoted by removing all directs competitors) (by http://lifeforesmit.com).
Figure 4.3. Discriminant Analysis of enzyme activities, showing separation among litter fractions and treatments within each fraction.
Figure 4.4: DAs of spectral properties, showing separation among treatments over the all forest floor.
Figure 5.1. FieldSpec 3Hi-Res equipment; soil sample measurement; pedoteca of CREA. Figure 5.2. The Italian national soil database, SISI. The map reported the relations which can be used to associate the metadata to the spectral signature. Separated tables collect data about: the site, the field information on the horizons, the routinely analytical analyses, the additional analyses and the methods adopted.
Figure 5.3. Spatial distribution of spectral information over the Italian territory according to the Italian spectral library (on the left) and LUCAS library (on the right).
Figure 5.4: Spectra of the soil samples showing the major absoption features, related to OH groups in both absorbed water (about 1400 and 1900 nm) and the crystal latticine (about 2200 nm).
Figure 5.5: PC score plots with sampling spectral groups (A:PC1-PC2, B:PC2-PC3, C:PC1-PC3) and loading plots for the entire data set (E: PC1, F: PC2, G:PC3).
Figure 5.6: PC1-PC2 score plots with sampling grouping according to texture ( fine: clay>40%; coarse: sand> 60%; medium: all the other
Figure 5.7: PC1-PC2 score plots with sampling grouping according to SOC content (%) Figure 5.8: PC1-PC2 score plots with sampling grouping according to total carbonate content (%)
Figure 5.9: Distribution of samples according to the OC content (%) in the model (A) and in the outliers (%) for the prediction OC content at national scale.
List of tables
Table 1.1: Characteristics of Visible and NIR domains
Table 1.2: Important VisNIR absorption bands in soil constituents (Hunt, 1977). Table 2.1. Soil characteristics of the 14 reference pedons of the European "COST-622” action sampled in different European countries
Table 2.2. Statistical descriptions of the main chemical properties of the 67 horizons (14 soil profiles): total organic carbon (TOC); aluminum (Ald), iron (Fed), manganese (Mnd)
extractable with dithionite citrate-bicarbonate; aluminum (Alo), iron (Feo) and silicon (Sio)
extractable with ammonium oxalate; aluminum (Alp), iron (Fep) extractable with pyrophosphate.
C.V.: Coefficient of variation; St.D. standard deviation.
Table 2.3. Spearman Rank Order Correlations between Principal components (PC1…4) and soil properties. Marked correlations (*) are significant at p <0.05
Table 2.4. Comparison of predictions using PLSR and SWM algorithms.
Table 3.1: Main statistics synthetic parameters of OC after 20 years of no tillage and in the hypothetic scenarios based on a linear increase during 20 years of no tillage; SOC values was calculated according to Eq.3.1; n was calculated by Eq.3.2.
Table 3.2: Prediction performance parameters for local, initial general calibration (Unspiked), spiked (Spk) and extra-weighted spiked calibrations (spkEW cleared): RMSEP (root mean square error of prediction), SEP (standard error of prediction), BIAS, R2 (coefficient of
determination), and RPD (ratio of performance to deviance). Predictive parameters were estimated on the same validation dataset of 96 samples.
Table 3.3: Mean and variance obtained by 148 predicted SOC values when the extra-weighted spiked calibrations were carried out using spiking subsets of 56, 22, 12 and 8 local samples, and their differences with the real data ( dσ2: deviation from the real pooled variance;
dΔSOC deviation from the real increase in mean SOC) The real data were calculated on the base of the 74 samples from each fields analyzed by WB.
Table 4.1. mean values of Biomass, C and N percentage and C/N ratio of forest floor. Table 4.2. Enzyme activities in the three litter fractions for the three thinning treatments, expressed as nmol mub g-1 h-1.
Table 4.3. Results from discriminant Function Analyses of VisNIR reflectance for the forest floor as a whole (LFH), and for the single fractions (p-level *<0.05; **<0.001; ***<0.0001; °<0.1).
Table 4.4: correlation between biochemical properties and spectral properties within the fraction and over all the forest floor samples.
Table 5.1: Main metadata of the Italian spectral library.
Table 5.2: Distribution of spectral signatures of the Italian spectral library across the WRB orders (CM: Cambisol; CL: Calcisols; LV: Luvisols; RG: Regosols; PH: Phaeozems; VR: Vertisol; AN: Andosols; KS: Kastanozems; AL: Alisols; LP: leptosols; GL: Gleysols; CH: Chernozems; FL: Fluvisols; LX: Lixisols; AR: Arenosol; AB: Albeluvisol; NT: Nitisol; ST: Stagnosol; SN: Solonetz).
Table 5.3: Main metadata of LUCAS library for the Italian territory
Table 5.4: Distribution of spectral signatures of LUCAS library for the Italian territory across the WRB orders (CM : Cambisols; LV: Luvisols ; RG: Regosols; FL: Fluvisols; VR: Vertisol; LP: leptosols; AN: Andosols).
Table 5.5: Partial least square regression results for SOC (back-transformed), clay, and total carbonate content, (using 1’st derivate Savistzky Golay derivate). Parameters referred to predicted values by 10-fold cross-validation; *: SD of the reference values.
Table 5.6: Descriptive Statistics (PC.smx) Excluded against employed
Table 5.7: Comparing PLSR efficiency parameters between 10-fold (*10) and leave-one-out (*f) cross-validation.
INTRODUCTION
Scientists agree that land – and particularly arable land – is a limited resource. Land is required for very different activities and purposes: it is needed for agricultural and forestall production of food, fiber, and energy, it is consumed to build villages, cities, industrial production plants, and all the infrastructures required for our style of living, it is demanded as space for leisure and recreation, and even used to get rid of any type of waste. The land has an imporant role in the regulation of water movement in the landscape, as environmental filter for metals, nutrients, and other contaminants, as biological habitat and gene reserve (Stenberg et al., 2010). The ability of a soil to support any of these functions depends on its structure, composition, and chemical, biological, and physical properties; and all of them are all both spatially and temporally variable (Blum, 1993; Bouma, 1997; Harris et al., 1996; Jenny, 1980; Karlen et al., 1997). The necessity to maintain these soil functionalities for this and the future generations, necessarily implies a sustainable use of the resource.
Sustainable use inevitably depends on a land-use planning and soil monitoring, based on an appropriated knowledge and interpretation of the information about soils, their characteristics, their dynamics and of course their geographic spatializations. The biggest limits to these data availability deal with the spendable amounts of time and money. Thus, in addition to traditional soil mapping and classical chemical analyses, supplementary approaches are growing their importance in order to use the available resources more efficiently. They are based on the possibility to estimate the target parameter by the use of predictions based on input data which can be investigated with a lower effort. They include geostatistical methods, remote sensing, and novel, fast and inexpensive analysis techniques. Among the authors, it is opened up this idea that Visible and Near Infrared spectroscopy can be considered as promising technique to generate a big amount of soil data due to the efficiency in reducing time and cost efforts. Some recent studies deal with quantifying time and cost savings by means of VisNIR (McBratney et al., 2006; Nocita et al., 2015). However further investigations should be carried out in order to define clearly the limits within VisNIR spectroscopy shows to outperform traditional wet chemistry approach, taking into account not only the costs of the analysis but also the effect of the error in estimation induces on the usefulness of the data.
Spectral soil properties have a cumulative nature that depends on the combination of soil components: organic matter and water content, but also from physical aspect as the soil particle size and their organization. For this reason, the spectral properties have the potentiality for being use as predictive information for estimation of both qualitative and quantitative soil parameters, and the field of its applicability in the soil science was being growing along the decades.
Numerous soil parameters were investigated on the base of VisNIR spectroscopy during the last years: it was often used to estimate SOC and its fractions as it usually achieved very good results. Many other properties were investigated, like clay content, iron oxides, cation exchange capacities, moisture content, several minerals (Hunt, 1977), as well as soil biological
properties like biomass and respiration rate (Viscarra Rossel et al., 2006; Stenberg et al., 2010), achieving different degrees of success.
Nevertless, the relations between spectral properties and some diagnostic soil properties are still poorly investigated, as for instance, the properties linked to volcanic soils. This kind of information could get stronger the success of VisNIR spectroscopy exploitation for taxonomic issue.
In the last years, a new goal of soil spectroscopy regards the possibility to assess soil variability and changes in soil conditions based directly on spectral data. This approach is based on the fact that spectral soil properties allow a holistic approach to soil, as many physical, chemical, and biological parameters contribute to soil reflectance. Therefore, estimating and comparing soil quality could be raise skipping the intermediary step of estimating soil properties. (Odlare et al., 2005; Islam et al., 2005; Dematte et al., 2004). Indeed, McBratney et al. (2006) suggested to estimate pedotransfer functions directly by spectral data.
Due to the fast and cheap acquisition of spectral data, both local and national and global databases have been growing, even available for free (e.g. LUCAS project (Toth et al., 2013)). The construction of large libraries has been promoted from the researchers to increase the predictability of VisNIR spectroscopy (Brown et al., 2005; Shepherd 2002).
Nocita et al. (2015) recently presented an extensive review of the state of the art of the general library. Among the Global libraries, the ICRAF-ISRIC world soil spectral library collected 4438 samples from Africa, Asia, Europe, North America, and South America; Viscarra Rossel and Webster (2012) described a large library of 21,500 Vis-NIR spectra from Australian continent; a spectral library covering the United States counts 144,833 Vis-NIR spectral signatures, (USDA, 2013); the European spectral library LUCAS consists of about 20,000 topsoil samples, collected from all over Europe (Stevens et al., 2013). Moreover, several national and regional soil spectral libraries have also been created.
As, to my knowledge, Italy doesn't own a national spectral library up to now, one of the objectives of this PhD was to collect spectra on the national territory and create a national spectral library. In line with recommendations in Nocita et al. (2015), the purpose was to start the building of the large library from scanning existing soil archives, reducing the need for costly sampling campaigns and assuring the reproducibility of analytical and spectral information.
Unfortunately, the lack of a standard for the collection of laboratory soil spectra (Nocita et al., 2015), represents at the moment an obstacle for sharing easily spectral libraries. Currently, the great increasing of spectral data availability does not run parallel to the possibility of their integrated use. Thus, a current question may be approached: what a national spectral library may add respect to a library available for free at global scale, in the frame of pedological investigations.
Given that, in this study it was proposed to address novel issues of soil spectroscopy in VisNIR domain, in agreement with what was stated till now. It aims to produce novel knowledge that could improve the use of VisNIR spectroscopy in soil science in order to increase the soil basic knowledge and the monitoring activities, which are both indispensable for a sustainable management of soil resource.
Thus, the specific focuses of the present work dealt with the following proposals:
• an application of soil spectroscopy for taxonomic purposed, focused on the classification of soil with volcanic features: the classification of soils represents a very expensive and time consuming practice, but it is a very powerful knowledge, since it summarize a wide range of information and can be a valid support for a right management of the soil resource.
• an estimation of the condition for a profitable use of soil spectroscopy with respect of wet chemistry, for monitoring change in soil organic Carbon, one of the most important and well predicted soil properties: the change in soil organic carbon content is currently one of the most important topic in the frame both of agricultural issue for farm productions, than of climatic change for the estimation of soil carbon stock capability.
• a comparison between biochemical properties and NIR spectra in checking the effects of little land use change: increasing the potential of monitoring the effect of a land use change by VisNIR spectroscopy may represent a support in the decision making process for the best management choices in the silvicoltural and agro systems.
• the creation of a Italian National Spectral Library since the lack of a large spectral library describing the Italian soil variability and a comparison with free available dataset: a new national library may represent the possibility to introduce big improvement in the knowledge of the soil properties of the soil both at national and local scale (by appropriate calibrations), according to the ability of the library to describe all the soil variability in the Italian territory.
CAP.1
SUBJECT OF STUDY
1. 1 Components and characteristics of soil
The spectroscopic investigations in this thesis had as objective the characterizations of the soil. The soil is one of the three materials covering the surface of the Earth, together with rocks and water. It results from the weathering of geological materials and death biomass (Blum et al., 2017).
According to Soil Taxonomy (1999) the soil is “a natural body comprised of solids (minerals and organic matter), liquid, and gases that occurs on the land surface and is characterized by one or both of the following: horizons, or layers, that are distinguishable from the initial material as a result of additions, losses, transfers, and transformations of energy and matter or the ability to support rooted plants in a natural environment.…. Soil consists of horizons near the Earth's surface that, in contrast to the underlying parent material, have been altered by the interactions of climate, relief, and living organisms over time”. Soil represents a crucial compartment as it is the basis of food production, a key player in climate and water regulation, a pool of biodiversity, a reactor to degrade contaminants. For this reason the concept of soil security is recently growing its importance (Koch et al. 2013), and it is clear the needing of more information and data to identify and describe soils and its functioning. This is why new ways of acquiring data are so important.
The soil is always an important component in the system comprising the lithosphere, the atmosphere and the biosphere. Soil properties reflect the varying nature of the interactions within this system (Rowell, 2014). Four basic components make up the soils, in a proportion depending on the environmental context. The mineral component is the dominant component in most of soils (with exception for organic soils) and it includes primary and secondary minerals, amorphous components, and water-soluble salts; the organic component is made up of dead biomass, the product of its decomposition and little living animals of the pedofauna; water and air are the other components. Soil constituents are not just mixed together, but form an organized soil body (pedon) of definite structure and distinctive chemical and physical properties. These properties determine the soil responses to the environment and to soil use (Blum et al., 2017). In this paragraph, a brief description of the soil constituents and properties was reported.
1.1.1 Mineral component of the soil
The minerals of the soil derive from the rocks which constitute the parent material. The primary minerals are incorporated into the soil when the rocks disintegrate by weathering. The primary minerals are decomposed into secondary minerals both through the chemical alteration, both through recrystallization of products. The most abundant primary mineral in the soil is Quartz, due to its high resistance to chemical alteration.
The most abundant secondary minerals are the clay minerals (phyllosilicates) and the oxy-hydroxides of Iron, Aluminum, Silicon and Titanium. The processes of alteration also produce carbonates, sulphates and phosphates. These secondary minerals are more stable in the soil the primary ones as they originate at the same temperatures and pressures conditions of the pedosphere. The secondary minerals represent the most abundant component of clay soil fraction. They are crystalline phyllosilicate (Jackson et al., 1981). Kaolinites, smectites and illite are the most common. Other less abundant clay minerals are Chlorite and Vermiculite.
1.1.2 The organic component of the soil
The soil organic matter (SOM) is a complex and heterogeneous set of organic, living and non-living components (excluding macrofauna and mesofauna) present in the soil. The SOM includes compounds which differ for chemical and physical composition, functions and dynamics They are the result of accumulation, degradation, decomposition and resynthesise of residues, carried out by microbial organisms, animals and plants living in the soil. SOM represent the source of plant nutrients, in particular N and also S and P. SOM has also an effect on water and air content, the temperature in the soil, and soil properties as cation exchange, fertility and structure.
SOM includes both humic and non-humic components. Humus is defined as a brown to black complex variable of carbon containing compounds not recognized under a light microscope as possessing cellular organization in the form of plant and animal bodies. Humus is separated from the non-humic substances such as carbohydrates (a major fraction of soil carbon), fats, waxes, alkanes, peptides, amino acids, proteins, lipids and organic acids by the fact that distinct chemical formulae can be written for these non humic substances. Most small molecules of non humic substances are rapidly degraded by microorganisms within the soil. Conversely, soil humus is slow to decompose (degrade) under natural soil conditions.
The components of humus are the Humic substances. They are Humic Acids, Fulvic Acids, and Humin. (Zanella et al., 2001). The Humic Acids are the major humic component of soil and although water insoluble under very acidic conditions (pH<2), are readily soluble at higher pH’s. They are dark brown to black in colour. The Fulvic Acids are water soluble in all pH conditions, and they are yellow to yellow-brown in colour. The Humin is the fraction of humic substances that is not soluble in water at any pH value and in alkali. Humins are black in colour.
Humus substances can be bound by various clay minerals through some linkages known as clay-humus complex. The complexes between humus substances and clays are mainly formed by bridging through the exchangeable cations like Ca, Mg and Al, so that humus substances penetrate into the inter layer space of the crystalline clay mineral lattice. The responsible for this process are mainly the earthworms by digestion, but also other animals like diplopods, chilopods, isopods. The clay-humus complex has both a direct and indirect effect over some important soil properties, including: the increase of soil ability to retain chemical elements and the improvement of the formation of stable aggregates.
The scientific literature of the 15 last years show that humic substances contribute little to total SOC, and are mostly an operational SOC fraction.
A very important fraction of soil organic matter is represented by the soil enzymes, even if quantitatively they are a minority, since all biochemical actions are dependent upon, or related to them.
Enzymes are proteins specialized in the catalysis of biological reactions. Although microorganisms are the primary source of soil enzymes, plants and animals also contribute to the soil enzyme pool. Soil enzymes are important for catalysing innumerable reaction necessary for life processes of micro-organisms in soils, decomposition of organic residues, cycling of nutrients and formation of organic matter and soil structure.
The extracellular portion of soil enzymes cam be stabilized and inactivated by humic substances by the formation of covalent bonding (Stevenson & Cole, 1999). The stabilization makes these enzymes less subject to microbial degradation and less active up to stop their function. However, many of these bonds are relatively weak during periods of pH change within the soil, these enzymes can be released.
Soil enzymes respond rapidly to any changes in soil management practices and environmental conditions. Their activities are closely related to physio-chemical and bio-logical properties of the soil. Hence, soil enzymes are used as sensors for soil microbial status, for soil physio-chemical conditions, and for the influence of soil treatments or climatic factors on soil fertility (Rao et al., 2014).
1.1.3 Water and air in the soil
The water and the air contained into the soil fill in a vicarious way the space between the particles and the aggregates of the solid materials (Blum et al., 2017). The air composition differs from the atmospheric one for a higher concentration of CO2, because of the effect of the
respiration of roots and pedofauna. The air in the soil in very important for allowing respiration under the surface and for the controlling role in the oxidation and reduction processes of the pedogenesis.
The water in the soil is a solution containing dissolved salts. A constant exchange of ions occurs between the solid phase of the soil and the liquid phase and between the latter and the roots of the plant. The content in water allows to make water and nutrient in the solution available for the plant and it is a driving force in the soil forming processes (Blum et al., 2017).
The water content is the balance between the input by precipitation and from groundwater, and the water lost for the canopy interception, evapotranspiration, surface runoff, and percolation.
Water is retained in the pores of the soil from the forces of capillary attraction. Because of polar nature of water molecules, soil solids attract water molecules. Soil water can be divided into categories, for descriptive purposes, based on its tension. The water that it is drained quickly from the ground after saturation is called gravitational water. Generally, it occupies larger pores at a pressure of 0.1-0.2 bar. The water capillary is, instead, retained in the smaller pores from
capillary forces of attraction, at a pressure between 0.1-31 bar. It represents the main source for the growth of vegetation. Water adsorbed strongly from the solids of the soil it is at a pressure above 31 bar it represents hygroscopic water (Brady, 1989).
1.1.4 Main chemical soil properties
Soil chemistry is the interaction of various chemical constituents that takes place among soil particles and in the soil solution—the water retained by soil.
The nutrient-holding capacity is a very important chemical property for the ecological function of the soil. Soils can hold onto nutritional elements thank to the adsorption of cations on the part of the negative charges on the soil particles. The ability to hold cation nutrients is called the cation-exchange capacity (CEC) and is an important characteristic of soils in that it relates to the ability to retain nutrients and prevent nutrient leaching (Curtaz and Zanini, 2012). Clay retains more nutrients than coarser soils, because of the greater surface area. A sand may have a CEC of under 10, a very low value. Any CEC above 50 is high, and such soils should be able to hold ample nutrients. Nutrient availability varies markedly according to pH. The best pH for overall nutrient availability is around 6.5, which is one reason why this is an optimal pH for most plants. In low-pH soils many cation-exchange sites are occupied by H+ cations and they cannot
hold other cations. Thus, if cations are not held by particles, they can leach out of the soil. Therefore, low-pH soils are more likely to be deficient in nutrients such as Magnesium, Calcium or Potassium (Curtaz and Zanini, 2012).
Along with ion exchange properties, two other important indices of the soil chemical environment are the reaction and redox potential.
Soil pH (or soil reaction), is a measure of the number of hydrogen ions (H+) present in a solution. The pH scale runs from 0 to 14 and it is a measure of alkalinity and acidity of the water solution into the soil. Soil pH ranges between 3 and 9, usually 3-7 in temperate and humid climate condition and 6-9 in warm conditions th et allow strong evapotranspiration.
The parent material of soils initially influences soil pH. For instance, granitic soils are acidic and limestone-based soils are alkaline. However, soil pH can change over time under the action of: rainfall, root growth and decay of organic matter by soil microorganisms, fertilization and irrigation. Changes in soil pH, whether natural processes or human activities cause them, occur slowly thanks to the high resistance of soil to change in pH (buffering capacity) (Curtaz and Zanini, 2012). The highest buffering capacities belongs to soils high in clay or organic matter (high CECs). Calcareous soils often have high buffering capacities as lime can neutralize acid.
The redox potential (Eh) indicates the tendency of a soil to be reduced or oxidized. Redox reactions are very important in soil genesis. Reduction, as a chemical process, occurs when an atom accepts an electron. This process increases the valence of an anion or decreases the valence
of a cation. Oxidation is the reverse process and occurs when an atom loses an electron. Oxidation–reduction (redox) reactions in soils are mainly controlled by microbial activity and the presence of a supply of carbon for the microbes. When the supply of oxygen for the respiration is terminated, as is the case under conditions of saturation, the microbial activities switch from aerobic to facultative and eventually to anaerobic respiration. Soils that remain saturated (gley) are chronically reduced (Fiedler et al., 2007).
The redox potential (Eh) is expressed as a function of the potential referred to the reaction of H+ in standard condition of temperature and pressure that is the lowest value of a
reduction occurring in a water solution. Thus, it is high if the redox system has a high oxidation power (Curtaz and Zanini, 2012). Eh in soils generally ranges between −1 and +1 V. This variation is due to the buffering effect or poise of water on redox reactions (O2/H2O; H2O/H2) (Bartlett and James, 1993, Bartlett and James, 1995). Changes of external conditions, such as precipitation and water table, temperature, and availability of organic matter, can all lead to changes in Eh values. Consequently, the redox potential can vary by several orders of magnitude both temporally and spatially (Gao et al., 2002, Vepraskas et al., 1999).
Salinity is also a feature belonging to the chemical properties. It concerns the of soil that refers to the amount of salts in the soil. It can be estimated by measuring the electrical conductivity (EC) of an extracted soil solution. Since low rainfall prevents leaching of salts, some soils, particularly in arid regions, may hold high levels of salt. Also clay soils are more prone to salt accumulation. Some fertilizers and amendments also can increase salinity. High level of salinity can affect plant growth in several ways, directly and indirectly: anhigh osmotic potential of the soil solution makes water absorption very difficult for the plant that has to use more energy; there may be some ion-specific toxicity; An imbalance in the salts content may result in a competition between elements leading to an interference with uptake of essential nutrients.
1.1.5. Main physical soil properties
Physical properties play an important role in determining soil suitability for agricultural, environmental and engineering uses. The retention availability, and movement of water and nutrients to plants, the easiness in penetration of roots, the air flow are directly associated with physical properties of the soil. Physical properties also influence the chemical and biological properties (Phogat et al., 2015). Here is a short discussion on the most relevant physical properties for plant growth.
Soil texture refers to the prominent size range of mineral particles<2 mm. The groups of different size range of mineral particles are known as textural fractions, namely: sand, silt and clay. Soil texture is the relative proportion of sand, silt and clay content on weight basis. There are three broad primary textural groups of soils (sandy, loamy and clayey) and twelve textural
classes (Soil Survey Staff, 2006). It is more or less a static property affecting almost all other soil properties (Phogat et al., 2015).
The soil particles in natural conditions are bonded together into larger units, called aggregates.
Soil structure is defined as the arrangement and organization of soil particles in the soil, and the tendency of individual soil particles to bind together in aggregates. The structure development is influenced by the amount and type of clay and the its binding with organic compounds; the amount and type of organic matter, since it provides food for soil fungi and bacteria and their secretion of cementing agents; the presence of iron and aluminum oxides as cementing agents; roots act as holding soil together, and protects soil surface. The aggregation creates intra-aggregates and inter-aggregate pore space, thereby changing flow paths for water, gases, solutes and pollutants. Water supply, aeration, availability of plant nutrients, heat, root penetration, microbial activity, and other soil characteristics and functions are strongly affected by the soil structure. Strong aggregation decreases detachability and transportability of soil particles by water or wind and thus, reduces runoff and soil erosion. It is affected by tillage, cultivation and application of fertilizers, manures, lime, gypsum and irrigation (Phogat et al., 2015). Four basic organizations summarize the types of soil structure: single grains; massive; granular aggregates, aggregates formed by segregation process such as drying and shrinking of clay minerals (angular and subangular blocky, play) (Blum et at., 2017)
The system of empty space kept clear by particles represents the soil porosity. The soil pore space between particles of soil in heathy soil are large and plentiful enough to retain the water, oxygen and nutrients that plants need to absorb through their roots. Soil porosity falls into one of three categories: micro-pores, macro-pores or bio-pores. These three categories perform different functions with respect to soil permeability and water holding capacity. For instance, water and nutrients in macro-pores will be lost to gravity more quickly, while the very small spaces of micro-pores are not as affected by gravity and retain water and nutrients longer. Soil porosity is affected by soil particle texture, soil structure, soil compaction and quantity of organic material. Silt and clay soils have a finer texture and sub-micro porosity th et allow to retain more water than coarse, sandy soils, which have larger macro-pores. Both finely textured soils with micro-pores and coarse soil with macro-pores may also contain large voids known as bio-pores. Bio-pores are the spaces between soil particles created by earthworms, other insects or decaying plant roots.
Bulk density (BD) is the density (mass per unit volume) of a dry soil including the pore space (Blum et al. 2017). The BD is influenced by texture, structure, moisture content, organic matter and management practices of soil. In coarse textured soils, it varies from 1.40 to 1.75 Mg m-3 while in fine textured soils, it normally ranges from 1.10 to 1.40 Mg m-3. The BD decreases
with increase in organic matter content and fineness of soil texture. Higher values of BD indicate more compactness of the soil (Phogat et al., 2015).
Another physical aspect of the soil regards its dynamic properties: when certain forces act on a body, the forces do not produce any bodily motion, but produce a relative displacement of particles of the body resulting in a change of shape or size or both of the body (Phogat et al., 2015). The most important dynamic properties for agriculture and ecosistemic soil function include soil consistency, crusting, compaction, and permeability. Consistency includes the strength of a soil to withstand an applied stress (rupture resistance); the rate of change and the physical condition soil attains when subjected to compression (manner of failure); the capacity of soil to adhere to other objects (stickiness), the degree to which reworked soil can be permanently deformed without rupturing (plasticity); the ability of soil in a confined state to resist penetration by a rigid object (penetration resistance). All of them depend from the state of cohesion and adhesion of the soil mass (Blum, 2017).
Soil crust is a thin compacted surface layer of higher bulk density than the soil immediately beneath which is formed due to dispersion of soil aggregates as a result of wetting and impact of rain drops, and its subsequent rapid drying. The thickness of crust may vary from mm to few cm depending upon the amount and type of clay, and silt content of the soil. Soils having organic matter less than 1% are more prone to crusting (Phogat et al., 2015).
Soil compaction is the process of increasing bulk density and reducing pore volume as a result of the applied pressure. It leads to destruction of larger pores, re-arrangement of solid particles and compression of air within the pore spaces in the soil. The degree of compaction depends upon the nature of clay minerals, type of exchangeable cations, water content and extent of manipulation of the soil. A compacted layer is commonly found just below the usually tilled layer of soil. The compacted layer often restricts root penetration and reduces water and nutrient uptake by crops (Phogat et al., 2015).
Permeability expresses the easiness with which soil allows fluid to pass through.
Soil colour is a physical property that gives an indication about the state of the pedological processes and the type of minerals in the soil. Under oxidized conditions (well-drainage) the red colour occurs, due to the abundance of iron oxide in the soil; the accumulation of highly decayed organic matter lead to due to dark colour; the presence of hydrated iron oxides and hydroxide give yellow colour; colours of soil matrix and mottles are indicative of the water and drainage conditions in the soil and hence suitability of the soil for aquaculture (Blum et al., 2017).
1.1.6 Soil quality
Safety of environmental condition as well all the soil functions are to be preserved for future generations (Reeves, 1997), and maintaining or improving soil quality is crucial.
Together with water and air quality, soil quality forms the environmental quality (Andrews et al., 2002). Differently from water and air quality that are limited to the degree of soil pollution (Carter et al., 1997; Davidson, 2000), soil quality has a broader definition. According to Doran & Parkin (1994, 1996), it is “The capacity of a soil to function within ecosystem and land-use boundaries to sustain biological productivity, maintain environmental quality, and promote plant and animal health”.
The great soil complexity leads to the need of defining soil quality with respect to the desired function (Giacometti et al., 2013). Thus, several soil physical, chemical and biological properties have been proposed for useful indicators of soil quality (Reeves, 1997; Arshad and Martin, 2002; Anderson, 2003; Schloter et al., 2003; Winding et al., 2005). Due to its influence over the other soil properties, SOM has been suggested as the most important single soil quality indicator (Giacometti et al., 2013). However, when soil quality has to be estimated in the frame of monitoring activity, it has to be taken into account the slow process of SOM changes induced by land use management, so to require a long time before being experimentally detectable (Rasmussen and Collins, 1991; Bending et al., 2004; Körschens, 2006). Moreover, biogeochemical mechanisms behind the observed modifications in SOM are not explained only by the SOM.
Since the soil microbiota mediates most of the soil processes (Dick, 1992) and it quickly adapts to environmental constrains by adjusting its biomass, activity rates and community composition (Schloter et al., 2003), microbial biomass and soil enzyme activities had been successfully applied as Soil quality indicators to measure the impact of land management on soil (e.g. Pajares, et al., 2009).
For a very exhaustive review over the soil quality indicators it is acltually possible refer to the recent publication by Bünemannet al. (2018).
1. 2 The Visible and Near Infrared Spectroscopy
1.2.1.1 Principles of Visible and Near Infrared Spectroscopy
One of the most important results of the quantum theory is th et all atoms and molecules can only be found in states with specific and characteristic values of energy. The central theme of spectroscopy is the study of the transitions between two different energy states of a system of atoms or molecules. The transitions take place with absorption or emission of energy in the form of electromagnetic radiation having a frequency n (or wavelength
) given by Bohr relation:
E=
hn = hc/
q 1.1]where
E is the variation of energy of a system, h the Planck constant, and c the light speed. Thus, the smaller is the variation of energy among the levels, the bigger the wavelength. The wavelength range of VisNIR is reported in the figure 1.1.Figure 1.1: Range of Electromagnetic radiation (Aenugu et al., 2011).
The transitions in the energy levels lead to variations in the energy state of an electron (electronic absorption) or in the movements of atomic nuclei (transition). These last movements can be transitional, rotational or vibrational. When an electromagnetic wave hits the soil it mainly generates vibrational movements and change in the energy state of an electron, while in many soil materials the molecular and rotational transitions are limited (Irons et al., 1989; Drury, 1993).
In the VisNIR spectroscopy the relevant energetic transitions are the electronic adsorption and the vibrational transition (Hunt,1977).
The Visible region is characterized by the electronic absorptions caused by the movement of electrons from one orbit to a higher-energy orbit (Næs et al., 2002). The spectral response in the Vis region is not very strong (Nocita et al., 2015). Neverthless, some authors had derived quantitative information from the spectra (Viscarra Rossel et al., 2006, Owen, 2000).
In the NIR the chemical adsorption mechanisms mostly consist in vibrational energy transitions into molecules. Indeed, these last typically require energy of a frequency that corresponds to the IR region of the electromagnetic spectrum. The vibrational movements consist in oscillations of an atom with respect to another, within the molecule. There are two types of vibrational movements: the molecular bond stretching and the inter-bond angles bending. The vibrational energy has quantized levels. A molecule can move from a vibrational energy level to a higher one by the absorption of photons of infrared radiation. The energetic transition between the fundamental level of energy and the first excited level is called fundamental vibration. Transitions may also occur between the fundamental level and second excited level or the following ones (overtones). The intensity of these successive abortions will decrease by a factor between of 10 and 100 (Næs et al., 2002). In particular, the NIR region shows overtone and combination modes of the fundamental atoms vibrations in molecules that
are active in mid- and far-infrared (Nocita et al., 2015). They may be liked to a specific bound or to the entire molecular structure.
Combination bands that appear between 1900 nm and 2500 nm are the result of vibrational interactions. For instance, their frequencies are the sums of multiples of each interacting frequency (Dyrby et al., 2002). The two or more fundamental vibrations sharing their absorption in a combination, can be observed separately in the MIR (middle infrared) range (tab.1.1). As a consequence of the combinations, in the NIR spectrum the absorptions occur at unexpected positions, and the regions of adsorption occur as broad peaks caused by the overlapping of multitude of different absorptions (Næs et al., 2002) (fig. 1.2).
Figure 1.2: Soil spectra in VisNIR domain (400-2500 nm), showing approximately where the combination, first, second, and third overtone vibrations occur (Stenberg et al., 2010).
Table 1.1: Characteristics of Visible and NIR domains
Visible NIR
Wavelength (nm) 400-760 760-2500
Wavenumber (cm-1) 25000-13200 13200-4000
Overtones and combination X
Electronic process X X
Absorption s related to electrons CH/OC/NH functionalities
1.2.1.2 The reflectance.
When an electromagnetic wave hits a material, it can be transmitted, reflected and absorbed. If the material is opaque, the transmittance cannot occur. This is the case of soil, where a part of the electromagnetic energy is reflected, and the other part is absorbed. The proportions
of absorption and reflection are wavelength dependent and provide information about the physical and chemical properties of the material (Clark, 1999).
The reflectance has two different forms: the specular reflectance and diffuse reflectance. The first one refers to the reflection occurring with the same angle of incidence. The diffuse reflectance refers to the reflectance that occurs at all other angles. It is expressed by the ratio of the intensity of the light reflected in all the directions and the intensity of the light of incidence perpendicularly on the reflecting object (Bédidi and Cervelle, 1993).
Diffuse reflectance is dominant when the particle size (or the roughness) is bigger than the ratio between wavelength and angle of incidence (Cervelle and Flay, 1995). If the material is opaque, like the soil, specular reflectance is very low (Siesler, 2008).
The total absorption of a specific material comprises a physical and a chemical component.
The physical component is mainly caused by the geometry of the measured surface (particle size, shape of particles,….), whereas the chemical component is related to the composition of the material.
For the measure of diffuse reflectance, a spectrophotometer is used. It is composed by a sphere with a white cover insight; a font of radiations and a detector for recording the reflected radiation. The intensity of the reflected radiation is collected in correspondence of a little pore where the sensor detector is located (figure 1.3).
Figure 1.3: Schematic representation of an integrating sphere used to obtain a diffuse reflectance spectrum (modified by Springsteen, A. (1994)).
The frequencies at which light is absorbed appear as a reduced signal of reflected radiation and are displayed in % reflectance (R), which can then be transformed to apparent absorbance (A):
The reflectance is usually referred to a white standard material with known reflectance. Spectralon (politetrafluoretilene) is one of the most adopted with reference surface, since it is very stable along the time, but also barrio sulfate or magnesium monoxide.
1.2.2 Soil Spectral signature signatures in the VisNIR domain.
A spectral signature of soil in the VisNIR domain is characterized by its general form, the intensity of the signal, and the specific adoption bands. These last depend on the electronic and vibrational transition that we have already mentioned. Both the mineral, organic and water components affect the soil spectrum. Several authors summarized the spectral properties of soil components.
1.2.2.1 The mineral component.
A huge work was published by Hunt, Salisbury et al., already in 1970-1976, about spectral properties of mineral and rocks. More recent reviews on soil spectral properties were carried out by Madeira Netto (1995) and Leone (2000).
The purity, the elemental composition and the crystalline structure of the primary minerals are all factors that determine the reflectance of the soil. The use of spectroscopy for the study of Quartz in the soil is rather complicated. Framework silicates such as quartz do not have prominent absorption features in the UV–vis–NIR region. Their intense fundamental vibrations occur in the mid infrared around 10,000 nm (Nguyen et al., 1991). Hunt (1977) found that small absorption bands occur near 850 nm, 1200 nm, 1400 nm, 1900 nm due to the vibrational combinations and overtones of molecular water contained in various locations in the mineral. Moreover, the isomorphic substitutions that may occur, lead to different reflective properties (Hunt and Salisbury, 1970).
The presence of clay minerals such as kaolinite [Al2Si2O5(OH)4], montmorillonite [
Na0.33(Al1..67Mg0.33) Si4O10(OH)2 ]. and illite [(Al2(Si3.85Al0.15)O10(OH)2)], induces an
absorption band near 2200 and 2300 nm because of the combination of vibrations associated with the OH bond and the OH-Al-OH bonds (Hunt et al.,1971 Chabrillat et al., 2002) The metal-OH bend plus O–H stretch combination near 2200 nm and 2300 nm are recognized to be diagnostic absorption features in clay mineral identification (Clark et al., 1990). The absorption features of kaolin, smectite and illite are similar. Specifically, Kaolinites and smectites differ for the presence of a band at 1900 nm. Viscarra et al., (2006) found that the spectrum of montmorillonite (the high-alumina member of the group of Smectites) is that of typical of a water-rich mineral with an intense absorption peaks at 1400 nm band which may be attributed to the first overtone of the O–H stretch, and also at 1900 nm band which is due to the combinations of the H–O–H bend with the O–H stretches. On the opposite site the spectrum of kaolinite only has a peak at 1400 nm band, indicating that only O–H is present, and only a small amount of water is included in the structure (Clark et al., 1990, Hunt and Salisbury, 1970, Goetz et al.,