Performance of upstream interaction region detectors for the FIRST experiment at GSI
This article has been downloaded from IOPscience. Please scroll down to see the full text article. 2012 JINST 7 P02006
(http://iopscience.iop.org/1748-0221/7/02/P02006)
Download details:
IP Address: 151.100.47.203
The article was downloaded on 18/11/2012 at 08:53
Please note that terms and conditions apply.
View the table of contents for this issue, or go to the journal homepage for more Home Search Collections Journals About Contact us My IOPscience
2012 JINST 7 P02006
PUBLISHED BYIOP PUBLISHING FORSISSA
RECEIVED: November 25, 2011
REVISED: January 10, 2012
ACCEPTED: January 20, 2012 PUBLISHED: February 13, 2012
Performance of upstream interaction region
detectors for the FIRST experiment at GSI
Z. Abou-Haidar,mC. Agodi,d M.A.G. Alvarez,mM. Anelli,a T. Aumann,v G. Battistoni,a
A. Bocci,mT.T. B ¨ohlen,r,sA. Boudard,q A. Brunetti,b,kM. Carpinelli,b,k
G.A.P. Cirrone,d M.A. Cortes-Giraldo,x G. Cuttone,d M. De Napoli,dM. Durante,v
J.P. Fern´andez-Garc´ıa,xC. Finck,p M. I. Gallardo,x B. Golosio,b,kE. Iarocci,c,h
F. Iazzi,f ,iG. Ickert,v R. Introzzi,f D. Juliani,pJ. Krimmer,yN. Kurz,vM. Labalme,o
Y. Leifels,v A. Le F`evre,v S. Leray,q F. Marchetto,f V. Monaco,f ,wM.C. Morone,g,z
P. Oliva,b,kA. Paoloni,c V. Patera,a,b L. Piersanti,c,hR. Pleskac,v J.M. Quesada,x
N. Randazzo,j F. Romano,d,uD. Rossi,v V. Rosso,l,nM. Rousseau,pR. Sacchi,f ,w
P. Sala,aA. Sarti,c,h,1C. Schuy,v A. Sciubba,c,hC. Sfienti,d,sH. Simon,v V. Sipala,j,k
E. Spiriti,e L. Stuttge,p S. Tropead and H. Younisf ,i
aIstituto Nazionale di Fisica Nucleare - Sezione di Milano, Milano, Italy bIstituto Nazionale di Fisica Nucleare - Sezione di Cagliari, Cagliari, Italy
cIstituto Nazionale di Fisica Nucleare - Laboratori Nazionali di Frascati, Frascati, Italy dIstituto Nazionale di Fisica Nucleare - Laboratori Nazionali del Sud, Catania, Italy eIstituto Nazionale di Fisica Nucleare - Sezione di Roma 3, Roma, Italy
fIstituto Nazionale di Fisica Nucleare - Sezione di Torino, Torino, Italy
gIstituto Nazionale di Fisica Nucleare - Sezione di Roma Tor Vergata, Roma, Italy
hDipartimento di Scienze di Base e Applicate per l’Ingegneria, “La Sapienza” Universit`a di Roma, Roma, Italy
iDipartimento di Fisica, Politecnico di Torino, Torino, Italy
jIstituto Nazionale di Fisica Nucleare - Sezione di Catania, Catania, Italy kUniversit`a di Sassari, Sassari, Italy
lIstituto Nazionale di Fisica Nucleare - Sezione di Pisa, Pisa, Italy mCNA, Sevilla, Spain
nUniversit`a di Pisa, Pisa, Italy
oLPC-Caen, ENSICAEN, Universite de Caen, CNRS/IN2P3, Caen, France pInstitut Pluridisciplinaire Hubert Curien, Strasbourg, France
qCEA-Saclay, IRFU/SPhN, Gif sur Yvette Cedex, France
2012 JINST 7 P02006
rEuropean Organization for Nuclear Research CERN, Geneva, Switzerland
sMedical Radiation Physics, Karolinska Institutet and Stockholm University, Stockholm, Sweden tUniversitat Mainz Johann-Joachim-Becher, Mainz, Germany
uCentro Studi e Ricerche e Museo Storico della Fisica “Enrico Fermi”, Roma, Italy vGSI Helmholtzzentrum fur Schwerionenforschung, Darmstadt, Germany
wDipartimento di Fisica, Universit`a di Torino, Torino, Italy
xDepartamento de Fisica Atomica, Molecular y Nuclear, University of Sevilla, 41080-Sevilla, Spain yIPN-Lyon, Universite de Lyon, Universite Lyon 1, CNRS/IN2P3, Villeurbanne, France
zDipartimento di Biopatologia e Diagnostica per Immagini, Universit`a di Roma Tor Vergata, Roma, Italy
E-mail:[email protected]
ABSTRACT: The FIRST (Fragmentation of Ions Relevant for Space and Therapy) experiment at
GSI has been designed to study carbon fragmentation, measuring12C double differential cross
sec-tions (∂2σ/∂θ∂E) for different beam energies between 100 and 1000 MeV/u. The experimental
setup integrates newly designed detectors in the, so called, Interaction Region around the graphite
target. The Interaction Region upstream detectors are a 250µm thick scintillator and a drift
cham-ber optimized for a precise measurement of the ions interaction time and position on the target. In this article we review the design of the upstream detectors along with the preliminary results of the data taking performed on August 2011 with 400 MeV/u fully stripped carbon ion beam at GSI. Detectors performances will be reviewed and compared to those obtained during preliminary tests, performed with 500 MeV electrons (at the BTF facility in the INFN Frascati Laboratories) and 80 MeV/u protons and carbon ions (at the INFN LNS Laboratories in Catania).
KEYWORDS: Wire chambers(MWPC, Thin-gap chambers, drift chambers, drift tubes, proportional chambers etc); Gaseous detectors; Scintillators, scintillation and light emission processes (solid, gas and liquid scintillators); Particle tracking detectors (Gaseous detectors)
2012 JINST 7 P02006
Contents
1 Introduction 1
2 The experimental setup 2
2.1 The Beam Test Facility (BTF) 2
2.2 The LNS zero degree test setup 2
2.3 DAQ system 2
3 The Start Counter 3
3.1 Start Counter performances: efficiency and time resolution 4
4 The Beam Monitor drift chamber 6
4.1 Track reconstruction 7
4.2 Hit detection efficiency 8
4.3 Spatial resolution 9
5 Detector performance in the FIRST experiment at GSI 11
5.1 Start Counter preliminary results 11
5.2 Beam Monitor preliminary results 12
6 Conclusions 14
1 Introduction
The FIRST (Fragmentation of Ions Relevant for Space and Therapy) experiment [1] is performed
at the GSI heavy ion synchrotron (SIS) in Darmstadt. Its aim is to measure carbon fragmentation on nuclei at different energies between 100 and 1000 MeV/u. The study of fragmentation processes is relevant to different fields of physics, including both basic research and applications. In parti-cular, different reaction mechanisms can be better understood by means of the analysis of double differential cross sections as a function of the energy and of the angle with respect to the beam.
The FIRST experimental setup consists of two main regions: the Magnet Region and the Interaction Region. While the former integrates an already existing setup composed by a dipole
magnet (ALADiN, [2]), a TPC (Music IV, [3]), a neutron detector (LAND, [4]) and a time of flight
scintillator wall, the latter is made up of newly designed detectors installed around the target.
The FIRST setup aims for a suitable particle identification capability providing a σM
M ≤ 10%,
(where M is the fragment mass). A 10% relative uncertainty on the fragment mass is mandatory in order to have a clear separation of all the ions and isotopes under study. The required precision on fragment mass directly translates into requirements on the time and momentum resolution for all the detectors used in the FIRST experiment. The mass measured in the spectrometer is given
2012 JINST 7 P02006
by M = k|R| f (β) where k =0.3Z
m0 and f (β) =
√
1−β2
β =βγ1 . The relative uncertainty on M is hence
related to the time and momentum resolutions by the relation
!σM M "2 =#σp p $2 +!γσt t "2 (1.1) where σp
p = σRR has been used.
The Interaction Region target upstream detectors are a thin scintillation counter (Start Counter), designed for triggering and timing purposes, a drift chamber (Beam Monitor) dedicated to a precise ion impinging point measurement and a pre-target fragmentation detection, while the downstream ones are a silicon Vertex Detector and a thick scintillator (Proton Tagger) used to detect light frag-ments produced at large angles.
In this paper we review the design of the upstream detectors as well as test beam results obtained with 500 MeV electrons (at the Beam Test Facility of the INFN LNF Laboratories in Frascati) and with 80 MeV/u protons and carbon ions (at the Zero Degree Line of the INFN LNS
Laboratories in Catania). Section2describes the experimental setup, the test beam facilities and
the DAQ for the two tests that have been performed. The Start Counter is described in section3,
the Beam Monitor in section4. The preliminary results of the FIRST experiment obtained at GSI
are shown in section5.
2 The experimental setup
2.1 The Beam Test Facility (BTF)
The drift chamber has been tested at the BTF experimental facility (figure1), with 500 MeV
elec-trons extracted in 10 ns spills at a frequency of 25 Hz. In each spill the number of elecelec-trons followed
a Poisson distribution with Ne=1. A lead glass calorimeter (Beam Dump) was used to select single
electron events. An example of the calorimeter charge distribution measured during the spills is
shown in figure2. The RF signal from the accelerator has been used to trigger the acquisition.
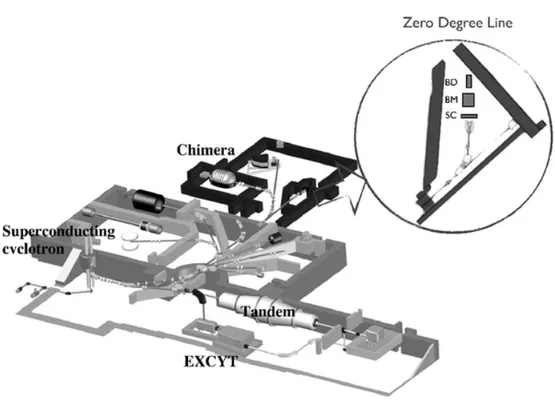
2.2 The LNS zero degree test setup
The experimental setup at the LNS zero degree line is shown in figure3. 80 MeV/u protons and
fully stripped12C ions were delivered at ∼1 MHz, in order to reproduce GSI-like conditions. A
4 × 4 × 8 cm3plastic scintillator (BC-404) was used as beam dump as well as a trigger. The event
rate was ∼ 1 kHz, due to the electronics dead time. 2.3 DAQ system
Both tests on beam shared the same NIM and VME electronics. While the former is used for the trigger logic and handles the dead time of the DAQ, the latter comprises a 64 channels
multihit-multievent CAEN V1190B TDC (with 100 ps time resolution and 1 µs window width) and a
16 channels CAEN V792N QDC (with 0.1 pC resolution over a charge conversion window ranging from 0 to 400 pC). Data acquisition is performed by means of a Motorola MVME5100 CPU. The low voltage for the electronics of the Start Counter and the Beam Monitor is supplied by a low ripple low noise quad independent DC channel GW INSTEK GPS4303, while a CAEN N1470
2012 JINST 7 P02006
Figure 1. Experimental setup at the BTF facility; the position of the various detectors is shown, as well as the other elements of the setup.
Charge (pC) 0 50 100 150 200 250 300 350 400 Entries / 1 pC 0 5000 10000 15000 20000 25000 30000 35000 40000 45000
Figure 2. Typical BTF beam dump calorimeter charge histogram. The various peaks shown in the histogram are related to 0, 1, ... , n detected particles.
four channels programmable HV power supply provides Beam Monitor high voltage. Every signal coming from the Start Counter has been split in order to measure both time and charge. Signals coming from the Beam Monitor are discriminated and then read by a TDC. Trigger time signal is also acquired in order to fix a time reference. During tests, temperature and pressure have been recorded by a barometric weather station.
3 The Start Counter
The Start Counter has been designed for triggering and timing purposes. It has been optimized through a careful balancing of detector time resolution (time of flight measurements will be used to discriminate the different fragments) and thickness minimization. The design goal was to have a pre-target particle interaction probability of less than 1% with respect to the on-target one, reducing to a negligible amount the Start Counter contribution to the cross section measurement systematics.
2012 JINST 7 P02006
Figure 3. Radioactive ion beam facility at INFN LNS. The experimental setup at the Zero Degree Line is shown as well as the other elements of the setup.
In FIRST a 5-8 mm thick graphite target was foreseen, so the final Start Counter layout, taking
into account the different material density and interaction cross sections, was designed as a 250µm
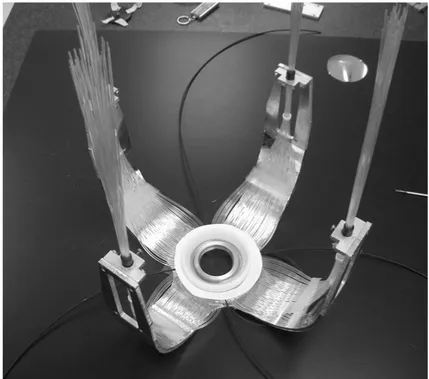
thick disc, 52 mm diameter, of plastic scintillator (EJ-228). Light is collected by means of 160, 1 mm diameter, step-index plastic optical fibers (reference standard: IEC 60793-2-40) radially glued and grouped in four bundles, and finally connected to four fast Hamamatsu UBA H10721-201 photomultipliers (40% quantum efficiency).
The fibers have a low attenuation (< 200 dB/km) for the scintillator output wavelength (400 nm) and their layout has been chosen in order to maximize the light collection from the scintillator. A
picture of the Start Counter is shown in figure4.
A temporal resolution of the order of 250 ps (standard deviation) must be achieved, in order to fulfill the precision on fragment time of flight measurement required by FIRST. The signals coming from the four photomultipliers are amplified by a factor of twenty by means of custom electronics boards, designed by the LNF electronics workshop and embedded in the detector. During LNS test beam the Start Counter has been tested, scanning different thresholds and different PMT gain values, in order to find the most suitable working point.
3.1 Start Counter performances: efficiency and time resolution
Two main parameters have been chosen to benchmark the Start Counter: efficiency and time reso-lution. The efficiency has been defined as the fraction of passing particles that fire at least 3 PMTs out of 4.
2012 JINST 7 P02006
Figure 4. Start Counter assembly.
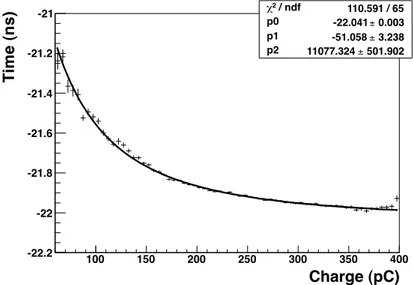
PMT time and charge information have been acquired in order to carry out time slewing cor-rection on carbon ions, so as to refine and adjust the final results.
The charge-time correlation distributions that have been used to compute the correction are
shown in figure5, choosing as fitting function:
T = p0+ p2
(Q − p1)2. (3.1)
No time slewing correction has been applied on proton data, since their measured charge variation was not appreciable.
To estimate the time resolution, after equalization of the delays of the four TDC channels, we performed a Gaussian fit to the time difference distribution of two Start Counter readout
photo-multipliers, as shown in figure6. All the possible combinations of photomultipliers were used to
measure the time resolutions, giving results consistent within 10 ps.
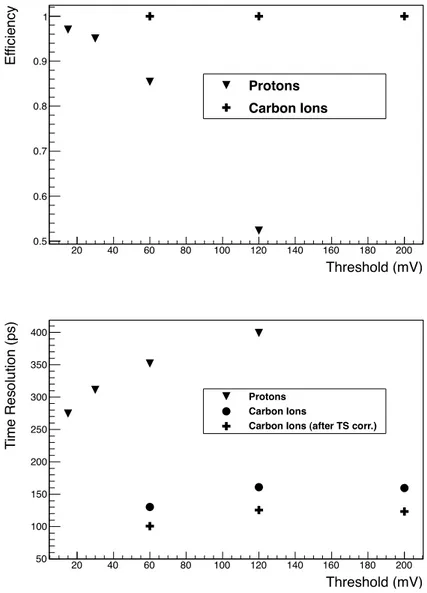
Using the data sample taken at LNS, both efficiency and time resolution have been evaluated as functions of the discrimination threshold with protons (∼ 1 M events) and with carbon ions
(∼1.5 M events). The results are shown in figure7.
Since the energy release of12C in the FIRST experiment is comprised between that of protons
(lower limit) and of 80 MeV/u carbons (upper limit) available at LNS, the results obtained with p
and12C must be interpreted as worst and best-case scenarios, respectively, for assessing detector
performances. For this reason the efficiency evaluated with carbon ions is very promising, showing a flat distribution consistent with 100% in the full threshold range, while the results obtained with protons are useful to constrain detector limitations.
2012 JINST 7 P02006
Charge (pC) 100 150 200 250 300 350 400 T im e ( n s ) -22.2 -22 -21.8 -21.6 -21.4 -21.2 -21 χ2 / ndf 110.591 / 65 p0 -22.041 ± 0.003 p1 -51.058 ± 3.238 p2 11077.324 ± 501.902Figure 5. Charge-time correlation distribution of a Start Counter PMT.
t (ns) Δ -23 -22.8 -22.6 -22.4 -22.2 -22 -21.8 -21.6 -21.4 -21.2 -21 Entries / 0.05 ns 0 1000 2000 3000 4000 5000 6000 Constant 6358.8979 ± 44.7866 Mean -22.1058 ± 0.0006 Sigma 0.1007 ± 0.0004
Figure 6. Time difference (∆t) distribution of two Start Counter readout photomultipliers, obtained on LNS data (Carbon ions). A fit with a Gaussian function is superimposed.
4 The Beam Monitor drift chamber
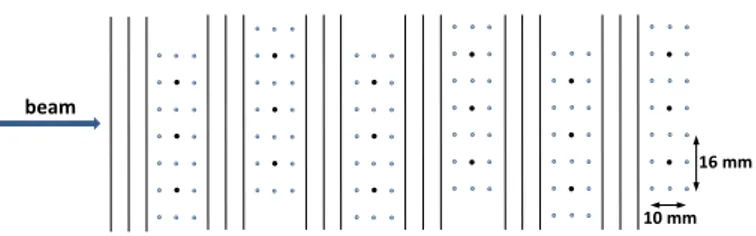
The Beam Monitor, shown in figure8, is a drift chamber designed for charged particles trajectory
reconstruction. This detector provides the ion impinging point on the target, together with valuable information on possible projectile pre-target fragmentation. The requirements for fragmentation measurements in FIRST are a single cell spatial resolution < 200µm with an high particle detection efficiency. The detector is made of alternated horizontal and vertical wire layers (or planes). Each layer is composed of three rectangular cells, 16 mm × 10 mm along the beam direction, for a total
of 36 sense wires (see figure9). The geometrical layout has been optimized in order to minimize
ions interactions with the wires still maintaining the required cell resolution. The twelve planes (six on each “view”) provide tracking redundancy and ensure a high tracking efficiency and an excellent spatial resolution. In order to minimize tracking ambiguities, the consecutive layers of each view
2012 JINST 7 P02006
Threshold (mV) 20 40 60 80 100 120 140 160 180 200 E ffi ci e nc y 0.5 0.6 0.7 0.8 0.9 1 Protons Carbon Ions Threshold (mV) 20 40 60 80 100 120 140 160 180 200 T im e R es ol ut ion ( p s) 50 100 150 200 250 300 350 400 Protons Carbon IonsCarbon Ions (after TS corr.)
Figure 7. Start Counter performances measured at LNS: the top picture shows the efficiency versus thresh-old for protons (full triangle) and carbon ions (full cross); the bottom picture shows the time resolution versus threshold for protons (full triangle), carbon ions with (full cross) and without (full circle) time slew-ing correction. Error bars (statistical uncertainty) are smaller than marker size.
are staggered by half a cell. Custom front-end electronics boards, designed by the LNF electronics workshop, are embedded in the detector and provide wire signal amplification by a factor of 10. Different gas mixtures, as well as operating high voltages, have been tested on electron, proton and carbon ion beams in order to choose the most suitable operating point. Hydrocarbons free mixtures are preferred because of safety issues.
4.1 Track reconstruction
The hits recorded by the Beam Monitor are used to reconstruct the trajectories of charged parti-cles in the detector active volume; furthermore, such information is fundamental to discriminate
2012 JINST 7 P02006
Figure 8. Beam Monitor mechanical drawing.
10 mm 16 mm
beam
Figure 9. Beam Monitor cells layout.
between single and multiple particle events. For this purpose, a custom tracking algorithm, based
on a simple least squares iterative fitting method (designed by P. Avery [5]), has been developed.
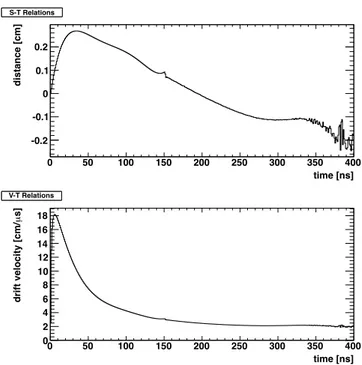
The temporal information of each hit, measured by the TDC, is converted into the distance from the fired sense wire using the space-time (s-t) curves, that in our post-processing routine are obtained with a data-based iterative procedure. In this way, we properly take into account the cor-rections to the initial assumption of a constant drift velocity (used as seed for the first iteration step). An example of s-t and velocity-time (v-t) relations, obtained at the end of the iterative
proce-dure, for the Beam Monitor chamber operated at 1.8 kV with a gas mixture of Ar/CO280%/20%,
is shown in figure10.
The spatial information extracted from s-t relations is then employed in a pattern recognition routine that selects track candidates to be fitted. Only “clean” events are used for this calibration, requiring at least three single hits on each view, and using only single hits to build the tracks. A single hit occurs when only one cell per plane is fired.
4.2 Hit detection efficiency
The chamber performances have been evaluated in terms of efficiency and spatial resolution. Datasets were available for 500 MeV electrons (∼ 7 M events) and for 80 MeV/u protons and carbon ions (∼
2012 JINST 7 P02006
time [ns] 0 50 100 150 200 250 300 350 400 distance [cm] -0.2 -0.1 0 0.1 0.2 S-T Relations S-T Relations time [ns] 0 50 100 150 200 250 300 350 400 s] µ drift velocity [cm/ 0 2 4 6 8 10 12 14 16 18 V-T Relations V-T RelationsFigure 10. Space (distance from wire) — time and velocity — time relations obtained operating the Beam Monitor at 1.8 kV with an Ar/CO280%/20% gas mixture. The small bump at 150 ns is induced by our mathematical description of the s-t relations, since it uses different parametrizations in the 0 to 150 and 150 to 400 ns ranges.
high voltages have been tested. In the analysis of the BTF data, the Beam Dump was used to reject events with more than one electron.
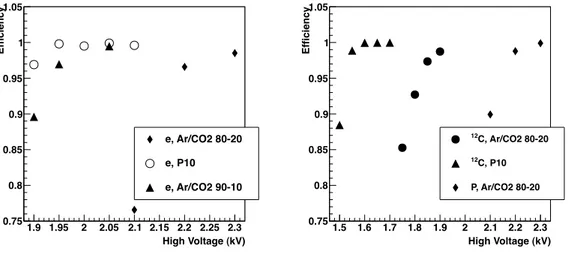
Two different algorithms have been used to define the efficiency. The first, referred to as raw efficiency, has been introduced in order to find a proper working point of the detector. In fact, raw efficiency is evaluated, for each plane, as the fraction of events that have at least one hit detected on even (odd) planes, when three single hits on odd (even) planes have been scored. Hence, this is a hardware-based definition that does not account for any tracking information. Raw efficiency
results, averaged over the two views and then over the entire chamber, are shown in figure11.
In order to assess the single cell efficiency with respect to the particle distance from the wires,
a second algorithm, based on the tracking method described in section4.1, has been defined. The
reconstructed tracks are used to compute the efficiency as a function of the closest distance of the charged particles from the sense wires. We found that the efficiency does not depend on the
distance showing a flat behaviour around the mean values as reported in figure11.
4.3 Spatial resolution
The drift chamber spatial resolution has been evaluated by means of the tracking algorithm
de-scribed in section 4.1, using the tracks reconstructed from the hits detected in the beam monitor.
For each hit in each plane we compute the difference (∆x, referred to as residual in the following)
between the measured position (xmeas) and the position of the track (xtrack). The distribution of∆x
is used to evaluate the spatial resolution of the detector. An example of the residuals distribution, fitted with a double Gaussian function, obtained for the Beam Monitor operated at 1.8 kV with a
2012 JINST 7 P02006
High Voltage (kV) 1.9 1.95 2 2.05 2.1 2.15 2.2 2.25 2.3 Efficiency 0.75 0.8 0.85 0.9 0.95 1 1.05 e, Ar/CO2 80-20 e, P10 e, Ar/CO2 90-10 High Voltage (kV) 1.5 1.6 1.7 1.8 1.9 2 2.1 2.2 2.3 Efficiency 0.75 0.8 0.85 0.9 0.95 1 1.05 C, Ar/CO2 80-20 12 C, P10 12 P, Ar/CO2 80-20Figure 11. Beam Monitor raw efficiency results obtained at BTF (left) and LNS (right) with different gas mixtures and high voltages.
Residual (cm) -0.4 -0.2 0 0.2 0.4 Entries 0 10 20 30 40 50 60 70 80 3 10 × 1 k 7.214e+04 ± 1.011e+02 µ -0.01586 ± 0.00002 σ 0.01179 ± 0.00002 2 k 1.17e+04 ± 4.53e+01 2 µ 0.01055 ± 0.00008 2 σ 0.02909 ± 0.00003
Figure 12. Residual distribution obtained with12C 80 MeV/u beam, operating the Beam Monitor at 1.8 kV with an Ar/CO280%/20% gas mixture. A double Gaussian fit is superimposed.
gas mixture of Ar/C02 80%/20% is shown in figure12. Spatial resolution results are shown as a
function of gas mixtures and high voltages in figure13. Test performed with the highly ionizing
12C 80 MeV/u beam confirmed that a space resolution of ∼ 60 µm can be achieved.
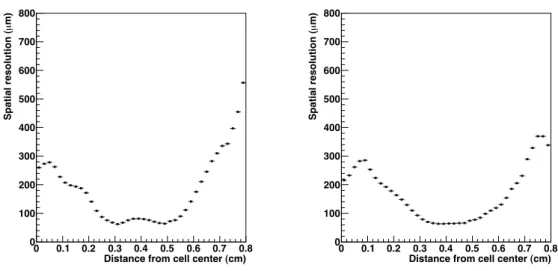
The study of residuals has been carried out also as a function of the track distance from the sense wire, building the residual distributions in several ranges of track-wire distances. The results
2012 JINST 7 P02006
High Voltage (V) 1.9 1.95 2 2.05 2.1 2.15 2.2 2.25 2.3 3 10 × m) µ Resolution ( 20 40 60 80 100 120 140 160 180 200 80-20 2 e, Ar/CO e, P10 90-10 2 e, Ar/CO 80-20 2 p, Ar/COFigure 13. Beam Monitor spatial resolution (σ) obtained for electrons (BTF data) and protons (LNS data) shown as a function of the applied voltage for different gas mixtures.
Distance from cell center (cm) 0 0.1 0.2 0.3 0.4 0.5 0.6 0.7 0.8 m) µ Spatial resolution ( 0 100 200 300 400 500 600 700 800
Distance from cell center (cm) 0 0.1 0.2 0.3 0.4 0.5 0.6 0.7 0.8 m) µ Spatial resolution ( 0 100 200 300 400 500 600 700 800
Figure 14. Beam Monitor single cell spatial resolution (σ) as a function of the distance from the sense wire. Left plot refer to electrons (BTF), right one to protons (LNS).
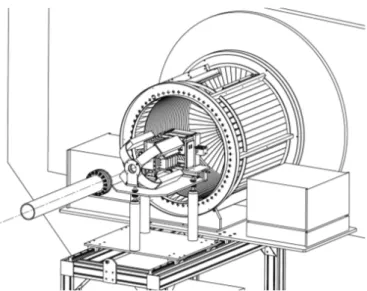
5 Detector performance in the FIRST experiment at GSI
The FIRST experiment took data on August 2011, performing 400 MeV/u12C collisions on 8 mm
graphite and Au targets. The Interaction Region installation at GSI is shown in figure15.
5.1 Start Counter preliminary results
The Start Counter performances have been measured with data from 400 MeV/u12C ions. In
or-der to asses the efficiency, two different strategies have been used: the first requires at least one photomultiplier fired when a carbon ion is traversing the detector, while the second strategy re-quires, instead, that all the photomultipliers must be fired. The efficiency, for an applied threshold of 30 mV, showed an excellent stability during the data taking: a mean value of 99.7% with and
2012 JINST 7 P02006
Figure 15. Interaction Region installation at GSI.
RMS of 0.15% is measured using both strategies. Since the results agree within the statistical un-certainties one can infer that whenever a photomultiplier is fired all the others are fired as well. The efficiency has been evaluated with respect to a trigger signal only for a subset of the collected data. Also the time resolution has been measured as a function of the run number by fitting the time difference distribution between two selected photomultipliers with a Gaussian function. The time resolution showed an outstanding stability (RMS ∼2 ps) during all the experiment, with a
maximum fluctuation of ≈ 5 ps around an average value of σt ≈ 150 ps (that is, as expected, a
behavior comprised between that of protons and of 80 MeV/u carbon ions used during our tests). Those small fluctuations are also an indication of the very good performance uniformity of the Start Counter over its area, since during the various runs the beam spot was moved in the horizontal
(x) and vertical (y) directions for several millimiters (see section5.2and figure19).
5.2 Beam Monitor preliminary results
The Beam Monitor was operated, at GSI, at 1.8 kV with an Ar/CO2(80%/20%) gas mixture. A
typi-cal example of particle reconstructed trajectory (from a carbon ion traversing the detector), is shown
in figure16. The size of the circles is directly proportional to the particle distance from the wire.
The number of hits detected with the drift chamber when the detector is perfectly perpendicu-lar to the beam, is 12 (six on each view). With the FIRST data we observe a distribution centered around 13 with and RMS of ∼0.3. That is a proof of the very good stability of the Beam Mon-itor performances during the data taking and an indication of a slight misalignment of the Beam Monitor with respect to the beam direction, causing a geometrical cross-talk effect.
Drift chamber spatial resolution, evaluated using FIRST data of 12C-C collisions by means
of the same strategy discussed in section 4.3, has an average value of σx = 140 µm. Once the
residuals distribution is obtained, an additional study has been carried out in order to measure the spatial resolution as a function of the wire distance. The results of this dedicated study are reported
2012 JINST 7 P02006
77.4 53.3 112.1 63.2 163.1 39.2 chi2 = 11.47 0 0 0 0 0 0 plane 0 plane 1 plane 2 plane 3 plane 4 plane 5 297.8 12.0 83.7 23.2 223.7 34.2 0 0 0 0 0 0 plane 0 plane 1 plane 2 plane 3 plane 4 plane 5Figure 16. Beam Monitor event display for carbon ions traversing the detector.
Distance from cell center (cm)
0 0.1 0.2 0.3 0.4 0.5 0.6 0.7 0.8 m) µ Spatial resolution ( 0 50 100 150 200 250 300 350 400
2012 JINST 7 P02006
x (cm) 0.2 0.4 0.6 0.8 1 1.2 y (cm) -0.8 -0.6 -0.4 -0.2 0 0.2 0.4 0.6 0.8 0 1000 2000 3000 4000 5000 6000 7000Figure 18. GSI beam spot as reconstructed by the drift chamber.
x BS position (cm) -0.4 -0.2 0 0.2 0.4 0.6 0.8 1 y BS position (cm) -0.4 -0.2 0 0.2 0.4 0.6 0.8 1
Figure 19. Mean beam spot position (BS), in the x,y plane, recostructed using the Beam Monitor from the full FIRST data sample. Each point is related to a given run.
Finally, after all the tracks have been reconstructed, we could measure the GSI beam spot as
it was seen by the drift chamber just before the target, shown in figure 18. The mean beam spot
position, as reconstructed in the various runs taken from FIRST experiment is shown in figure19,
showing that variations of few millimiters occurred during the data taking.
6 Conclusions
We have developed the upstream Interaction Region detectors for the FIRST experiment: the Start
Counter, a fast scintillator (250 µm thick) used for trigger and timing purposes and the Beam
2012 JINST 7 P02006
A functional test of FIRST upstream Interaction Region detectors has been carried out at theLNF Beam Test Facility and at the LNS Zero Degree Line. The aim of the test was to verify the Beam Monitor and Start Counter performances as well as to find the most suitable working point in GSI-like conditions. Both detectors have been successfully operated, fulfilling FIRST require-ments: a Start Counter time resolution less than 250 ps and a Beam Monitor spatial resolution of
the order of 100µm have been measured in a wide range of configurations. The FIRST experiment
took data on August 2011, performing 400 MeV/u12C on 8 mm graphite collisions (≈ 18 M events)
and12C on Au (≈ 2 M events). Both the detectors ran smoothly, showing a very stable behavior
for the entire duration of the experiment. The detectors have completely matched the expectations:
the measured time and spatial resolution are respectivelyσt ≈ 150 ps and σx≈ 140 µm.
Acknowledgments
We would like to thank B. Buonomo L. Foggetta, A. Mengucci and F. Romano for their generous help in the preparation and pursuance of the BTF and LNS test. We would like to acknowledge M. Arba, L. La Delfa and M. Tuveri (INFN Sez. Cagliari), M. Anelli, S. Cerioni, G. Corradi, D. Riondino and R. Rosellini (INFN, LNF) , M. Magi (Dipartimento di Scienze di Base e Appli-cate per l’Ingegneria, Universit`a di Roma “La Sapienza”), M. Capponi and A. Iaciofano (INFN, Sez. Roma3) for the technical design and mechanical work on the Interagion Region, and Filippo Bosi (INFN Sez. Pisa) for his help and suggestions. We would like also to acknowledge the sup-port given to the FIRST experiment from Prof. C. Scheidenberger and the GSI accelerator staff.
This work has been supported by the European Community FP7 - Capacities, contract ENSAR n◦
262010. This work was also supported by Junta de Andalucia and the Spanish Ministerio de Cien-cia e Innovacion Contracts P07-FQM-02894, FIS2008-04189 and FPA2008-04972-C03. Finally some of the authors would like to thank CNRS-In2p3 for the support. The research leading to these results has received the financial support of the Belgian company Ion Beam Applications (IBA).
References
[1] V. Patera, Nuclear physics experiment for hadrontherapy application,Nuovo Cim.C 34 (2011) 179. [2] J. Hubele et al., Fragmentation of gold projectiles: From evaporation to total disassembly,Z. Phys.A
340 (1991) 263.
[3] G. Bauer et al., A multiple sampling time projection ionization chamber for nuclear fragment tracking and charge measurement,Nucl. Instrum. Meth.A 386 (1997) 249.
[4] LAND collaboration, T. Blaich et al., A Large area detector for high-energy neutrons,Nucl. Instrum. Meth.A 314 (1992) 136.
[5] P. Avery, Applied Fitting Theory I, General Least Squares Theory, (1991),