Edgardo Sica*
TOURISM AS DETERMINANT OF ECONOMIC
GROWTH: THE CASE OF SOUTH-EAST ASIAN
COUNTRIES
WORKING PAPER 3.169 Novembre 2005
* Faculty of Economics – University of Foggia, Largo Papa Giovanni Paolo II, 1, 71100 – Foggia (Italy) – [email protected]
1. Introduction ... 5
2. Tourism and growth: a recent literature review... 7
3. Case-study ... 11
3.1 Tourism to South-East Asian and Pacific Countries: trends and characteristics ... 12
3.2 Description of model and variables used ... 14
3.3 Econometric methodology... 16
3.4 Results and comments ... 16
4. Conclusions ... 20
References ... 23
APPENDIX A.1 – Countries analyzed... 25
ABSTRACT
Today tourism represents one of the most dynamic economic sectors in the world. Even if the majority of international tourism still takes place within the developed world, recently tourism to developing countries is becoming a significant and increasing phenomenon, mainly to South-East Asian and Pacific countries. This study aims to verify if tourism represents a determinant of growth in such countries. Following recent empirical literature about growth, and mainly Eugenio-Martin, Morales and Scarpa (2004), a dynamic panel data model is adopted here to test for convergence. Results confirm the importance of tourists arrivals on the economic growth.
1. Introduction
Nowadays, tourism represents one of the most important and dynamic sectors in the world economy (Neto, 2003; Balaguer and Cantavella-Jordà, 2002; Jamieson, 2000; Lanza and Pigliaru, 1999). Together with related activities, tourism and general travel not only represent 11% of world GDP, but exports of tourism services are about 6-7% of total exports of goods and services (Roe, Ashley, Page and Meyer, 2004: 6).
Although the majority of international tourism still takes place within the developed world, recently tourism to developing countries is becoming a significant and increasing phenomenon. According to WTO, today over 40% of global tourism arrivals take place in the developing world. Such phenomenon has attracted the attention of economists in order to understand if tourism can actually represent a key-sector for economic growth and development in developing countries. The growing flows of tourism, in fact can determine both considerable positive and negative consequences on local economies. Nevertheless, the contribution of tourism activity to a country’s economy is not easily recognized not only because tourism involves many different products (such as transportation, mails, entertainment, etc.) but also because some products (for example, a meal in a restaurant) can be sold to both tourists and local residents. In this sense, tourism does not represent a clearly identifiable industry (Tohamy and Swinscoe, 2000). Anyway, tourism determines employment and business opportunities for local people and represents, therefore, a source of income for receiving countries (Holloway, 1998). Moreover, when the existing labor market provides few employment opportunities, tourism can often represent the only source of employment for “weak” labor-force, such as women, unskilled and semi-unskilled workers, and poor rural people (Roe et al., 2004). Tourism contributes to government revenues through taxes on incomes from tourism business and through taxes on goods and services provided to tourists, such as room taxes, departure taxes, and value added taxes (Taylor, Fredotovic, Povh and Markandya, 2003). Moreover, since tourism requires public infrastructure and utilities, it can stimulate the local government in making infrastructure improvements, leading positive benefits on local populations (Roe et al., 2004). In the end, tourism not only represents the main source of foreign exchange earnings for many developing countries (Woods, Perry and Steagall, 1991), but can also helps to diversify the economy, since represents a good alternative to more traditional sectors
in developing countries’ economies, such as agriculture and manufacturing (Vaugeois, 2000). Moreover, many of these effects are often enhanced by the so-called “multiplier effect” which occurs since money spent by tourists will be re-spent by recipients, augmenting the total. Together with benefits, tourism can lead several negative effects to the local economies. Criticism has been expressed as regards to employment generated: in fact, tourism sector is often characterized by seasonality both natural (because of climate) and institutional (because of the distribution of holydays). As a consequence, tourism employment frequently exhibits “seasonal peaks” involving the hiring of temporary and part-time jobs. This does not either determine job-security or stimulate investment in job-training (see New Zealand Parliamentary Commissioner for the Environment, 1997: 38-40). Tourism determines an increase in demand for good and services asked by travelers with a consequent increase in prices also for local people which can be compensated only if their incomes raise proportionally. However, one of the most important negative aspects determined by tourism is represented by “leakages”. These represent the amount of taxes, profits and wages which are paid outside a country and which have to be subtracted from the amount of tourist expenditures in order to obtain the “direct income” of that area. In other words, part of the receipts from tourism does not remain in a tourism area, diminishing the beneficial consequences of tourism flows. This is especially the case of developing countries, where tourists often arrive thanks to all-inclusive package tours bought in their home countries. In this way, large percentages of travelers’ expenditures leave the local economies: according to Pleumarom (1999), more than two-thirds of the revenues from international tourism, sometimes, do not reach the local economies.
Despite all these possible economic consequences from tourism, there are few empirical studies that seek to establish its importance as a determinant of economic growth. Economists, in fact, have taken into account many variables potentially influencing growth, but, rarely, tourism.
The purpose of this study consists in analyzing if tourism can actually represent a determinant of economic growth. Using a panel dynamic model, it analyzes the case of South-East Asian and Pacific countries, since such countries have faced a substantial increase of tourism flows in the 1990s. It is organized in the following way: section 2 explores the
recent economic literature about tourism and growth. Section 3 reports the case-study and section 4 concludes with some final remarks.
2. Tourism and growth: a recent literature review
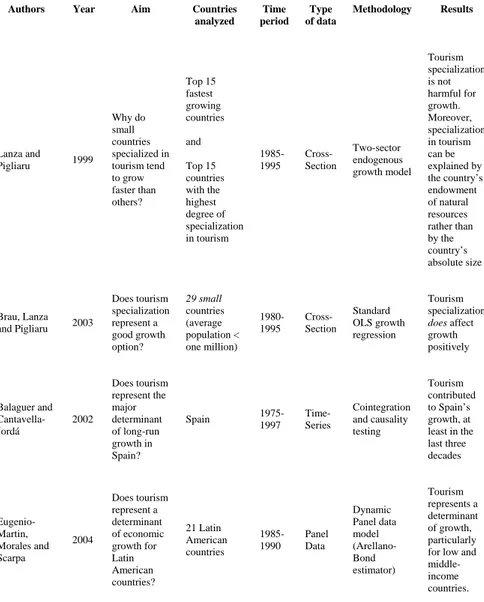
Even if, theoretically, tourism may affect the growth of a country, there is little concrete evidence to support this intuition. Economists, in fact, rarely analyzed the relationship between tourism and growth: the classical literature about economic growth takes into account many determinants of growth but not tourism. The few recent studies that analyzed empirically the relationship between tourism and growth are very heterogeneous: they differ each other, not only in terms of data, period of time and methodology adopted, but mainly in terms of aims. In fact, despite some more “generic” empirical works which explore tourism as possible determinant of growth (such as: Balaguer and Cantavella-Jordá, 2002 and, especially, Eugenio-Martin, Morales and Scarpa, 2004), other studies centre upon more specific aspects regarding tourism, trying to analyze, for example, if small countries specialized in tourism tend to grow faster than other countries (Lanza and Pigliaru, 1999 and, later, Brau, Lanza and Pigliaru, 2003). Table 2.1 summarizes the main recent works about tourism and growth, stressing the most important differences across the studies.
Table 3.1. Comparative table about the main recent studies on tourism and growth.
Authors Year Aim Countries
analyzed Time period Type of data Methodology Results Lanza and Pigliaru 1999 Why do small countries specialized in tourism tend to grow faster than others? Top 15 fastest growing countries and Top 15 countries with the highest degree of specialization in tourism 1985-1995 Cross-Section Two-sector endogenous growth model Tourism specialization is not harmful for growth. Moreover, specialization in tourism can be explained by the country’s endowment of natural resources rather than by the country’s absolute size Brau, Lanza and Pigliaru 2003 Does tourism specialization represent a good growth option? 29 small countries (average population < one million) 1980-1995 Cross-Section Standard OLS growth regression Tourism specialization does affect growth positively Balaguer and Cantavella-Jordá 2002 Does tourism represent the major determinant of long-run growth in Spain? Spain 1975-1997 Time-Series Cointegration and causality testing Tourism contributed to Spain’s growth, at least in the last three decades Eugenio-Martin, Morales and Scarpa 2004 Does tourism represent a determinant of economic growth for Latin American countries? 21 Latin American countries 1985-1990 Panel Data Dynamic Panel data model (Arellano-Bond estimator) Tourism represents a determinant of growth, particularly for low and middle-income countries.
As table 2.1 shows, one of the few recent studies about tourism was developed by Lanza and Pigliaru (1999). Looking at World Bank data about the top 15 fastest growing countries in per capita income over the period 1985-1995, and about the 15 countries with the highest degree of
specialization in tourism1, they noted how 7 countries out of 15 were in common to both such groups. Moreover, all 15 countries specialized in tourism were small countries. Therefore, they underlined how “(i)
tourism specialization can make a country grow fast; (ii) countries specialized in tourism are generally small ones” (Lanza and Pigliaru,
1999: 4). In order to explain why small tourism countries tend to grow faster than other countries, the authors used a two-sector endogenous growth model based on Lucas’ (1988) approach. In this way, they first demonstrated that tourism specialization is not harmful for growth and, then, suggested that the condition required for small countries to specialise in tourism is represented by endowment of natural resources rather than by their absolute size.
Later, Brau, Lanza and Pigliaru (2003) analyzed if specializing in tourism represents a good option for less developed countries. The authors used a dataset of 143 countries for which at least 10 years of annual data on per capita GDP adjusted for differences in purchasing power parity were available. Among these countries only 29 could be defined as small countries, having an average population < one million over the period 1960-1995. 14 countries out of 29 presented a degree of tourism specialization2 greater than 10%3 on average over the period 1980-19954; the remaining 15 small countries had a degree of tourism specialization smaller than 10% over the same period. Using standard OLS growth regressions, Brau et al. documented the real per capita GDP growth for each sub-group over 1980-1995, comparing the results. They noted how the 14 small countries with a share of tourism receipts in GDP greater than 10% showed a positive average growth rate (= +2.4%), while the remaining 15 small countries not specialized in tourism presented a negative average growth rate (= -0.2%)5. Moreover, considering other sub-sets of countries (such as: OECD, Oil and Less Developed Countries
1
The authors defined the degree of specialization in tourism as share of international tourism receipt with respect to the value added.
2
Brau et al. defined the degree of tourism specialization as the “International Tourism receipts/GDP at market prices ratio”.
3
10% represents the demarcation value adopted by the authors in order to classify a country as “tourism country”.
4
The first year for which data about international tourism receipts were available was 1980.
5
This result is independent of the demarcation value adopted: using 20% instead of 10%, for example, the results were unaffected.
– LDCs), the 14 small tourism countries grow faster all other sub-groups. On the opposite, the 29 small countries, as whole, showed a real per capita GDP growth greater than the Oil and the LDCs countries, but lower than the OECD countries. Therefore, the authors remarked how tourism specialization is beneficial for growth since represents “the key to
understanding why small countries are not at disadvantage with respect to larges ones” (Brau et al., 2003: 8). Moreover, they found that the
positive performance of tourism countries cannot be explained by the traditional growth factors of Mankiw, Romer and Weil’s (1992) model, as the fact that such countries were poorer than average, or that they had high saving/investment propensities, or that they were more open to trade. In other words, tourism specialization represents an independent determinant of economic growth
Balaguer and Cantavella-Jordá (2002) explored the role of tourism for the economic growth of Spain using cointegration and causality testing. Assuming that Spain is a small open economy, the authors used a time-series model including only three relevant variables, such as: real GDP, international tourism earnings in real terms and real effective exchange rate, the latter representing a proxy variable of external competitivity. In order to adopt the correct methodology and to avoid any spurious inferences, Balaguer and Cantavella-Jordá tested stationarity of time series using the Dickey-Fuller and the Phillip-Perron unit root tests for both levels and first differences of each variable. Since variables resulted as nonstationary, being all integrated of order 1, the authors used Johansen’s cointegration methodology (for more details see Balaguer and Cantavella-Jordá, 2002: 880). Moreover, they included several lags for each variable in order to capture the short-run dynamics of the model. This methodology led to a cointegration relationship among the variables, indicating that the expansion of international tourism (together with the external competitivity), in the last three decades, contributed to the rapid economic growth of Spain. Moreover, their findings confirmed the presence of multiplier effects from tourism and suggested the importance of government policies in the promotion of tourist activity.
In the end, Eugenio-Martin et al. (2004) analyzed the relationship between tourism and economic growth for Latin American countries over the period 1985-1990. Using a dynamic panel data model, they found that the growth of inbound tourists flows determined positive consequences in terms of growth for the countries analyzed. Because of the presence of the lagged dependent variables among the regressors, the authors
estimated their model using the Arellano-Bond estimator, finding the tourism coefficient significant at 10% level and with the expected positive sign, which confirmed the importance of tourists arrivals on the economic growth. Moreover, Eugenio-Martin et al. grouped Latin American countries into three different groups according to the level of income per capita, finding that tourism may represent an opportunity for growth only for low and middle-income countries. In other words, if a country is already developed, tourism does not affect the further process of economic growth.
The papers discussed above represent the only few recent empirical works on the relationship between tourism and economic growth. But, which is the reason for the lack of interest, by economists, about tourism as possible determinant of growth? One possible reason is that tourism represents a relatively recent phenomenon, particularly to developing countries. Tourism became one of the main sectors at world level only during the last decades. Moreover, some developing countries only recently have taken into account tourism as a concrete tool for development and improvement of living standards, following, therefore, a process of specialization in this sector. In this sense, several countries (mainly small islands) showed successful results and, likely, this has attracted, only at present, the attention of economists. Another possible explanation about the scarce interest of economists regarding tourism as a possible engine of tourism can depend upon the characteristics of tourism sector. As underline before, tourism’s economic contribution can be sometimes not clearly recognized, since tourism is not a clearly identifiable industry. In other words, tourism is such a multi-facial activity, involving many other economic sectors that it could be very difficult to attribute the growth of a country to tourism defined as a “specific” and “unique” industry.
3. Case-study
The purpose of this case-study consists in analyzing the relationship between growth and tourism in South-East Asian and Pacific countries. In recent years such countries have become a key tourism destination of the world: nowadays, tourism is one of the most important industries in such economies and, consequently, represents an important source of income. Therefore, this study aims to verify if tourism may actually contribute to
economic growth, and, therefore, if it can be considered a determinant of growth in such regions.
3.1 Tourism to South-East Asian and Pacific Countries: trends and characteristics
In the 1990s, South-East and Pacific countries faced a substantial increase of tourism flows from any part of world. In 2000, six East Asian and Pacific countries (China, Malaysia, Thailand, Indonesia, Philippines and Vietnam) and one South Asian country (India) were in the list of the top twenty developing countries in terms of international tourists arrivals. Table 3.1 below, reports the percentage increment in the number of arrivals for some South-East Asian and Pacific countries in the 1990s.
Table 3.1. Percentage increment in the number of international tourists arrivals for some South-East Asian countries.
Country Number of tourists arrivals
in 1990 (in millions)
Number of tourists arrivals in 2000 (in millions) % China 10.5 31.2 + 197.0 India 1.7 2.6 + 55.0 Malaysia 7.4 10.2 + 36.9 Thailand 5.3 9.6 + 81.1 Korea, Rep. 2.9 5.3 + 82.7
Source: own elaboration based on WDI – World Development Indicators, World Bank.
According to Singh (1997), several factors contributed to the rapid growth and development of tourism in South-East Asian and Pacific countries in the 1990s, mainly: liberalization of air transport and easing of travel restrictions, technological improvements, elimination of political barriers and new marketing-promotional strategies.
Asian national flag carriers were always protected from foreign competition. Obviously, this obstructed international arrivals and, therefore, was counterproductive to tourism industry. However, from the beginning of the 1990s, the gradual liberalization of Asian countries regarded also air transport, leading great benefits to incoming tourism flows. Such process of liberalization of air transport was carried out mainly through both multilateral open skies agreements with Occidental countries and liberalized internal aviation policies. In this sense, several
South-East Asian and Pacific countries (including Singapore and Taiwan) signed open skies agreements with the United States, while other countries (such as Indonesia, Philippines and South Korea) invited foreign airlines to fly to new international destinations. Moreover, new routes to secondary destinations were launched mainly in secondary cities of China, Indonesia, Thailand and Malaysia in order to serve new emerging tourism markets. Such increased liberalization of air transport led several positive effects to tourism sector mainly in terms of saved travel time and increased convenience for tourists. Moreover, some Asian resorts previously very inaccessible or unknown (for example, small Pacific islands and atolls) benefited from more tourism promotion.
Also technological improvements contributed to the rapid growth of tourism industry in South-east Asian and Pacific countries in recent years. New more efficient aircrafts, for example, led not only to improved travel facilities (increasing tourists comfort and safety, and ease and speed of arrival) but also to a decrease in operating costs for Asian Airline Companies. As a consequence, new low-cost companies were created, attracting more tourists. Additionally, the massive diffusion of computer-based technologies and, mainly, of internet, permitted the promotion of Asian resorts to a larger audience, providing instant and interactive access to Asian tourism products and services. Nowadays, tourists can view and choose their favorite Asian destination on internet and make direct purchases.
Elimination of political barriers led great benefits to tourism sector. Some Asian countries previously closed to overseas investors (mainly Philippines, Vietnam, Indonesia, and China) opened their borders. The breakdown of political barriers encouraged foreign investments also in hotel and tourism facilities, contributing to increase the demand of tourism in Asian regions.
In the end, many Asian countries adopted new marketing-promotional strategies, based on the supply of a diversified and differentiated tourism product. In terms of product diversification, tourism market was segmented, becoming more oriented to the tourists needs. In terms of differentiation, each country created “a diverse destination product with a
unique guest appeal” focusing on “the rich cultural, historical and natural heritage of the country” (Singh, 1997: 7). In this sense, Thailand
opened up northern areas with the aim of developing new rural destinations; India supplemented its traditional cultural tourism proposing holidays based on adventure and sports; Indonesia and Malaysia made
great efforts in developing ecotourism; China opened up western provinces in order to spread tourism out of the traditional Shanghai and Beijing regions; Vietnam implemented sustainable tourism plans. Such diversification and differentiation strategies of tourism product can determine great benefits in the long run. They can reduce the risk of over-dependence on a traditional tourism product and, therefore, the potential losses in tourists arrivals due to a diminishing appeal in a tourism product (De Villiers, 2001). In the end, in order to promote their image, particularly in terms of safety and political stability, many South-East Asian and Pacific countries have launched national themed campaigns (sometimes promoted jointly by neighbors Asian countries) mainly aimed to North America and Europe.
3.2 Description of model and variables used
Following Eugenio-Martin et al. (2004), the contribution of tourism to economic growth of South-East Asian and Pacific countries was analyzed exploiting a dynamic panel data model:
it i it it it cons y X u y = + + + + ∆ β −1 γ −1 α N i=1,... t=1,...T [3.1]
where:y is the log of per capita income (it ∆yit = yit −yit−1);β is a scalar,Xit−τ is a k x 1 vector of determinants of the steady state per capita income, γ is a 1 x k vector, αi are individual-country effects, u ~ it
( )
2 , 0σIID over i and t , N =126 and t=1990−2000. The vector Xit−1 includes the following set of variables
7 :
LGDI = natural logarithm of gross domestic investment, used to determine the role of investment in physical capital for economic growth. Its coefficient is expected positive. This variable was introduced in the model both with one and two lags, following the hypothesis of Eugenio-Martin et al. about possible delayed effects on the dependent variable due to slow transmission mechanism.
LSE = natural logarithm of secondary school gross enrollment ratio, included to take into account the contribution of human capital as
6
See Appendix A.1 for the complete list of countries analyzed. 7
determinant of growth (see also Barro, 1991; Levine and Zervos, 1993 and Brunetti, Kisunko and Weder, 1998). Since it should have a positive impact on the economic growth rate, its coefficient is expected to be > 0.
GC = government corruption, employed to control for political instability. Corruption, in fact, reduces the efficiency of government introducing instability into the political process and leading to possible fall of the government. Moreover, it determines a negative influence on property rights and, consequently, on investment and growth (see Mauro, 1995). Since this indicator ranks countries on a scale of 0 to 6, allocating 6 to the most corruption-free countries, its coefficient is expected positive.
TA = number of international tourists arrivals per capita, included in order to control if differences in the steady states across South-East Asian and Pacific countries analyzed can be explained in terms of tourism arrivals. Since, in developing countries, the total amount of tourism revenue earned results strictly related to the number of tourism arrivals (Roe et al., 2004), the basic idea is that higher levels of tourism inbound flows can contribute to economic growth. Therefore its coefficient is expected positive.
Model [3.1], adopted in many recent studies about growth (see, for example, Hauk and Wacziarg, 2004, OECD, 2003, Dewan and Hussein, 2001, Islam, 1995), appeared the most appropriate to test for growth for three orders of reasons:
1. it derives directly from the Solow’s (1956) neoclassical model, which seems the most suitable model for testing empirically growth (Hauk and Wacziarg, 2004);
2. it makes use of panel data, which have the advantage to better accommodate for heterogeneity across countries in testing for growth. Through heterogeneous intercepts, in fact, panel data allow to take into account level effects for individual countries. Several studies (Islam, 1995; Knight, Loayza and Villanueva, 1993) extended previous growth models designed for cross-section data to the analysis of panel data, showing that cross-section estimates were often biased;
3. thanks to the presence of the lagged dependent variable among the regressors, it permits to take into account the dynamic of adjustments of per capita income rate of growth as a consequence of several factors including tourism.
3.3 Econometric methodology
Equation [3.1] can be re-written in the following way:
it i it it it cons y X u y = +δ −1+γ −1+α + N i=1,... t=1,...T [3.2] where δ = 1
(
+β)
.Model [3.2] can be estimated following several approaches. Following the pooled OLS approach, intercepts and slope coefficients are treated as homogeneous across all N cross-sections and through all T time periods. However, slope estimates can be biased if the country-specific effect is correlated with the regressors, as in the model [3.2]. In such case, the adoption of a dynamic-fixed-effects approach seems to be more appropriate (for details see Hauk and Wacziarg, 2004). Nevertheless, because of the presence of the lagged dependent variable among the regressors, the traditional within estimator cannot be used since the within transformation leads to the correlation between the lagged dependent variable and the error term and, therefore, to biased and inconsistent estimates. Nickell (1981) calculated an asymptotic bias in the within estimator equal to -0.167 for T =10andβ =0.5. Such estimated bias is, therefore, approximately valid also for model [3.2], where T =11 and δ is expected ∈
] [
0,1 for convergence. A possible solution to such problem consists in instrumenting the variables correlated with the error term using the Bond (1991) GMM approach. The Arellano-Bond estimator generates consistent estimates but requires losing at least two periods of data to implement the IV procedure: this could affect the estimates in an unknown direction particularly when T is very small. Moreover, if the first stage relationship between differenced independent variables and lagged level variables is weak, then AB estimates are biased towards the correspondent within estimates (for more details see Stock, Wright and Yogo, 2002).3.4 Results and comments
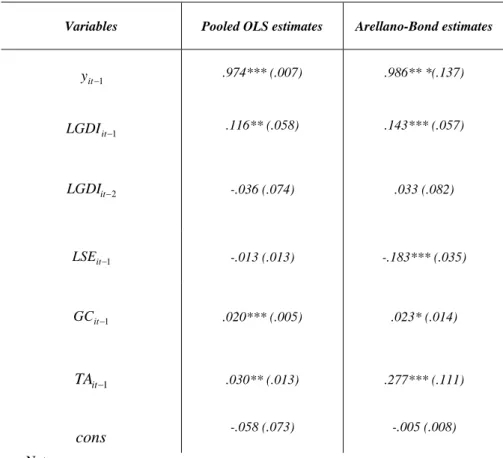
The calculation was implemented using STATA 8 econometric software Table 3.2 below reports the results obtained.
Table 3.2. Results obtained
(Dependent variable =yit)
Variables Pooled OLS estimates Arellano-Bond estimates
1 − it y .974*** (.007) .986** *(.137) 1 − it LGDI .116** (.058) .143*** (.057) 2 − it LGDI -.036 (.074) .033 (.082) 1 − it LSE -.013 (.013) -.183*** (.035) 1 − it GC .020*** (.005) .023* (.014) 1 − it TA .030** (.013) .277*** (.111) cons -.058 (.073) -.005 (.008) Notes:
1. In brackets: robust standard errors.
2. * denotes significance at the ten per cent level, ** at five per cent and *** at one per cent.
In Pooled OLS estimationR2 =.99. Moreover, variables result jointly significant at one per cent level.
In Arellano-Bond estimation, the Sargan’s test of over-identifying restrictions wasχ2 =6.58 with a p-value = 1.00: the null hypothesis implying good specification of model cannot be rejected. The
Arellano-Bond test that average autocovariance in residuals of order 2 is 0 was .34
− =
z with a p-value = 0.73: the null hypothesis implying no autocorrelation cannot be rejected. In the end, the Wald tests for jointly significance of all explanatory variables wasχ2=69.54with a p-value = 0.00: explanatory variables are, therefore, jointly significant at one per cent level. The conclusion is that model [3.2] is correctly specified and that instruments used are valid.
Despite the pooled OLS estimates can be biased given the correlation between yit−1 and the error term, the size of estimated coefficients is very similar adopting both the approaches: only the contribution to growth of tourist variable appears more decisive following the Arellano-Bond estimation respect to the Pooled OLS technique.
Moreover, all coefficients signs are as expected with the exception of LSE , but this result might not be surprising. In recent studies about the contribution of human capital to economic growth, in fact, educational variables often resulted not significant or, if significant, with the wrong sign, mainly when first-differenced or panel data models were used. In this sense, this case-study does not confirm the theoretical predictions about the positive contribution of human capital to growth but, at the same time, does not represent an isolated case. Pritchett (1999) underlined how if demand for educated labour is stagnant then marginal returns to education could fall rapidly. Since tourism sector does not ask necessarily for skilled workers, bur often represents a source of employment for weak labor-force (women, unskilled and semi-unskilled workers, poor rural people), Pritchell’s explanation could justify the absence of a positive impact of human capital on growth mainly in countries where tourism represents the main (or one of the most important) source of income (Maldives, Anguilla and, generally, small island states). However, such countries do not appear in the dataset utilized in this case study: therefore, reasons for the wrong sign on SE have to be found somewhere else, for example in the quality of data used. Such hypothesis is supported by de la Fuente and Doménech (2002) who provided evidence that improvements in data quality lead to larger and more precise estimates of schooling coefficients in growth regressions. This is confirmed by Hauk and Wacziarg (2004), who, using Monte Carlo simulations in order to evaluate the validity of econometric methods usually adopted to estimate growth regressions, showed how, in the presence of measurement error, the Arellano-Bond GMM estimator can
lead to underestimate the impact of some determinants of the steady-state level of income, such as human capital. A possible disturbing element in the data (typical in turning from the cross-section to panel data analysis) may be the existence of implausible changes in the evolution of educational variables over short periods. Such breaks could be a signal of a change of criterion in the elaboration of educational statistics that could affect the estimated coefficients. However, such inconsistencies do not seem to be present in data used in this case-study as graph 3.1 below confirms.
Graph 3.1. Evolution of secondary school gross enrollment ratio for all countries in the sample analyzed over the period 1990-2000
2 2.5 3 3.5 4 4.5 5 1990 1991 19921993 19941995 19961997 19981999 2000 Y ear Bangladesh China India Indonesia Korea, Rep. Malaysia Papua New Guinea Philippines Singapore Sri Lanka Tahiland
A more plausible reason about the wrong sign of LSE may be that data used do not fully reflect the level of human capital accumulated in a country. Since census attainment data were not available, only enrolment series were used in this case-study. But these two kinds of data might not be consistent, particularly at a secondary level of instruction and, mainly, in developing countries. In this sense, secondary school enrollment ratio could not be representative of the actual level of human capital accumulated in countries under analysis and this could justify the unexpected sign on LSE . Moreover, enrolment series take little account of formal education quality other than of other important dimensions of human capital, such as, for example, the job-training.
About the other coefficients, the positive signs on LGDI and GC suggest that government investment and political
corruption contribute to economic growth, respectively, in a positive and a negative way, while the positive (but less than one) sign on yit−1 guarantees β -convergence.
In the end, the Arellano-Bond estimation shows a large impact of tourism on GDP per capita, by around 0.3 percentage points. Moreover, the time period under analysis includes also the years of economic crisis in Asia, during which South-East and Pacific countries faced a decreasing number of tourists from other Asian countries. In this sense, the results obtained appear very encouraging: they suggest the importance of tourism sector, measured in terms of international arrivals, for the economic growth of countries analyzed and corroborate the general findings of Eugenio-Martin et al..
From a political point of view, these findings can determine two orders of consequences for domestic governments. First, local policy makers should invest more in tourism sector in order to attract new tourists, creating, for example, infrastructures and facilities (roads, railways, airports), implementing appropriate marketing strategies and designing tourism planners to canalize tourists towards destinations less known. Second, governments should develop strategies to maximize gains from tourism for local people, particularly for weak population (as women and rural communities), implementing, for example, programs to involve them in tourism activities and managing package tours directly at local level, in order to reduce many leakages. In this way, tourism sector can really become the main driving force of economic development in countries analyzed.
4. Conclusions
This paper has explored the relationship between tourism and economic growth. Tourism sector can represent a determinant factor for growth, mainly in developing countries which, recently, have faced an increase number of incoming tourism flows. This is, particularly, the case of South-East Asian and Pacific countries, many of which are in the list of top twenty major world tourists destinations in the 1990s. Several factors contributed to the rapid development of tourism in these regions, such as the liberalization of air transportation, technological improvements, elimination of political barriers and new marketing-promotional strategies. Since the increasing tourism flows can have
determined both positive economic consequences (income and employment opportunities, state revenues, diversification of economy, foreign exchange earnings) and negative economic consequences (mainly, import and export leakages) to receiving areas, this study has aimed to verify if positive effects prevailed over negative, in such a way as to contribute to economic growth. Following the recent literature about growth and, mainly, Eugenio-Martin et al. (2004), a dynamic panel data model was employed in order to test for convergence. Differences in preferences and technology among South-East Asian and Pacific countries were controlled for using indicators about human capital, physical investment and political situation in each country. Moreover, a tourism indicator, proxied by the number of international tourists arrivals per capita, was used in order to explore the impact of tourism sector in 11 Asian countries over the period 1990-2000. The tourism coefficient resulted significant and, moreover, its positive sign confirmed the importance of tourists arrivals on the economic growth. This can have important political consequences for developing countries: since tourism arrivals represent a determinant of economic growth, domestic governments, in fact, should invest more in tourism industry. An opportune strategy could consist in re-investing part of gains from tourism to attract new tourist, and the remaining part to help local communities to maximize the economic benefits from tourism. Since tourism asks for facilities, local governments should improve public infrastructures, as transportation (roads, rail networks and airports), communication (telephonic lines), water and energy supply and other public utilities. Moreover, tourism promotion and appropriate marketing strategies can play a crucial role to attract tourists towards new destinations. On the other hand, part of gains from tourism should be addressed to help local people to maximize the economic benefits from tourism, improving the living conditions of weak population. In this way, tourism sector can actually become an alternative driving force to reach economic development in many developing countries.
References
Arellano, M. and S. Bond, (1991), “Some Tests of Specification for Panel Data: Monte Carlo Evidence and an Application to Employment Equations”, Review of Economic Studies, Vol. 58, pp. 277-297.
Balaguer, J. and M. Cantavella-Jordá (2002) “Tourism as a long-run economic growth factor: the Spanish case” Volume 34, Number 7 / May 10, pages 877-884, Applied Economics, Taylor and Francis Journal
Barro, R., (1991), “Economic Growth in a Cross Section of Countries”, Quarterly Journal of Economics, Vol. 106, pp. 407-443.
Brau, R., A. Lanza, and F. Pigliaru (2003) “How Fast Are the Tourism Countries Growing? The Cross-country Evidence” FEEM Working Paper No. 85.
Brunetti, A., G. Kisunko and B. Weder. (1998). "Credibility of Rules and Economic Growth: Evidence from a Worldwide Survey of the Private Sector" The World Bank Economic Review, 12, 3, 353-84.
de la Fuente, A. and R. Doménech, (2002) "Human Capital in Growth Regressions: How Much Difference Does Data Quality Make? An Update and Further Results" CEPR Discussion Papers 3587
Dewan, E and S. Hussein (2001) “Determinants of economic growth” Working Paper 01/04 Economics Department Reserve Bank of Fiji, Suva.
de Villiers, David J. (2001) “Asia and the Pacific Trends – 2000” Paper presented at 34th Annual Meeting of the Board of Governors – Asian Development Bank – ADB Available at: http://www.adb.org/annualmeeting/2001/Seminars/devilliers_paper.pdf
Eugenio-Martín, J. L., N. Martín Morales and R. Scarpa, (2004) “Tourism and Economic Growth in Latin American Countries: A Panel Data Approach” FEEM Working Paper No. 26
Hauk, W. R. and R. Wacziarg (2004) “A Monte Carlo Study of Growth Regressions” NBER Technical Working Paper #T0296
Holloway, J. C. (1998) “The business of Tourism” Fifth Edition - Longman
Islam, N (1995) "Growth Empirics: A Panel Data Approach" Quarterly Journal of Economics, Vol. CX (No. 4, November) 1995, pp. 1127-1170
Jamieson, W. (2000) “The Challenges of Sustainable Community Cultural Heritage Tourism” Paper presented at UNESCO Conference/Workshop on Culture, Heritage Management and Tourism, Bhaktapur, April 2000.
Knight, M., N. Loayza and D. Villanueva, (1993) “Testing the Neoclassical Theory of Economic Growth: A Panel Data Approach” IMF Staff Papers 40, 512-541.
Lanza, A. and F. Pigliaru (1999) “Why are tourism countries small and fast-growing?” CRENOS and ENI, January, 29, in Social Science Research Network (SSRN)
Levine, R. and S. Zervos. (1993), “Looking at Facts: What we know about Policy and Growth from Cross-Country Analysis” World Bank Policy Research Papers, WPS 1115.
Lucas, R. (1988) “On the mechanism of economic development” Journal of Monetary Economics, 22, 3-42.
Mankiw, N.G., D. Romer, and D.N. Weil, (1992), “A Contribution to the Empirics of Economic Growth” Quarterly Journal of Economics, Vol. 107, pp. 407-437.
Mauro, P. (1995) “Corruption and Growth" Quarterly Journal of Economics, 110(3): 681-713, August.
Neto, F. (2003) “A new approach to sustainable tourism development: moving beyond environmental protection” United Nations, Department of Economic and Social Affairs - DESA discussion paper No. 29.
New Zealand Parliamentary Commissioner for the Environment (1997) “Management of the environmental effects associated with the tourism sector: review of literature on environmental effects”. Wellington, Report Nov. 1997
Available at: http://www.pce.govt.nz/reports/allreports/0_908804_74_1.shtml
Nickell, S.J., (1981) “Biases in Dynamic Models with Fixed Effects” Econometrica, 49, 1417-1426.
Organisation for Economic Co-operation and Development (OECD) (2003) “The Sources of Economic Growth in OECD Countries”, OECD General Economics & Future Studies, February 03, pp. 1-248 (249), Paris
Pleumarom, A. (1999) “Tourism, Globalization and Sustainable Development” in Third World Network Dossier for CSD 7, Third World Network, Malaysia.
Pritchett, L. (1999). "Where has all the education gone?" Mimeo, World Bank.
Roe, D., C. Ashley, S. Page and D. Meyer (2004) “Tourism and the Poor: Analysing and interpreting tourism statistics from a poverty perspective” PPT Working Paper No.16, ODI
Available at: http://www.odi.org.uk/pptourism/16_stats.pdf
Singh, A (1997) “Asia Pacific Tourism Industry: Current Trends and Future Outlook” Asia Pacific Journal of Tourism Research (APJTR). Available at:
http://www.hotel-online.com/Trends/AsiaPacificJournal/AsiaPacificTourismOutlook_1997.html
Solow, R., (1956) “A contribution to the Theory of Economic Growth” Quarterly Journal of Economics, Vol. 70 (1), 65-94
Stock, J. H., J. Wright and M. Yogo (2002) "A Survey of Weak Instruments and Weak Identification in GMM" Journal of Business and Economic Statistics, vol. 20, no. 4, pp. 518-529.
Taylor, T., M. Fredotovic, D. Povh and A. Markandya (2003) “Sustainable Tourism and Economic Instruments: the case of Hvar, Croatia” University of Bath, Working Paper No. 05-03.
Available at: http://www.bath.ac.uk/cpe/working.htm
Tohamy, S. and A. Swinscoe (2000) “The economic impact of Tourism in Egypt”, Egyptian Center for Economic Studies (ECES), Working Paper No. 40
Vaugeois, N. (2000) “Tourism in developing countries: refining a useful tool for economic development” 6th World Leisure Congress Proceedings, Bilbao, Spain. Woods, L. A., J. M. Perry and J. W. Steagall (1991). “Tourism and Economic
Development: The Case of Post-Independence Belize” Paper presented at the Fifth Annual Studies on Belize Conference, Belize City, Belize, C.A., September 3-6. World Bank web-site: http://www.worldbank.org/
APPENDIX A.1 – Countries analyzed
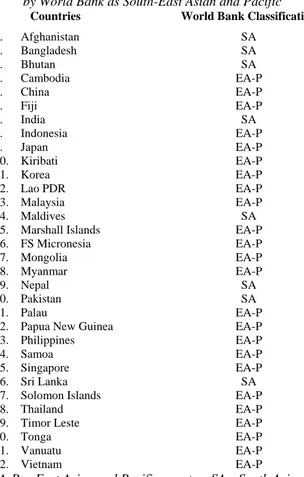
Initially, all 32 countries classified as South-East Asian and Pacific according to the World Bank were selected, as reported in table A.1 below.
Table A.1.1. List of countries classified by World Bank as South-East Asian and Pacific
Countries World Bank Classification
1. Afghanistan SA 2. Bangladesh SA 3. Bhutan SA 4. Cambodia EA-P 5. China EA-P 6. Fiji EA-P 7. India SA 8. Indonesia EA-P 9. Japan EA-P 10. Kiribati EA-P 11. Korea EA-P 12. Lao PDR EA-P 13. Malaysia EA-P 14. Maldives SA
15. Marshall Islands EA-P
16. FS Micronesia EA-P 17. Mongolia EA-P 18. Myanmar EA-P 19. Nepal SA 20. Pakistan SA 21. Palau EA-P
22. Papua New Guinea EA-P
23. Philippines EA-P 24. Samoa EA-P 25. Singapore EA-P
26. Sri Lanka SA
27. Solomon Islands EA-P
28. Thailand EA-P
29. Timor Leste EA-P
30. Tonga EA-P 31. Vanuatu EA-P 32. Vietnam EA-P
Note: EA-P = East Asian and Pacific country; SA =South Asian country
Availability of the variables chosen for each country and for the time period analyzed has represented the elimination criterion followed. Moreover, Japan was dropped since this study aims to analyze if tourism
represents a strategic sector for the growth in less developed countries The definitive list of countries analyzed is reported in table A.1.2
Table A.1.2. Definitive list of countries analyzed Countries 1. Bangladesh 2. China 3. India 4. Indonesia 5. Korea 6. Malaysia 7. Papua New Guinea 8. Philippines 9. Singapore 10. Sri Lanka 11. Thailand
APPENDIX A.2 - Variables used: definition and source
y = natural logarithm of GDP expressed in 1995 U.S. dollars itconstant prices divided by midyear population (source: WDI – World Development Indicators, World Bank). Therefore, ∆yit = yit −yit−1 represents a growth rate.
LGDI = natural logarithm of gross fixed capital formation expressedas percentage of GDP. It includes land improvements, plant, machinery, and equipment purchases. Moreover it comprises the construction of roads, railways, schools, offices, hospitals, commercial and industrial buildings (source: WDI – World Development Indicators, World Bank).
LSE = natural logarithm of ratio of total enrollment to the populationof the age group that officially corresponds to the level of secondary education, regardless of age (source: WDI – World Development Indicators, World Bank).
GC = indicator of corruption within the political system. It takes intoaccount financial corruption together with actual or potential corruption in terms of excessive patronage, nepotism and job reservations. This indicator ranks countries on a scale of 0 to 6
allocating 0 to the most corrupt countries (source: ICRG – International Countries Risk Guides, 1998). Since such data were only available until 1997, missing data for the period 1998-2000 were approximated using past ICRG data together with Country Indicators for Foreign Policy (CIFP) data, which rank countries on a scale of 1 to 9 allocating 9 to the most corrupt countries. Therefore, in order to make comparable ICRG and CIFP data, a scale of conversion was adopted attributing for the period 1998-2000 a decrease of 0.7 in the ICRG indicator respect to the previous year to any unit increase in CIFP indicator and vice versa.
TA = number of overnight visitors who travel to a country for aperiod not exceeding 12 months and whose main purpose in visiting is other than an activity remunerated from within the country visited. Moreover, it includes the number of tourists visiting a country in which they have their usual residence, but outside their usual environment. The total number of tourists was divided by total population which counts all residents with the exception of the refugees not permanently settled in the country of asylum, who are considered part of the population of their country of origin (source: WDI – World Development Indicators, World Bank).
1989, 3.3 Floro E. CAROLEO
Le cause economiche nei differenziali regionali del tasso di disoccupazione.
1989, 3.4 Luigi ACCARINO
Attualità delle illusioni finanziarie nella moderna società.
1989, 3.5 Sergio CESARATTO
La misurazione delle risorse e dei risultati delle attività innovative: una valu-tazione dei risultati dell'indagine CNR- ISTAT sull'innovazione tecnologica.
1990, 3.6 Luigi ESPOSITO - Pasquale PERSICO
Sviluppo tecnologico ed occupazionale: il caso Italia negli anni '80.
1990, 3.7 Guido CELLA
Matrici di contabilità sociale ed analisi ambientale.
1990, 3.8 Guido CELLA
Linkages e input-output: una nota su alcune recenti critiche.
1990, 3.9 Concetto Paolo VINCI
I modelli econometrici sul mercato del lavoro in Italia.
1990, 3.10 Concetto Paolo VINCI
Il dibattito sul tasso di partecipazione in Italia: una rivisitazione a 20 anni di distanza.
1990, 3.11 Giuseppina AUTIERO
Limiti della coerenza interna ai modelli con la R.E.H..
1990, 3.12 Gaetano Fausto ESPOSITO
Evoluzione nei distretti industriali e domanda di istituzione.
1990, 3.13 Guido CELLA
Measuring spatial linkages: input-output and shadow prices.
1990, 3.14 Emanuele SALSANO
1990, 3.18 Pasquale PERSICO
Il Mezzogiorno e le politiche di sviluppo industriale.
1990, 3.19 Pasquale PERSICO
Priorità delle politiche strutturali e strategie di intervento.
1990, 3.20 Adriana BARONE - Concetto Paolo VINCI
La produttività nella curva di Phillips.
1990, 3.21 Emiddio GALLO
Varianze ed invarianze socio-spaziali nella transizione demografica dell'Ita-lia post-industriale.
1991, 3.22 Alfonso GAMBARDELLA
I gruppi etnici in Nicaragua. Autonomia politica ed economica.
1991, 3.23 Maria SCATTAGLIA
La stima empirica dell'offerta di lavoro in Italia: una rassegna.
1991, 3.24 Giuseppe CELI
La teoria delle aree valutarie: una rassegna.
1991, 3.25 Paola ADINOLFI
Relazioni industriali e gestione delle risorse umane nelle imprese italiane.
1991, 3.26 Antonio e Bruno PELOSI
Sviluppo locale ed occupazione giovanile: nuovi bisogni formativi.
1991, 3.27 Giuseppe MARIGLIANO
La formazione del prezzo nel settore dell'intermediazione commerciale.
1991, 3.28 Maria PROTO
Risorse naturali, merci e ambiente: il caso dello zolfo.
1991, 3.29 Salvatore GIORDANO
1992, 3.33 Paolo COCCORESE
Un modello per l'analisi del sistema pensionistico.
1994, 3.34 Aurelio IORI
Il comparto dei succhi di agrumi: un caso di analisi interorganizzativa.
1994, 3.35 Nicola POSTIGLIONE
Analisi multicriterio e scelte pubbliche.
1994, 3.36 Adriana BARONE
Cooperazione nel dilemma del prigioniero ripetuto e disoccupazione invo-lontaria.
1994, 3.37 Adriana BARONE
Le istituzioni come regolarità di comportamento.
1994, 3.38 Maria Giuseppina LUCIA
Lo sfruttamento degli idrocarburi offshore tra sviluppo economico e tutela dell'ambiente.
1994, 3.39 Giuseppina AUTIERO
Un'analisi di alcuni dei limiti strutturali alle politiche di stabilizzazione nei LCDs.
1994, 3.40 Bruna BRUNO
Modelli di contrattazione salariale e ruolo del sindacato.
1994, 3.41 Giuseppe CELI
Cambi reali e commercio estero: una riflessione sulle recenti interpretazioni teoriche.
1995, 3.42 Alessandra AMENDOLA, M. Simona ANDREANO
The TAR models: an application on italian financial time series.
1995, 3.43 Leopoldo VARRIALE
L’uso del bootstrap nella verosimiglianza empirica.
1996, 3.48 Domenico RANESI
Le politiche CEE per lo sviluppo dei sistemi locali: esame delle diverse tipo-logie di intervento e tentativo di specificazione tassonomica.
1996, 3.49 Michele LA ROCCA
L’uso della verosimiglianza empirica per il confronto di due parametri di po-sizione.
1996, 3.50 Massimo SPAGNOLO
La domanda dei prodotti della pesca in Italia.
1996, 3.51 Cesare IMBRIANI, Filippo REGANATI
Macroeconomic stability and economic integration. The case of Italy.
1996, 3.52 Annarita GERMANI
Gli effetti della mobilizzazione della riserva obbligatoria. Analisi sull’efficienza del suo utilizzo.
1996, 3.53 Massimo SPAGNOLO
A model of fish price formation in the north sea and the Mediterranean.
1996, 3.54 Fernanda MAZZOTTA
RTFL: problemi e soluzioni per i dati Panel.
1996, 3.55 Angela SPAGNUOLO
Concentrazione industriale e dimensione del mercato: il ruolo della spesa per pubblicità e R&D.
1996, 3.56 Giuseppina AUTIERO
The economic case for social norms.
1996, 3.57 Francesco GIORDANO
Sulla convergenza degli stimatori Kernel.
1996, 3.58 Tullio JAPPELLI, Marco PAGANO
1997, 3.62 Cesare IMBRIANI, Antonio LOPES
Intermediazione finanziaria e sistema produttivo in un’area dualistica. Uno studio di caso.
1997, 3.63 Tullio JAPPELLI
Risparmio e liberalizzazione finanziaria nell’Unione europea.
1997, 3.64 Alessandra AMENDOLA
Analisi dei dati di sopravvivenza.
1997, 3.65 Francesco GIORDANO, Cira PERNA
Gli stimatori Kernel per la stima non parametrica della funzione di regres-sione.
1997, 3.66 Biagio DI SALVIA
Le relazioni marittimo-commerciali nell’imperiale regio litorale austriaco nella prima metà dell’800.
I. Una riclassificazione delle Tafeln zur Statistik der Öesterreichischen Monarchie.
1997, 3.67 Alessandra AMENDOLA
Modelli non lineari di seconda e terza generazione: aspetti teorici ed evi-denze empiriche.
1998, 3.68 Vania SENA
L’analisi econometrica dell’efficienza tecnica. Un’applicazione agli ospedali italiani di zona.
1998, 3.69 Domenico CERBONE
Investimenti irreversibili.
1998, 3.70 Antonio GAROFALO
La riduzione dell’orario di lavoro è una soluzione al problema disoccupazio-ne: un tentativo di analisi empirica.
1998, 3.71 Jacqueline MORGAN, Roberto RAUCCI
limiti e potenzialità.
1999, 3.76 Annamaria NESE
Il problema dell’inefficienza nel settore dei musei: tecniche di valutazione.
1999, 3.77 Gianluigi COPPOLA
Disoccupazione e mercato del lavoro: un’analisi su dati provinciali.
1999, 3.78 Alessandra AMENDOLA
Un modello soglia con eteroschedasticità condizionata per tassi di cambio.
1999, 3.79 Rosa FERRENTINO
Su un’applicazione della trasformata di Laplace al calcolo della funzione asintotica di non rovina.
1999, 3.80 Rosa FERRENTINO
Un’applicazione della trasformata di Laplace nel caso di una distribuzione di Erlang.
1999, 3.81 Angela SPAGNUOLO
Efficienza e struttura degli incentivi nell’azienda pubblica: il caso dell’industria sanitaria.
1999, 3.82 Antonio GAROFALO, Cesare IMBRIANI, Concetto Paolo VINCI
Youth unemployment: an insider-outsider dynamic approach.
1999, 3.83 Rosa FERRENTINO
Un modello per la determinazione del tasso di riequilibrio in un progetto di fusione tra banche.
1999, 3.84 DE STEFANIS, PORZIO
Assessing models in frontier analysis through dynamic graphics.
1999, 3.85 Annunziato GESUALDI
Inflazione e analisi delle politiche fiscali nell’U.E..
1999, 3.86 R. RAUCCI, L. TADDEO
2000, 3.91 Rosa FERRENTINO
Un’applicazione della mistura di esponenziali alla teoria del rischio.
2000, 3.92 Francesco GIORDANO, Michele LA ROCCA, Cira PERNA
Bootstrap variance estimates for neural networks regression models.
2000, 3.93 Alessandra AMENDOLA, Giuseppe STORTI
A non-linear time series approach to modelling asymmetry in stock market indexes.
2000, 3.94 Rosa FERRENTINO
Sopra un’osservazione di De Vylder.
2000, 3.95 Massimo SALZANO
Reti neurali ed efficacia dell’intervento pubblico: previsioni dell’inquinamento da traffico nell’area di Villa S. Giovanni.
2000, 3.96 Angela SPAGNUOLO
Concorrenza e deregolamentazione nel mercato del trasporto aereo in Italia.
2000, 3.97 Roberto RAUCCI, Luigi TADDEO
Teoremi ingannevoli.
2000, 3.98 Francesco GIORDANO
Una procedura per l’inizializzazione dei pesi delle reti neurali per l’analisi del trend.
2001, 3.99 Angela D’ELIA
Some methodological issues on multivariate modelling of rank data.
2001, 3.100 Roberto RAUCCI, Luigi TADDEO
Nuove classi di funzioni scalari quasiconcave generalizzate: caratterizzazio-ni ed applicaziocaratterizzazio-ni a problemi di ottimizzazione.
2001, 3.101 Adriana BARONE, Annamaria NESE
Some insights into night work in Italy.
2001, 3.106 Roberto RAUCCI
Stretta quasiconcavità nelle forme funzionali flessibili.
2001, 3.107 Roberto RAUCCI
Sugli insiemi limitati in ℜm rispetto ai coni. 2001, 3.108 Roberto RAUCCI
Monotonie, isotonie e indecomponibilità deboli per funzioni a valori vettoriali con applicazioni.
2001, 3.109 Roberto RAUCCI
Generalizzazioni del concetto di debole Kuhn-Tucker punto-sella.
2001, 3.110 Antonia Rosa GURRIERI, Marilene LORIZIO
Le determinanti dell'efficienza nel settore sanitario. Uno studio applicato.
2001, 3.111 Gianluigi COPPOLA
Studio di una provincia meridionale attraverso un'analisi dei sistemi locali del lavoro. Il caso di Salerno.
2001, 3.112 Francesco GIORDANO
Reti neurali per l’analisi del trend: un approccio per identificare la topologia della rete.
2001, 3.113 Marcella NIGLIO
Nonlinear time series models with switching structure: a comparison of their forecast performances.
2001, 3.114 Damiano FIORILLO
Capitale sociale e crescita economica. Review dei concetti e dell'evidenza empirica.
2001, 3.115 Roberto RAUCCI, Luigi TADDEO
Generalizzazione del concetto di continuità e di derivabilità.
2001, 3.116 Marcella NIGLIO
2002, 3.121 Michele LA ROCCA, Cira PERNA
Neural networks with dependent data.
2002, 3.122 Pietro SENESI
Economic dynamics: theory and policy. A stability analysis approach.
2002, 3.123 Gianluigi COPPOLA
Stima di un indicatore di pressione ambientale: un'applicazione ai comuni della Campania.
2002, 3.124 Roberto RAUCCI
Sull’esistenza di autovalori e autovettori positivi anche nel caso non lineare.
2002, 3.125 Maria Carmela MICCOLI
Identikit di giovani lucani.
2002, 3.126 Sergio DESTEFANIS, Giuseppe STORTI
Convexity, productivity change and the economic performance of countries.
2002, 3.127 Giovanni C. PORZIO, Maria Prosperina VITALE
Esplorare la non linearità nei modelli Path.
2002, 3.128 Rosa FERRENTINO
Sulla funzione di Seal.
2003, 3.129 Michele LA ROCCA, Cira PERNA
Identificazione del livello intermedio nelle reti neurali di tipo feedforward.
2003, 3.130 Alessandra AMENDOLA, Marcella NIGLIO, Cosimo VITALE
The exact multi-step ahead predictor of SETARMA models.
2003, 3.131 Mariangela BONASIA
La dimensione ottimale di un sistema pensionistico: means tested vs pro-gramma universale.
2003, 3.132 Annamaria NESE
2003, 3.136 Giuseppina AUTIERO
Labour market institutional sistems and unemplyment performance in some Oecd countries.
2003, 3.137 Marisa FAGGINI
Recurrence analysis for detecting non-stationarity and chaos in economic times series.
2003, 3.138 Marisa FAGGINI, Massimo SALZANO
The reverse engineering of economic systems. Tools and methodology.
2003, 3.139 Rosa FERRENTINO
In corso di pubblicazione.
2003, 3.140 Rosa FERRENTINO, Roberto RAUCCI
Sui problemi di ottimizzazione in giochi di Stackelberg ed applicazioni in modelli economici.
2003, 3.141 Carmine SICA
In corso di pubblicazione.
2004, 3.142 Sergio DESTEFANIS, Antonella TADDEO, Maurizio TORNATORE
The stock of human capital in the Italian regions.
2004, 3.143 Elena Laureana DEL MERCATO
Edgeworth equilibria with private provision of public good.
2004, 3.144 Elena Laureana DEL MERCATO
Externalities on consumption sets in general equilibrium.
2004, 3.145 Rosa FERRENTINO, Roberto RAUCCI
Su alcuni criteri delle serie a termini non negativi.
2004, 3.146 Rosa FERRENTINO, Roberto RAUCCI
Legame tra le soluzioni di Minty e di Stempacenhia nelle disequazioni varia-zionali.
La dinamica del cambiamento nella rappresentazione del territorio. Una mappa per i luoghi della Valle dell’Irno.
2004, 3.151 Celi
Empirical Explanation of vertical and horizontal intra-industry trade in the UK: a comment.
2004, 3.152 Amendola – P. Vitale
Self-Assessment and Career Choices: An On-line resource for the Univer-sity of Salerno.
2004, 3.153 A. Amendola – R. Troisi
Introduzione all’economia politica dell’organizzazione: nozioni ed applicazio-ni.
2004, 3.154 A. Amendola – R. Troisi
Strumenti d’incentivo e modelli di gestione del personale volontario nelle organizzazioni non profit.
2004, 3.155 Lavinia Parisi
La gestione del personale nelle imprese manifatturiere della provincia di Salerno.
2004, 3.156 Angela Spagnuolo – Silvia Keller
La rete di accesso all’ultimo miglio: una valutazione sulle tecnologie alterna-tive.
2005, 3.157 Davide Cantarelli
Elasticities of Complementarity and Substitution in Some Functional Forms. A Comparative Review.
2005, 3.158 Pietro Coretto – Giuseppe Storti
Subjective Sxpectations in Economics: a Statistical overview of the main findings.
2005, 3.159 Pietro Coretto – Giuseppe Storti
Il capitale sociale conta per outcomes (macro) economici?.
2005, 3.164 Damiano Fiorillo – Guadalupi Luigi
Attività economiche nel distretto industriale di Nocera inferiore – Gragnano. Un’analisi su Dati Tagliacarne.
2005, 3.165 Rosa Ferrentino
Pointwise well-posedness in vector optimization and variational inequalities.
2005, 3.166 Roberto Iorio
La ricerca universitaria verso il mercato per il trasferimento tecnologico e ri-schi per l’”Open Science”: posizioni teoriche e filoni di indagine empirica.
2005, 3.167 Marisa Faggini
The chaotic system and new perspectives for economics methodology. A note.
2005, 3.168 Francesco Giordano
Weak consistent moving block bootstrap estimator of sampling distribution of CLS estimators in a class of bilinear models
Stampa a cura della C.U.S.L. Cooperativa Universitaria Studio e Lavoro, Via Ponte Don Melillo, Fisciano per conto Del Diparti-mento di Scienze Economiche e Statistiche