TIMING AND HOLIDAYS DURATION FOR PEOPLE RESIDING IN THE PROVINCE OF BOLOGNA
A. Cazzola, R. Impicciatore
1. INTRODUCTION
Until XVIII century the length of a journey was often unknown at the time of departure. Sailors, merchants, settlers, and adventurers left their home without any certainties about if and when they would come back (Stroppa, 2002). Suffice to recall Marco Polo’s travels as described in the book “Il Milione,” or sea voy-ages to the New World in the 16th and 17th centuries. In more recent times, the development of transportation and communication systems has made it possible to plan a trip’s timing and itinerary, with the result that the modern journey is precisely organized and adapted to fit job and family commitments. Today’s trav-elers leave nothing up to chance, choosing their departure period according to job constraints and setting the arrival date well before the beginning of a trip. This ability to manage timing and itinerary has simplified travel also for those seeking pleasure and cultural enrichment. The trip, in this sense, has become a consumer good unrelated to productive activity. A “tourist” is an individual who views travel as an interruption of daily life that is solely for personal enjoyment and has no obligations attached (Perussia and Viano, 2002). Various factors such as increasing economic well-being, transport and communication improvements, together with the diffusion of trade union rights and paid vacation, are principally responsible for transforming tourism into a mass phenomenon with regards to both supply and demand.
During the current post-industrial period, tourist services have increased sub-stantially in Italy as well as in most developed countries, albeit in a non-linear fashion and with occasional cyclical interruptions. Time devoted to pleasure, rest, or relaxation is increasing and is less and less connected to work-related activities. This trend, driven by greater accessibility to tourist products and services, high-lights tourism as one of today’s most important economic and social phenomena. The main purpose of this paper is to analyze the effect of sociodemographic variables (gender, age, marital status, working conditions, and area of residence) on the propensity to travel and on the holiday length. If the socio-demographic traits identifying the individual length of stay were known, then one could better allocate resources used in managing such an event (Pestana Barros and Correia, 2007).
Al-though the literature on this topics in the last years in Europe has grown rapidly, in Italy there has been little research on the determinants of holiday’s length of stay. This paper contributes to the theme’s literature in several ways. We used question-naire data collected at the end of 2004 among people residing in the Province of Bologna both travellers and non-travellers. This strategy offers two advantages: re-sults are not linked to a specific touristic destination and it is possible to focus not only on holidaymakers but also on non-travellers. This is a main point in our analy-sis: when studying holiday characteristics, we automatically select the sub-sample of holidaymakers, a group that is not randomly extracted from the sample. Conse-quently, estimates may be biased if they do not take selectivity into account. In or-der to do so, we decompose the process of turist choice into two steps: taking a holiday and length of stay and we apply Heckman multivariate model (Heckman, 1979) that permits to account for the selection bias embedded in the phenomenon under study. A similar approach is used in Nicolau and Màs (2005) where Heckman model is used in order to consider tourist’s expenditure as a decision that is not in-dependent from the decision to go on holiday.
2. LITERATURE REVIEW AND HYPOTHESIS 2.1 Going on holiday
In the international literature it is commonly accepted that the demand for tourism is affected by demographic and socioeconomic relationships such as age, marital status, gender, occupation, and educational background (Lawson 1994; Mieczkowski 1990).
Age may be a strong deterrent to travel. Caldow (1997) noted that some of those over 55 years of age perceived the physical barriers and mental stresses as-sociated with travel to outweigh potential benefits. Similar results are reported by other authors (Haukeland 1990; Lang Research, 2000). From this perspective the market potential of the older traveller may have to be re-evaluated (Smith and Carmichael, 2005) since the age structure of the population and its changes are of vital interest to tourism and recreation planners (Mieczkowski, 1990). Neverthe-less, other authors suggested that the effect of age may be non-linear (Walsh et al., 1992) tracing a bimodal relationship with a greater propensity to travel among both younger and older people (Collins and Tisdell, 2002; Lawson, 1991; Opper-mann 1995) or it might even disappear when other characteristics are taken into account (Nicolau and Màs, 2005; Collins & Tisdell, 2002).
A second social factor that affects individual’s travel choices is the marital status. Kotler (1994) argued that married couples with young families or those widowed and/or retired are the most constrained whereas travellers free from household responsibilities tend to show a higher propensity to travel. This aspect is strictly linked with the age effect: an individual with a family with young chil-dren or involved in buying houses may be limited in travel choices (Haukeland (1990). Moreover, larger household size reduces the propensity to go on holiday (Nicolau and Mas, 2005; Walsh 1992).
The connection between social class and the probability to take a holiday trip is not clear. Some authors argue that the relation has been somewhat diminished but not disappeared (Toivonen, 2004). Nevertheless there is strong evidence that those who are highly educated tend to travel more frequently (Nicolas and Màs, 2005; Lang Research, 2001; Toivonen, 2004; Smith, 1995; Parker, 1976). Generally speak-ing, education may increase the interest in tourism by giving an easier access to in-formation and providing preparation for some type of recreational activities. Fi-nally, gender seems to be not important (Toivonen, 2004).
2.2 Length of stay
Although travel duration is of major interest in tourism management, there are few studies addressing the length of stay. Up to recent years, papers on this topic were mainly descriptive and they stressed the importance of nationality, age, la-bour status (Oppermann, 1995, 1997; Seaton & Palmer, 1997; Sung et al, 2001) and the role of family life cycle (Oppermann, 1995; Collins and Tisdell, 2002). In the last years more sophisticated statistical methods have been applied in order to ascertain the covariates which explain the decision related to the length of vaca-tions. The study made by Gokovali, Bahar, and Kozak (2007) is, according to the authors, the fist study to be published in academic reviews using duration models to explain tourists’ length of stay. This paper, that investigates on tourist’s behav-iours in Bodrum, Turkey, posits a positive effect of level of income and a nega-tive effect of level of education whereas age, occupation and marital status do not have any effect. Alegre and Pou (2007) applied a discrete choice logit model in order to analyze the length of stay of English and German tourists on the Bale-aric Islands. Among other results, they found a positive effect of age but with a lack of significance when labour status is included in the model. This latter vari-able show that students and pensioners are the groups who were more likely to have longer stays whereas the lower probability is shown by the most highly qualified professional category. Fleischer and Pizam (2002), which employed a Tobit model applied to a cross-section sample of Israeli senior citizens, and Nico-lau and Mas (2005), which used a Random Parameter Logit Model applied to Spanish tourists, show the positive effect of income and age. Pestana Barros & Correia (2007) used different kind of hazard models (Cox, logistic and Weibull) on data related to Portuguese holidaymakers in Latin America for their summer destination. They found that the length of stay is positively related to age and tourist’s social status whereas marital status is not significant.
Martinez-Garcia & Raya 2008 through an accelerated failure time model in the log-logistic functional form, analyzed to what extent the personal characteristics of the low-cost tourist are significant in determining the duration of a trip. They found an increased length of stay among tourists over the age of 50 (since they usually have more time available and a higher income level) and more educated people (even if no significant differences are detected between secondary and university education). Age and gender appear to have no significant effect whereas being self-employed or a mid or low-level employee shows a negative effect.
2.3 Hypotheses
According to the literature, we can formulate the following hypotheses: 1) age has a non-linear positive effect on both the probability of going on holiday and holiday’s length; 2) the effect of marital status disappears when we take into ac-count other factors such as age and education; 3) gender is not important; 4) to be a student or a pensioner is a condition associated with higher propensity to have longer holidays.
In order to test hypothesis 4 we also take into account the availability of time among workers, i.e. the amount of days of vacation from work. As an additional factor, we include area of residence under the hypothesis that urban people show higher propensity to go on holiday (Nicolau and Màs, 2005; Eymann and Ron-ning, 1992).
2. THE SAMPLE FRAMEWORK
In this work, the target population is composed by individuals residing in the Province of Bologna (capital of the Emilia-Romagna region) aged 18-79 at the time of the interview. Sampling occurred in two stages: in the first, families were extracted from the most updated telephone directory (Telecom Italia); in the second stage, one individual from each family was selected and interviewed by telephone.
Figure 1 – Italy, Emilia-Romagna and the Province of Bologna (divided into 5 areas according to geographical and touristic characteristics).
Emilia-Romagna
The sample was selected by stratified sampling, according to geographical/ touristic areas (Province has been divided into 5 areas according to specific traits that emerged in previous analyses: 1. City of Bologna; 2. Greater Bologna urban area; 3. Plains; 4. Mountains; 5. Greater Imola urban area; see Figure 1), as well as by quota sampling, taking population demographics into account (sex and age). The survey was conducted at the end of September 2004 and the final sample contains outcomes for 1,299 individuals1.
The questionnaire was developed to highlight the heterogeneity in tourism demand. One of the most important advantages of a survey conducted on resi-dent population is the possibility of gathering information on “non-tourist” groups, which cannot be observed in surveys conducted in tourist attractions. Questions refer to touristic activities during 2003 and 2004. We completed calen-dar year 2004 by including future holiday plans for the remainder of the year. The short period of time allows us to consider scheduled holidays as though already taken. Supporting this choice are the strong similarities between (complete) in-formation given for the end of 2003 and (planned) behaviours for the same pe-riod 2004.
Following the EUROSTAT approach, we define holiday as a period spent in a location other than one’s usual residence for purposes of relaxation, pleasure, or entertainment, visiting relatives or friends, religious practices or pilgrimage, or for thermal baths or health treatments. The holiday period can be distinguished in short holiday (no more than 3 nights) and long holiday (4 or more nights). A period longer than one year is not considered a holiday as in this case it is unclear which is the “usual” residence. We define “tourist” as an individual who took at least one holiday (short or long) in the period considered in the analysis.
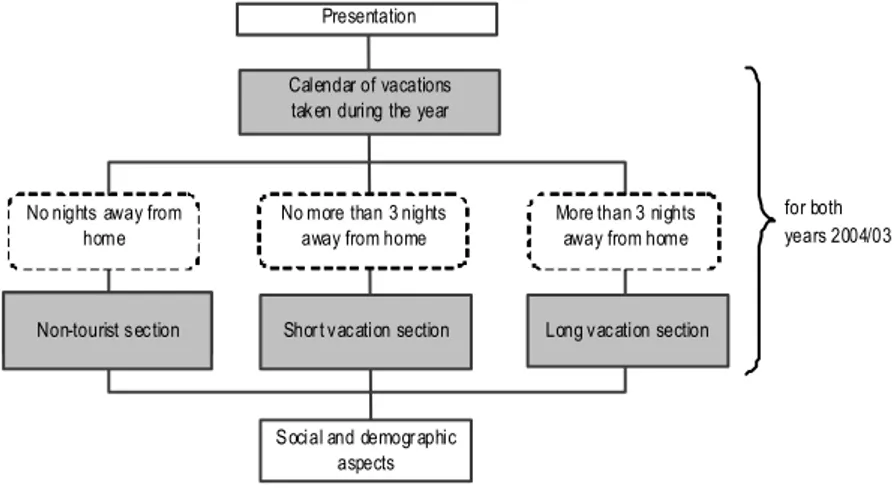
Presentation
Calendar of vacations taken during the year
No nights away from home
No more than 3 nights away from home
More than 3 nights away from home
No tourist section
Non-tourist section Short vacation section Long vacation section
Social and demographic aspects Presentation
for both years 2004/03
Figure 2 – Questionnaire structure.
The questionnaire’s structure is shown in Figure 2. Firstly, respondents are asked what types of holidays they took in the year of reference and the number of paid vacation days. Subsequently, three sections (non-tourist, short holidays, long holidays) had to be compiled according to the answers provided in the first part. The first two sections, which are devoted to those who did not take long holi-days, contain questions indicating why the individual did not go on holiday. The third part contains detailed information concerning long holidays and, in particu-lar, the longest trip taken in the specified year. The procedure is repeated twice (for 2003 and 2004). The last section, containing socio-demographic characteris-tics, is addressed to the whole sample.
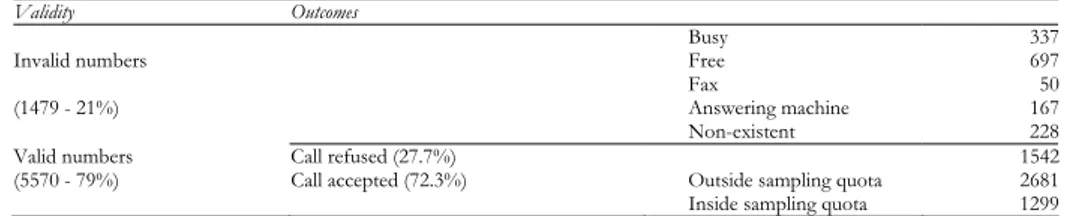
Each interview had a mean duration of 9 minutes and no particular problems were reported. The proportion of non-responses was about 28% (table 1). Some difficulties arose with regards to specific items, such as paid vacation days. This concept varies among different types of jobs and is ambiguous for the self-employed, atypical jobs, illegal work, and motherhood. Nevertheless, the question with the highest rate of missing answers concerned expenses (18.8% for holidays in 2004 and 24.7% for 2003). In the analysis of missing values concerning this i-tem, we found significant differences (p < 0,01) between the two sub-samples of respondents and not-respondents according to the following characteristics: holi-day length, destination (Italy or abroad), accommodation, fellow traveler, travel agency, and occupational status.
TABLE 1 Phone calls and outcomes
Validity Outcomes
Busy 337
Invalid numbers Free 697
Fax 50
(1479 - 21%) Answering machine 167
Non-existent 228
Valid numbers Call refused (27.7%) 1542
(5570 - 79%) Call accepted (72.3%) Outside sampling quota 2681 Inside sampling quota 1299
Respondents found some difficulties in the specification of expenses when holidays were characterized by specific traits (i.e. when he/she was a guest, or on a working or educational holiday, etc.). The scheme of missing values seems to be missing at random (MAR) as a function of holiday characteristics and its collocation in the time axis. This hypothesis has been applied in the computation of the miss-ing value of expenses usmiss-ing a regression model based on known variables related to trip characteristics and sociodemographic traits.
Further controls on the other possible systematic errors gave indications that the sample is consistent with the reference population. In general, the most im-portant limit of the sample is given by omitted variables, i.e. other personal and contextual traits that may influence touristic behaviours but that we cannot gather with a phone interview.
3. SOCIODEMOGRAPHIC FACTORS: A FIRST GLANCE
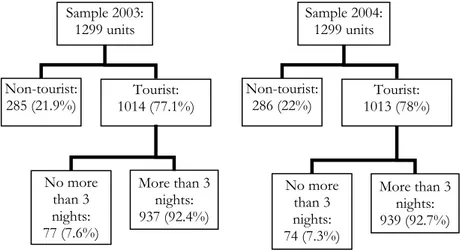
Today, in the more developed countries, holidays are considered a worker’s en-titlement. The tradition of suspending work activity for a suitable rest has become one of the ceremonies that characterize family and social life. However, going on vacation is not only a pleasure but also takes its toll of personal energy and eco-nomic resources. Neither of which residents in the province of Bologna seem to lack, as about three-quarters of them usually go on holiday. During the years 2003 and 2004, 22% of respondents did not go on holiday, 6% opted only for short holidays, and 72% took at least one long holiday (see more detailed percentages in figure 3).
Figure 3 – General sample results.
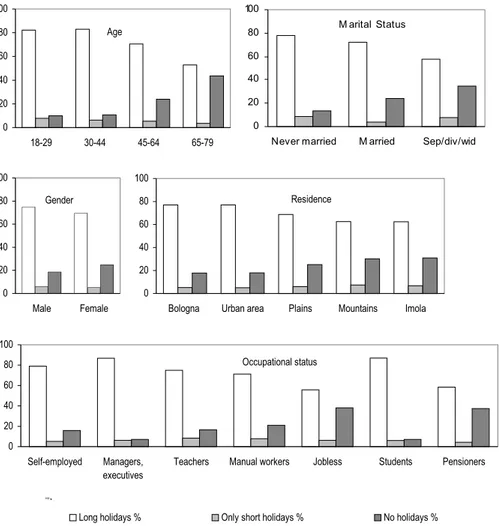
Generally speaking, holidaymakers residing in the Province of Bologna are usually never-married, aged 44 or less, either professionals with a prestigious job or students, and living in the city of Bologna (see Fig. 4 for year 2004). Among workers, as may be expected, more paid vacation days means more holidays: if one or two weeks correspond, on average, to a little over one holiday, 30 or more paid vacation days entail nearly two long holidays.
The relations between the propensity to go on holiday and the availability of paid vacation days are highlighted in Figure 5, where the y-axis shows the propor-tion of individuals who took at least one holiday (short or long) in relapropor-tion to va-cation days from work. In the period 2003-2004, about 80% of workers with mo-re than one week of vacation took at least one long holiday, with an incmo-reasing percentage for those with more days. This percentage is reduced substantially among those with no more than one week of paid holidays2. Short holidays, as
2 There is a small group of workers who declared having no paid vacation but who took at least
one long holiday (mainly the self-employed, entrepreneurs, and manual workers). Sample 2004: 1299 units Non-tourist: 286 (22%) 1013 (78%) Tourist: No more than 3 nights: 74 (7.3%) More than 3 nights: 939 (92.7%) Sample 2003: 1299 units Non-tourist: 285 (21.9%) 1014 (77.1%) Tourist: No more than 3 nights: 77 (7.6%) More than 3 nights: 937 (92.4%)
0 20 40 60 80 100 18-29 30-44 45-64 65-79 Age 0 20 40 60 80 100
Never married M arried Sep/div/wid M arital Status 0 20 40 60 80 100 Male Female Gender 0 20 40 60 80 100
Bologna Urban area Plains Mountains Imola Residence 0 20 40 60 80 100 Self-employed Managers, executives
Teachers Manual workers Jobless Students Pensioners Occupational status 0 100 18-29 30-44 45-64 65-79
Long holidays % Only short holidays % No holidays %
Figure 4 – Holiday frequencies and sociodemographic conditions during 2004.
0 20 40 60 80 100 0 1–7 8–15 16–21 22–30 31+ %
More than 3 nights 2004
2003
No more than 3 nights
Paid vacation days
0 20 40 60 80 100
students jobless pensioners housew ives %
More than 3 nights 2004
2003
No more than 3 nights
Figure 5 – Workers who took at least one long
unique touristic choice, are not widespread and they seem to be a makeshift solu-tion only for respondents with few paid vacasolu-tion days. Among non-workers (pen-sioners, jobless, students, and housewives; see Figure 6), the proportion of re-spondents who took long holidays remains quite high, particularly among stu-dents (90% compared to the approximately 60% for other sub-groups). Short trips, without any long holidays, are infrequent.
We can draw a picture of the sample that consider all the sociodemographic features (gender, age, marital status, occupational status, and area of residence) together with the length of paid vacation, by applying an exploratory method able to define exhaustive and mutually exclusive sample subgroups through binary di-visions and aggregations. This is accomplished using the predictive capacity of each independent variable (sociodemographic factors) relative to the unique de-pendent variable (dummy variable: “at least one long holiday in the 2004, Yes or No”). In other words, the method is a multiple classification with a progressive selection of independent variables3. Figure 7 shows the most general and concise segmentation of the whole sample, progressively disaggregated according to the most relevant explanatory variables. The first and most significant division is due to the variable given by a combination of paid vacations and worker status. The three resulting groups are:
1 - workers with 0-7 paid vacation days in 2004
2 - workers with more than 7 paid vacation days in 2004 3 - non-workers and unemployed
Among the first group, 42% of individuals took at least one long holiday. The other two groups show higher percentages (85% for group 2 and 63% for group 3). Therefore, the differences in the amount of paid vacation appear to be more important than the condition “to be a worker or non-worker”. Within group 2, area of residence determines a second level of differentiation. In particular, the highest quote of holidaymakers (90%) is found among residents of the city of Bo-logna and the surrounding greater urban area, whereas in the rest of the Province only 78% of the sample took a long holiday trip during 2004. It is worth empha-sizing that the most favorable combination in terms of holidaymaking propensity is to live in an urban context and “to be a worker with a sufficient amount of paid vacation,” while the worst is generally “to be a worker without a sufficient a-mount of paid vacation.” Among group 3, age is the most important factor of segmentation: the highest percentage of holidaymakers are aged 18-29 (87%) with decreasing values for older groups (64% and 54% for ages 30-64 and 65-79).
As far the number of holiday episodes is concerned, nearly half took two or more vacations (see table 2). Comparing the two years considered, we see an in-crease in the mean number of long holidays (1.6 in 2003 and 1.8 in 2004) and a decrease in the average length of each single trip (13.4 and 12.4 days respectively).
3 The independence between the dependent variable and each independent variable is tested
However, if we consider the most substantial holiday taken in each year, the me-an length remains stable (16.7 days in 2003 me-and 16.8 in 2004) whereas the medime-an duration is constant and equal to 14 days4. These results suggest that a two-week trip is the typical choice. Taking a longer holiday is often discouraged by job con-straints and, presumably, by decreasing marginal pleasure under the pressure of daily commitments.
Figure 7 – Classification Tree of individuals that took at least one long holiday in 2004.
TABLE 2
Number of long holidays taken by respondents (percentage among individuals that declared at least one long holiday)
2003 2004 1 57.95 50.91 2 27.32 28.97 3 9.39 12.35 4 or more 5.33 7.77 Total 100 100
For the entire period from 2003-2004, the median number of days spent on holiday5 is 30 and the median number of long holidays is 2 (see table 3). Younger age classes tend to go on holiday more frequently but for shorter periods in
4 A similar trend has been observed at national level: the total number of holiday during 2004
was higher than the previous year whereas the total number of nights spent outside home reduces by 0.6% for long holiday and increases for short holidays (+6.7%) (Istat, 2006).
5 We consider the total amount of days spent on long holidays, i.e. we do not take into account
short trips (less then 4 overnight stays). Long holiday 72.3% n=1299 Vacations > 7 d. 85.3% n=626 Bologna-urban 90.4% n=375 -1- Residence Other towns 77.7% n=251 -2- 41.9% n=93 -3-Work and vacations
63.1% n=580 18-29 87.0% n=92 30-64 63.7% n=245 Age 65-79 53.5% n=243 Non-workers Vacations 0-7 d.
parison with older classes, which have more days at their disposal6. Never-married persons take more holidays but with a shorter duration whereas residents of Bologna city and its greater urban area take more holidays both in terms of length and number of trips. With regards to occupational status, manual workers, jobless, and pensioners tend to concentrate their holidays in a lower number of separate trips. Moreover, manual workers take fewer holidays.
TABLE 3
Mean and median durations for the longest holiday and number of (long) holidays during 2003-2004. Sub-sample of holidaymakers (individuals that took at least one long holiday)
Duration Number of trips
Mean Median Mean Median Age 18-29 36.55 30 3.24 3 30-44 35.85 30 3.17 3 45-64 38.92 32 3.06 2 65-79 45.18 30 2.50 2 Gender Men 37.64 30 3.08 2 Women 39.28 32 3.00 2 Marital status Never married 35.72 29 3.22 3 Married 39.67 32 2.99 2 Sep./div./wid. 39.40 30 2.78 2 Area of residence Bologna 45.70 38 3.35 3
Greater urban area 38.50 34 3.13 2
Plains 29.17 23.5 2.61 2
Mountains 31.18 25 2.67 2
Imola 31.05 29 2.66 2
Occupational status
Self-employed, entrepreneurs 39.34 36 3.19 3
Managers, executives, employees 35.02 31 3.25 3
Teachers 42.15 34.5 3.40 3 Manual workers 27.27 25 2.54 2 Jobless 42.14 30 2.78 2 Students 37.77 31.5 3.43 3 Pensioners 45.97 30 2.82 2 Total 38.47 30 3.04 2
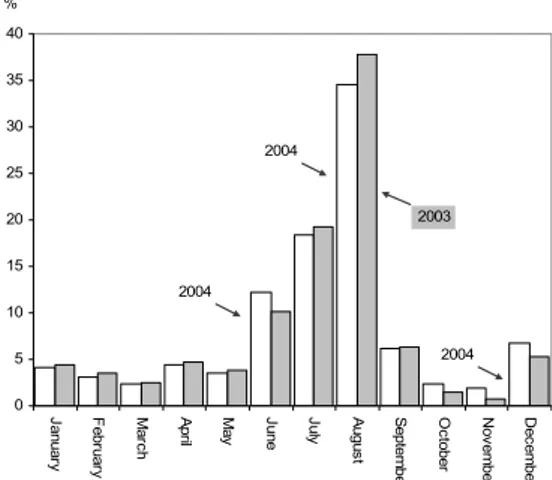
Long holidays are strongly concentrated during summer with a peak in August and a second relative peak in the Christmas season (Figure 8). However, differ-ences between 2003 and 2004, while not striking, suggest that some changes are underway. In particular, the percentage of trips with a departure date in August decrease from 38% in 2003 to 35% in 2004. As other surveys have revealed (ISTAT, 2006; Trademark and Sociometrica, 2007), the trend toward a progres-sively lower concentration of holidays during the summer months seems to be confirmed in our dataset.
6 The dispersion in the distribution of days is very high among older individuals. This is
high-lighted by the higher discrepancy between mean and median values, a sign of the presence of out-liers.
0 5 10 15 20 25 30 35 40 Ja nu ar y F ebr ua ry Ma rc h Ap ril Ma y Ju ne Ju ly Au gu st S ept em ber Oc to be r Nov em be r Dec em be r % 2004 2003 2004 2004
Figure 8 – Monthly distribution of all long holidays (considered at their start).
4. TIMING AND HOLIDAY DURATION: A MULTIVARIATE ANALYSIS TAKING INTO AC-COUNT SELECTIVITY
In order to control for the mutual influence amongst socio-demographic fac-tors (i.e. the effect of marital status may be overestimated by the underlying and more significant age effect) we have developed some multivariate regression mo-dels in relation to the decision to take a long holiday, the holiday length and the calendar time of departure.
The first step is the evaluation of the effect of socio-demographic factors on the propensity to take long holiday trips. We do so by developing a multivariate logistic model where the dependent variable is the probability to have taken at least one long holiday in the 2003-2004 period and independent variables are age, gender, occupational status, marital status and area of residence. Moreover, a sec-ond model has been estimated by selecting the sub-sample of workers and add-ing, as an additional covariate, the total number of vacation days in the two years 2003 and 2004. Results are shown as odds ratios: a value higher (lower) than 1 means a higher (lower) probability to have taken a long holiday in comparison with the reference category highlighted in italics (table 4).
The estimates (model A) confirm that young adults (30-44 years old) living in Bologna (city and urban band) have a higher propensity to go on holiday. Gender is not relevant whereas divorced, separated, and widowed individuals are less prone to taking a long holiday compared to married people (significance is about 95%). As far as occupational status is concerned, the reference category (manag-ers, executives, professionals and employees) shows a holidaymaking odds ratio that is three-time higher than that of self-employed, teachers, and manual workers and five-times higher than that of pensioners and jobless individuals. Lastly, stu-dents do not appear significantly different from the reference category. According to these results, we can conclude that job type represents a discriminating factor that is more important than the condition “worker or non-worker.”
TABLE 4
Logistic models: propensity to having taken at least one long holiday during 2003-2004
All
(mod. A) Workers (mod. B)
Exp(β) (p-value) Exp(β) (p-value)
Age (ref. 30-44 years old)
18-29 years old 0.66 (0.288) 0.55 (0.201)
45-64 years old 0.46 (0.003) 0.35 (0.003)
65-79 years old 0.27 (0.000) 0.30 (0.186)
Gender (ref. Men)
Women 0.99 (0.976) 1.00 (0.989)
Marital status (ref. Married)
Never married 0.72 (0.215) 0.64 (0.256)
Sep., div., wid. 0.64 (0.049) 0.37 (0.052)
Area of residence (ref. Bologna)
Urban band 0.93 (0.762) 1.38 (0.523)
Land 0.67 (0.089) 0.70 (0.402)
Mountain 0.42 (0.001) 0.42 (0.047)
Imola 0.35 (0.000) 0.49 (0.082)
Occupational status (ref.managers, executives, profess., employees)
Self-employed and entrepreneurs 0.35 (0.004) 0.46 (0.060)
Teachers 0.30 (0.013) 0.20 (0.003)
Manual workers 0.33 (0.002) 0.35 (0.005)
Jobless 0.17 (0.000)
Students 2.15 (0.266)
Retired 0.22 (0.000)
Days of vacation from work 1.03 (0.000)
Constant 3.79 (0.000) 2.57 (0.000)
Log-likelihood -522 -185
N 1299 684
The various working categories are characterized by a varying amount of paid vacation days. The percentage of individuals with 45 or more vacation days over the two years considered is 41% among the self-employed, 63% for manual wor-kers, 68% among managers, professionals, and employees, and rises to 79% for teachers. In model B we introduce the number of paid vacation days. The impor-tance of this variable is underlined by high statistical significance: each additional day of vacation increases the odds ratio by about 3%. However, keeping this vari-able under control, differences among groups of workers remain the same as in model A.
The second step of our analysis relates to the length of holiday episodes. In this case a complication emerges: length and holiday characteristics may be stud-ied only for those individuals that actually did go on (long) holiday(s). By estimat-ing our models for this sub-sample of tourists we implicitly assume that this group is randomly extracted from the original sample. In other words, it presup-poses that the decision to go on holiday is not dependent on sociodemographic characteristics. This assumption is evidently in conflict with the results provided in the previous section. We would like to emphasize that both the choice to take holidays and their duration are dependent on several covariates and quite possibly
on one or more unobserved factors, e.g. behavioural attitudes towards lengthy interruptions of daily life. Failure to take this aspect into account could lead to biased estimates.
Heckman (1979) proposed a model able to determine exactly how influential the selection process is and capable of obtaining estimates for the effects of the covariates separate from the selective process. This model can observe any given variable (continuous, ordinal, or categorical) for a single individual, on the condi-tion that an auxiliary seleccondi-tion equacondi-tion has a positive outcome. Specifically, con-sidering the ith individual, the model is composed by two equations to be
esti-mated simultaneously:
a) equation of interest Y1i =X1iβ1+U1i b) selection equation Y2i =X2iβ2+U2i
where X is a 1ji ×Kj exogenous regressor vector, βj is a K × parameter vec-j 1
tor. The variable Y is observed (that is, the first equation is computed for indi-1i vidual i) only if Y >2i 0. Thus, the first equation is limited to the sub-sample
identified by the value of Y2i, while the second equation applies to the entire sample.
For the total population the outcome is:
1 1 1 1
( i| i) i
E Y X =X β i =1,...I (1)
while for the sub-sample, with the available data, the outcome is:
1 1 2 1 1 1 2 1 1 1 2 2 2 ( | , 0) ( | 0) ( | ) 1,... i i i i i i i i i i E Y X Y X E U Y X E U U X i I β β β ≥ = + ≥ = = + ≥ − = (2)
If the two residuals U and 1i U are independent, i.e. the elements are ran-2i domly selected, the expected conditional value of U is zero and the regression 1i function for the selected sub-sample tends towards that of the entire population. However, if the selection is non-random, then the regression equation will de-pend both on X and 1i X and equation a) omits the last term of equation (2). 2i The existence of a correlation between the two residuals means that there is an unobserved factor capable of influencing both case selection and the variable of interest Y . Introducing this correlation in the model permits an estimate of the 1i regressor effects while taking the selection bias under control.
In our analysis, the equation of interest is a multivariate linear regression and the dependent variable is the total number of days spent on (long) holiday(s) in the 2003-2004 period. The selection equation is a probit regression7 and the de-pendent variable is the dummy variable “at least one long holiday in the 2003-2004
period (Yes/No).” Covariates in both equations are the usual factors (gender, age, marital status, area of residence, occupational status).
The two simultaneous equations model can be estimated using aML software (Lillard and Panis, 2003) assuming that residuals U and 1i U are distributed as a 2i bivariate normal distribution and ρ is the measure of correlation between them. Therefore: 1 1 2 1 1 0, U U U N U ρσ σ ⎛ ⎛ ⎞⎞ ⎛ ⎞ ≈ ⎜ ⎜ ⎟⎟ ⎜ ⎟ ⎜ ⎟ ⎝ ⎠ ⎝ ⎝ ⎠⎠
In table 5, we can read the estimated regressor coefficients for the equation of interest8: ceteris paribus, a positive value (negative) means a higher propensity to ex-tend (shorten) the total length of holidays during 2003-2004. We developed two models: one for the whole sample (mod. A) and one limited to the sub-sample of workers (mod. B), in which we include the effect of the number of paid vacation days.
TABLE 5
Heckman models: total number of days spent on (long) holidays during 2003-2004 and according to sociodemographic factors
All cases Workers (mod A) (mod B)
β (p-value) β (p-value)
Age (ref. 18-29 years old)
18-29 years old -3.20 (0.500) -0.72 (0.825)
45-64 years old -5.10 (0.311) -2.63 (0.473)
65-79 years old -5.40 (0.509) 0.23 (0.982)
Gender (ref. Men)
Women 0.68 (0.731) 3.14 (0.091)
Marital status (ref. Never married)
Married 4.42 (0.177) 3.78 (0.113)
Sep.,div., wid. 0.61 (0.890) 3.37 (0.423)
Area of residence (ref. Bologna)
Urban band -6.54 (0.009) -4.72 (0.047)
Land -15.72 (0.000) -12.47 (0.000)
Mountain -13.83 (0.031) -10.57 (0.005)
Imola -13.42 (0.074) -8.03 (0.011)
Occupational status (rif. Manual workers)
Self-employed and entrepreneurs 10.87 (0.045) 12.18 (0.000) Managers, executives, profess., and employees 5.63 (0.359) 5.38 (0.074)
Teachers 12.87 (0.045) 6.16 (0.087)
Jobless 13.55 (0.050)
Students 7.54 (0.365)
Retired 16.94 (0.003)
Days of vacation from work 0.32 (0.000)
Constant 36.43 (0.000) 14.26 (0.034) σU 28.64 (0.000) 20.03 (0.000) ρ -0.02 (0.984) -0.08 (0.907) Log-likelihood -5598 -2907 N 1299 648
8 The estimates related to the selection equation are not reported as they correspond
In both models the most important effects are given by area of residence and occupational status: Bologna residents take, on average, longer holidays (from +7 days compared to greater urban area residents, up to +15 days compared to plains residents). Among the various working categories, manual workers (refer-ence category) are characterized by shorter holidays. Taking constant other fac-tors, the gap is particularly high when we compare this category with the self-employed, entrepreneurs, and teachers. Among non-workers, retired persons usu-ally take more holidays (+17 days in comparison with manual workers) in the two years considered.
The second model (mod. B, table 5), estimated for the sub-sample of workers, permits us to evaluate the effect of paid vacation days: three additional vacation days implies an extra day of holiday. Nevertheless, the introduction of this covari-ate does not change the strength and the significance of the other covaricovari-ates. We note only a slight reduction in the discrepancies caused by area of residence and between manual workers and teachers. In any case, gender, age class, and marital status are not significant.
The residual variance in the equation of interest (σU) is high and statistically
si-gnificant. This result shows the importance of unobserved factors in the explana-tion of the propensity to make longer holidays. However, the correlaexplana-tion between residuals (ρ) is very low and not significant. In other words, the presence of common unobserved factors able to influence both the propensity to make holi-days and the length of trips is not supported by the empirical evidence. This re-sult underlines the importance of working category and area of residence, two va-riables that, as we have seen before, have a strong influence on both decisions, to make holiday or not and for how many days.
Considering the results from both table 4 and table 5, we can trace the follow-ing conclusions: individuals livfollow-ing in Bologna take holidays more frequently and for longer periods; self-employed, teachers and, in particular, pensioners and job-less persons are job-less prone to go on holiday but, when they leave home, they usu-ally stay away longer. On the other hand, managers, executives, professionals, employees, and students go on holiday more often but for shorter stays. Lastly, manual workers tend to holiday less frequently and for shorter periods.
In the third and last step of our analysis we consider whether there are differ-ences in the calendar among various sociodemographic groups. Following the same approach presented in the previous section, Heckman models may be de-veloped to evaluate the effect of the most important sociodemographic factors on the propensity to begin new holidays in August rather than in the rest of the year. Let us consider the lengthiest holiday made during 2004. The selection equa-tion is a probit equaequa-tion with dependent variable equal to “at least one long holi-day in the period 2003-2004 (Yes/No)” and the equation of interest is a second probit equation with dependent variable the dummy variable “holiday begins in August (Yes/No)” (mod. A), or “holiday begins in July or August (Yes/No)” (mod. B). In table 6 we can read the coefficient estimates for the equation of in-terest. A positive (negative) value shows a higher (lower) propensity to start the primary holiday in August or July-August.
TABLE 6
Heckman models: propensity to start the longest holiday during summer months (August or July-August) according to socio-demographic factors during 2004
Probit model: holiday begins in August July-August
(mod. A) (mod. B)
β (p-value) β (p-value)
Age (ref. 18-29 years old)
30-44 years old -0.14 (0.414) -0.33 (0.070)
45-64 years old -0.15 (0.565) -0.30 (0.155)
65-79 years old -0.20 (0.674) 0.07 (0.782)
Gender (ref. Men)
Women -0.01 (0.958) 0.02 (0.852)
Marital status (ref. Never married)
Married 0.04 (0.840) -0.06 (0.852)
Sep., div., wid. -0.17 (0.473) -0.17 (0.304)
Area of residence (ref. Bologna)
Greater urban area 0.16 (0.167) 0.01 (0.967)
Plains 0.13 (0.501) -0.01 (0.957)
Mountains -0.28 (0.435) -0.39 (0.080)
Imola 0.02 (0.962) -0.12 (0.537)
Occupational status (ref. Self-employed and entrepreneurs)
Managers, executives, professionals, and employees -0.43 (0.004) -0.14 (0.345)
Teachers -0.74 (0.015) -0.06 (0.804) Manual workers -0.42 (0.103) -0.34 (0.075) Jobless -0.50 (0.299) -0.03 (0.889) Students -0.50 (0.037) -0.11 (0.650) Pensioners -0.76 (0.060) -0.28 (0.195) Constant 0.60 (0.014) 1.25 (0.000) σU 1 1 ρ -0.33 (0.780) -0.68 (0.181) Log-likelihood -1301 -1228 N 939 939 Statistical significance: '*'<10%; '**'<5%; '***'<1%.
Looking at table 6 mod. A, we discover that differences based on age, marital status, gender, and area of residence are not important. The only variable that re-veals significant effects is occupational status. Entrepreneurs and self-employed persons (reference category) tend to highly concentrate their departures in Au-gust, especially in comparison with teachers, professionals, managers, executives, and employees. But the lowest propensity to start their holidays in August is shown by students and pensioners. However this does not means that they spread out their departures over the rest of the year but simply that their holidays, in comparison with other groups, are taken more often in July: looking at mod. B, where we evaluate the propensity to depart during July or August rather than the rest of the year, no important differences among groups emerge.
We would like to emphasize that the correlation between residuals ρ is nega-tive. This could be a sign of unobserved factors that inversely influence holiday-making propensity and the tendency to concentrate departures in August (or July-August). In other words, the greater the tendency to take holidays, the higher the predisposition to depart in months other than August (or even, other than July and August). However, while not implausible, this result is not supported by ade-quate statistical significance.
8. CONCLUSIONS
The survey carried out in late 2004 on the resident population of the Province of Bologna permits us to trace some initial interesting, though partial, data on holidaymaking habits. In our analysis we devoted considerable effort to applying models based on simultaneous equations according to the approach proposed by Heckman (1979). By doing so, we were able to consider selection bias due to the fact that to analyze holiday characteristics we were forced to limit our attention to the sub-sample of holidaymakers that was not randomly selected from the origi-nal sample.
The results of our analyses reveal that the heterogeneity of holidaymaking be-haviours is considerable and is only partially explained by traditional sociodemo-graphic factors. Ceteris paribus, there are no significant differences according to gender and marital status and even the effect of age is considerably reduced in multivariate models: while older age classes show a lower tendency to start a new holiday, no differences emerge among age groups with regards to trip duration.
Nevertheless, two factors emerged as crucial throughout the analysis: area of residence and occupational status. Individuals living in Bologna, and to some extent in the greater urban area, show higher holidaymaking propensity, traveling more frequently and for longer periods. Pensioners and jobless persons show a low pro-pensity to begin a new holiday episode event though, when they do depart, their stay is usually longer compared to that of other groups. Nevertheless, the main fac-tor is not the condition of being a “worker or non-worker” since crucial differences emerge between groups of workers. On one hand, the self-employed and teachers take infrequent but long holidays; on the other hand, managers, executives, profes-sionals, and employees do not renounce holidaymaking but settle for shorter trips. Manual workers are disadvantaged from both perspectives: they renounce the pleasure of holidays most frequently and, if they do travel, their trip duration is shorter in comparison with that of the rest of the sample.
As suggested in previous studies (Alegre and Pou, 2007; Nicolau and Mas, 2004; Martinez-Garcia and Raya, 2008) time restrictions are important. However, as re-peatedly suggested in the literature, the effect of socio-demographic factor and time availability on length of stay should be evaluated taking constant the tourists’ in-come. Most probably, this lack of information is one of the main limits of our pa-per but it tends to be difficult to obtain reliable information in this respect.
The analysis of holidaymaking propensity in peak season does not reveal rele-vant differences among subgroups whereas some first indications emerge indicat-ing that satisfaction may be more related to holiday length rather than to expen-siveness. However, we believe that the complexity of the analysis in this field re-quires a closer examination with additional data.
Department of Statistics ALBERTO CAZZOLA
University of Bologna
Department of Economics, Business and Statistics ROBERTO IMPICCIATORE
REFERENCES
J. ALEGRE, L. POU (2007) The length of stay in the demand for tourism, “Tourism Management”,
27(6): 1343-1355.
H.P. BLOSSFELD, G. ROHWER (1995) Techniques of event history modeling. New approaches to causal analysis, Mahwah, New Jersey, Lawrence Erlbaum Associates.
F. BURATTO, A. CAZZOLA (2005) Atteggiamenti e comportamenti turistici nelle province di Udine e Bolo-gna, CLEUP, Padova.
D. CALDOW (1997) Non-participation: The other side of motivation: An exploration, Paper presented
at the Australian Tourism and Hospitality Research Conference, Sydney, 6-9 July.
A. CAZZOLA, R. FILIPPINI (2004) Il quadro della ricerca sui comportamenti turistici in provincia di Bolo-gna, in O. GIAMBALVO AND A.P. PARROCO (eds), Analisi dei mercati turistici regionali e sub-regionali, CLEUP, Padova.
D. COLLINS, C. TISDELL (2002)Age-related lifecycles. Purpose variations, “Annals of Tourism
Re-search”, 29(3): 801-818.
A. EYMANN AND G. RONNING (1992)Discrete choice analysis of foreign travel demand in H.J. VOS-GERAU (Edt), Studies in International economics and institutions, Springer, Berlin.
A. FLEISCHER, A. PIZAM (2002) Tourism constraints among Israeli seniors “Annals of Tourism
Re-search”, 29(1): 106-123.
U. GOKOVALI, O. BAHAR, M. KOZAK (2007) Determinants of length of stay: A practical use of survival analysis, “Tourism Management”, 28: 736-746.
V. J. HAUKELAND (1990) Non-travellers: The flip side of motivation, “Annals of Tourism
Re-search”, 17: 172-184.
J. HECKMAN (1979) Sample selection bias as a specification error, “Econometrica”, 47: 153-161. J. HECKMAN, B. SINGER (1984) Econometric duration analysis, “Journal of Econometrics”, 24:
63-132.
ISTAT(2002-04) Statistiche del turismo - Anno 2001-05, Collana d’Informazioni, Roma. ISTAT(2006)I viaggi in Italia e all’estero nel 2004, Indagine multiscopo sulle famiglie “Viaggi e
vacanze” – 2004, Informazioni n. 15.
P. KOTLER (1994) Marketing Management: Analysis, Planning, Implementation and Control, New
Jersy: Prentice-Hall.
LANG RESEARCH (2001) TAMS Overview Report, Toronto, Queens Park Press.
R. LAWSON (1991) Patterns of Tourist Expenditure and Types of Vacation Across the Family Life Cy-cle, “Journal of Travel Research”, 29(4): 12-18.
R. LAWSON (1994) Demographic Segmentation. In Tourism, Marketing and Management handbook, S.
WITT AND L. MOUTINHO (Eds)., 2nd ed., pp. 311-315. New York, Prentice-Hall.
L. A. LILLARD, W.A. CONSTANTJIN, PANIS (2003) A ML Multilevel Multiprocess Statistical Software,
Version 2.0. EconWare, Los Angeles, California.
E. MARTINEZ-GARCIA, J.M. RAYA (2008) Length of stay for low-cost tourism, “Tourism
Manage-ment”, 29: 1064-1075.
Z. MIECZKOWSKI (1990) World Trends in Tourism and Recreation, “American University Studies
Series” XXV Geography (3), New York, Peter Lang.
J.L. NICOLAU, F.J. MÀS (2005) Heckit modelling of tourist expenditure: evidence from Spain,
“Interna-tional Journal of Service Industry Management”, 16(3): 271-293.
M. OPPERMANN (1995) Travel life cycle, “Annals of Tourism Research”, 22(3): 535-552. M. OPPERMANN (1997) First-time and repeat visitors to New Zealand, “Tourism Management”,
18, 177-181.
W.M. PARKER (1976) The Sociology of Leisure. London, George Allen & Unwin.
F. PERUSSIA, R. VIANO(2002) Dimensioni psicosociali del turismo. Una sintesi, in C. STROPPA (Edt) “Mutamento culturale e modelli di turismo”, Bulzoni, Roma.
C. PESTANA BARROS, A. CORREIA(2007) Survival Analysis in Tourism Demand: The length of stay in Latin American destinations, Working Papers 2007/03, Department of Economics at the
School of Economics and Management (ISEG), Technical University of Lisbon.
A. V. SEATON, C. PALMER (1997) Understanding VFR tourism behaviour: The first five years of the United Kingdom tourism survey, “Tourism Management”, 1(6), 345-355.
W. W. SMITH, B. A. CARMICHAEL (2005) A Geographical Analysis of the Rates of Non-Travel Across the Regions of Canada, “Tourism Geographies”, 7(3): 257-271.
C. STROPPA (2002) Il turismo tra costume e progettualità, in STROPPA C. (Edt) Mutamento culturale e modelli di turismo, Bulzoni, Roma.
H. H. SUNG, A. M. MORRISON, G.-S. HONG, J. T. O’LEARY (2001) The effects of household and trip charac-teristics on trip types: A consumer behavioural approach for segmenting the US domestic leisure travel market, “Journal of Hospitality & Tourism Research”, 25(1), 46-68.
T. TOIVONEN(2004) The Change in Propensity to Take Holiday Trips abroad in EU Countries Be-tween 1985 and 1997, “Tourism Economics”, 10(4): 403-417.
TRADEMARK ITALIA AND SOCIOMETRICA (2007) Dove vanno in vacanza gli italiani 2007,
http://www.trademarkitalia.com/ricerche.cfm?IdNews=2990
R.G. WALSH, K.H. JOHN, J.R. MCKEAN AND J.G. HOF(1992)Effect of Price on Forecasts of Participation in Fish and Wildlife Recreation: An Aggregate Demand Model, “Journal of Leisure Research”,
24 (2): 140-156.
SUMMARY
Timing and holidays duration for people residing in the Province of Bologna
The survey carried out in late 2004 in the Province of Bologna made possible an analy-sis of the main characteristics of holidays taken in the two-year period 2003-2004. In par-ticular, we evaluated the effects of several sociodemographic traits on the propensity of holidaymaking, taking longer holidays, and starting holidays in peak season. The analyses were developed using multivariate models including Heckman models based on estima-tion of simultaneous equaestima-tions in order to take into account the selecestima-tion bias embedded in the phenomenon under study. Results highlight that tourist behaviours are strongly af-fected by personal and unobserved attitudes. However, area of residence and occupa-tional status (to be a worker or non-worker, and working category) emerge as key factors that influence holidaymaking propensity and holiday length.