D
S
E
Working
Paper
A participatory approach for
assessing alternative climate
change adaptation responses
to cope with flooding risk in
the upper Brahmaputra and
Lucia Ceccato
Valentina Giannini
Carlo Giupponi
Dipartimento
Scienze Economiche
Department
of Economics
Ca’ Foscari
University of
W o r k i n g P a p e r s D e p a r t m e n t o f E c o n o m i c s C a ’ F o s c a r i U n i v e r s i t y o f V e n i c e N o . 1 8 / W P / 2 0 0 9
ISSN 1827-3580
The Working Paper Series Department of Economics
A participatory approach for assessing alternative climate change adaptation responses to cope with flooding risk in the upper
Brahmaputra and Danube river basins Lucia Ceccato
Ca’ Foscari University of Venice Valentina Giannini
Ca’ Foscari University of Venice and Fondazione Eni Enrico Mattei Carlo Giupponi
Ca’ Foscari University of Venice, Fondazione Eni Enrico Mattei of Venice and CMCC
First Draft: September 2009
Abstract
This work illustrates the preliminary findings of a participatory research process aimed at identifying responses for sustainable water management in a climate change perspective, in two river basins in Europe and Asia. The paper describes the methodology implemented through local workshops, aimed at eliciting and evaluating possible responses to flooding risk. Participatory workshops allowed for the identification of four categories of possible responses and a set of nine evaluation criteria, three for each of the three pillars of sustainable development. The main result of such activities consists in the ranking of broad response categories, to contribute to the orientation of the Brahmatwinn research project towards the identification of Integrated Water Resource Management Strategies (IWRMS) well grounded upon the issues and preferences elicited from local experts. The mDSS tool was used to facilitate transparent and robust management of the information collected through Multi-Criteria Decision Analysis (MCDA) and the communication of the outputs.
Keywords
Participatory process, Climate Change, Flooding Risk, Decision Support System, MCDA JEL Codes
C61, Q01, Q54, Q56, Q58
Address for correspondence:
Carlo Giupponi
Department of Economics Ca’ Foscari University of Venice Cannaregio 873, Fondamenta S.Giobbe 30121 Venezia - Italy Phone: (++39) 041 2349126 Fax: (++39) 041 2349176 [email protected]
This Working Paper is published under the auspices of the Department of Economics of the Ca’ Foscari University of Venice. Opinions expressed herein are those of the authors and not those of the Department. The Working Paper series is designed to divulge preliminary or incomplete work, circulated to favour discussion and comments. Citation of this paper should consider its provisional character.
1. Introduction
According to the last assessment report released by IPCC in 2007, climate has been changing and will continue to change even if greenhouse gases (GHGs) emissions were reduced to meet the targets of the Kyoto protocol (IPCC 2007; Mace 2005). There is a call for policy measures both for emission abatement, i.e. mitigation, and for impact reduction, i.e. adaptation. Indeed, even if we could be effective in implementing emission reduction policies, we would still need to adapt, because of lags in climate response to GHGs already emitted in the atmosphere we will experience more climate warming than we have already observed (IPCC 2007). Especially poor and developing countries, which are marginally responsible for anthropogenic climate change, will be the ones most affected by the expected impacts (Heltberg et al. 2009). Climate change is therefore also an issue of equity and adaptation policies should continue to have a role in the international negotiations (Mace 2005).
Not giving the right importance to adaptation would mean a burden on those sectors that will bear the biggest impacts of climate change, as is the case of water provisioning in river basins fed by glacier melt (Mace 2005). Places already facing unstable water regimes and resource availability are most likely to suffer from water shortages, but also flooding risks may be exacerbated in different seasons (e.g. post-monsoon season in the Himalayas) and therefore improving water management now will also mean considering adaptation to future scenarios (EC 2009). Management choices are becoming more and more urgent.
Adaptation has been on the agenda since the Earth Summit in Rio (1992) and reference to adaptation can also be found in the United Nations Framework Convention on Climate Change (UNFCCC 1992) and the Kyoto Protocol (1997). According to the UNFCCC Annex II, countries that ratified the convention made a legally binding commitment to fund adaptation in the developing countries (www.unfccc.int; Mace 2005). However, it is not until the Marrakech Accords (2001) that adaptation policies and projects have gained importance (Schipper 2006) and in the Fourth Assessment Report of the IPCC (2007), we find reference to research needs for adaptation, mitigation and development.
Projected climate changes for the 21st century in mountains of the world is two to three times greater than the change observed in the 20th century (Nogues-Bravo et al. 2007). All mountains are expected to warm, but warming will vary relative to location. Depending on which IPCC-SRES scenario is considered, in 2055 mid-latitude mountains of Asia have a projected temperature increase between 2.7 and 3.8 °C, while mid-latitude mountains of Europe have a projected temperature increase between 2.3 and 3.3°C (Nogues-Bravo et al. 2007). However, assessing impacts of this temperature change is not so straightforward because of non-linear feedbacks between impacts, and because of uncertainty in downscaling of Global Circulation Models (Nogues-Bravo et al. 2007).
Glaciers have been retreating and decreasing in volume since the end of the 1980s, similarly mountain snowpack has been significantly decreasing, thus negatively affecting their role as water reservoirs, and affecting in turn the hydrologic regimes (Nogues-Bravo et al. 2007) and in particular the water storage capacity of mountains (Stewart 2009). Catchments that rely on either glacier or snowpack melt -or both- as a source of water will be significantly affected by climate change (Viviroli and Weingartner 2004; Stewart 2009). For example, earlier snowmelt might result in winter and spring floods, thus in longer summer droughts (Stewart 2009). Climate change will also decrease water availability in lowlands that are influenced by discharge from contiguous mountain (Messerli et al. 2004). Relatively high mountain run-off can be found in semi arid and arid regions, such as the Himalayas, but also in some humid regions, such as the European Alps (Viviroli et al. 2007). We can thus say that mountains are important for the hydrology of the lowlands, especially when lowlands are arid, as is the case with the Himalayas (Viviroli and Weingartner 2004; Messerli et al. 2004). Similar problems will be faced by populations in parts of the world, which are far one from the other from the physical and socio-economic points of view.
Moreover, large catchments are often transboundary. Research needs therefore to span over borders encompassing the whole catchment and cooperation projects should be set up to enhance capacity and mutually learn (Renn 2006). Mutual learning can be very beneficial and needs to be horizontal, involving people who share background and knowledge on one same issue in different places. Mutual learning should also be vertical, integrating knowledge coming from different sciences, including knowledge
from stakeholders. Participatory processes can be of many kinds and defining what is the goal of the participatory process is necessary before identifying the most suitable approach for the given case (Irvin and Stansbury 2004).
Stakeholders’ involvement is at the basis of any participatory process of policy/decision making, such as the development of Integrated Water Resource Management (IWRM) plans and project. Stakeholders hold necessary information that should be used in social and eco-system management, thus facilitating the exploitation of scientific knowledge with social relevance (De La Vega-Leinert et al. 2008). In the context of research projects the participation of stakeholders can contribute significantly towards the production of project outcomes that are better suited to fulfil society’s needs (de La Vega-Leinert et al. 2008), thus increasing the impacts of research efforts. During participatory processes mutual learning occurs between scientists and stakeholders, new opinions can be created, problems can be explored, technical expertise combined, agreements produced, and compromise solutions found if all vested interests are voiced (Renn 2006).
In parallel to the increasing emphasis on public participation in IWRM, there is also an increasing attention to the need for efficient tools for supporting the management of those processes and the role that could be played by information and communication technologies (ICT), and in mathematical simulation models and Decision Support Systems (DSS) tools. In the context of climate change research the first category of tools, may provide scientifically based scenarios and projections – prerequisites for any planning activity - while DSS tools may provide the ground for bridging the scientific contributions (i.e. by further elaborating modelling outcomes) and decision/policy making processes, including the management of the participation of different actors (e.g. policy makers, local experts, dwellers, etc.). Despite the theoretical potential, traditional modelling techniques have shown limited impacts on policy making, especially with respect to complex systems such as those involved in natural resource management, and one of the most often cited problems is the limited involvement of stakeholders and potential users (Geurts and Joldersma 2001). The opportunity emerges therefore to develop new tools which combine the potentials of advanced ICT tools and robust participatory approaches (Mysiak et al. 2005). Such tools could be identified as
formulation of a conceptual model and its formalisation is carried out by disciplinary experts with the direct involvement of stakeholders and in a way that is coherent with the so called “hard science” modelling approaches to be adopted (Sgobbi and Giupponi 2007).
Having recognised the relevance of the issues briefly discussed above, the Brahmatwinn research project1 has planned a participatory process to integrate scientific and
stakeholders’ knowledge to deal with water management, climate change and Alpine regions in Europe and Asia. For this purpose, a programme of local workshops in two twinned river basins, the Upper Brahmaputra and the Upper Danube (below UBRB and UDRB, respectively), has been defined in parallel to the more usual research activities in the various disciplinary fields (dynamic climatology, hydrology, sociology, economics, etc.) relevant for the integrated assessment of climate change impacts and development of adaptation strategies. The integration of the two research streams allowed the project to facilitate the dissemination of results of scientific, data-driven analyses about the drivers of change on the river socio-ecosystems and related impacts, on the one hand and, on the other, to orient and consolidate those investigations according to the feedback collected through the involvement of local actors (LAs)2.
In this article we present one methodological and operational proposal for the management of decision processes in a participatory context for the development of an IWRM plan considering also the climate change perspectives and adaptation needs. In particular we illustrate some of the methods and findings of the Brahmatwinn Project by referring to the participatory process carried out in the two river basins in Europe and Asia: UDRB and UBRB. Section 2 introduces to the methodological framework adopted for the case studies, the information base and the DSS design. Section 3 presents the results of the application of the proposed approach to the Brahmatwinn project, and Section 4 discusses the acquired evidences and drives some conclusive remarks.
1 Project title: Twinning European and South Asian River Basins to enhance capacity and implement adaptive management
approaches. (BRAHMATWINN). Project no: GOCE -036952. Research funded by the European Community, SUSTDEV-2005-3.II.3.6: Twinning European/third countries river basins.
2 We preferred to use the term local actor (LA), to identify all the people involved in the case study activities instead of the commonly used term stakeholder, to emphasise the fact that they were simply people who did not belong to the project consortium (typically local experts or policy makers), that were involved by partners responsible for the management of case studies, without ad hoc analyses for assessing their representativeness, such as Social Network Analysis.
2. Methods
2.1. The methodological framework
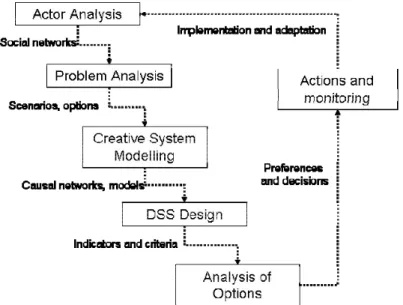
The approach adopted for the analysis of alternative adaptation responses is grounded in the NetSyMoD methodological framework (Giupponi et al. 2008) for the management of participatory modelling and decision processes (Figure 1).
Figure 1: The NetSyMoD approach for participatory modelling and decision making (source: Giupponi et al., 2008).
The framework is organised in six main phases. The first three (Actors’ Analysis,
Problem Analysis, Creative System Modelling) provided the Brahmatwinn Project with
(1) an in depth analysis of general problems related to water resources management in the two upper river basins, with the participation of the communities of interested parties in the case study areas, and (2) mental model representations of the problems, i.e. qualitative description of the causal links between the various components of the local socio-ecosystems by means of cognitive maps clustered in order to become consistent with the DPSIR framework (Driving forces, Pressures, State, Impacts, and Responses; EEA, 1999), used as an upper – aggregated – level communication interface. The subsequent phases, DSS Design and Analysis of Options, were the object of the activities carried out at the two workshops discussed in this paper, and contributed with the design and evaluation of a set of alternative responses performed
with group elicitation techniques and the application of the DSS tool. The last phase,
Actions and Monitoring, is out of the scope of the research project.
The DSS Design phase consists of system specification and development of software tools capable of managing the data required for informed and robust decisions. The
Analysis of Options is performed within the DSS software through Multi Criteria
Decision Analysis (MCDA), which provides a framework for decision analysis, and a set of techniques aiming at the elicitation and aggregation of decision preferences (Figueira et al. 2005). In this case MCDA demonstrates how to assist a decision maker, or a group of decision makers, in identifying the best alternative from a range of alternatives in an environment of conflicting and competing criteria and interests (Belton and Stewart, 2002).
2.2. The background information
The participation of local actors of the two case studies was carried out through a series of workshops (WSs) in which brainstorming techniques were firstly used to elicit the most relevant local issues and the most promising responses - potential or in place - to cope with flooding risk in a climate change perspective. In parallel disciplinary experts of the project explored the problems, identified data sources and developed a system of representative indicators.
In order to combine and compare the acquisitions from both the side of the researchers and of the local actors belonging to the two case study sites, an extensive Integrated Indicator Table (IIT) was developed, which represented the knowledge base for the activities described herein. On the left side of the table a hierarchical classification of the information relevant for the whole research project is reported, starting with the level of greatest aggregation, i.e. four “Themes” (Environmental, Economic, Social and Governance). The “Themes” are disaggregated into “Domains”, which are further segmented into “Sub-domains”. Such a categorisation of relevant information for the project was developed with a Delphi technique in a series of steps, in which all the project partners were involved. At the highest level of detail, “Indicators” were identified by partners (one or more per Sub-domain) as the means for providing quantitative assessment of the various typologies of information dealt with by the project. The left hand side of the IIT thus represents a comprehensive catalogue of
project information provision. On the right hand side of the IIT, the issues identified by local actors during the workshops dedicated to the NetSyMoD phases of Problem
Analysis and Creative System Modelling were then assigned to ”Sub-domains”, thus
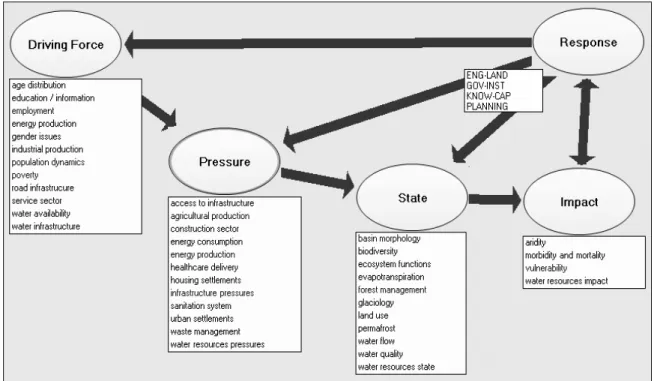
providing an interface between the potential supply of information from project activities, and the demand of information from potential beneficiaries. Sub-domains were also assigned to the five nodes of the DPSIR framework, in preparation of the utilisation of the DSS adopted by the project, i.e. mDSS (Giupponi 2007; www.netsymod.eu/mdss), which uses such a framework for the analysis of the causal interactions between human activities and the environment (see Figure 2).
All the items relevant for the identification of possible IWRM strategies to cope with climate change adaptation needs in the two areas were categorised as Responses (according to the DPSIR definition) and classified in four broad typologies:
1. ENG-LAND: Engineering Solutions and Land Management (e.g. dam construction, river network maintenance, soil conservation practices, etc.);
2. GOV-INST: Investments in Governance and Institutional Strength (e.g. accountability and transparency in government actions, enforcement of existing regulations, flood insurance, etc.);
3. KNOW-CAP: Knowledge Improvement and Capacity Building (e.g. awareness raising activities, dissemination of scientific knowledge, training of public employees, etc.);
4. PLANNING: Solution based on planning instruments (e.g. design and implementation of relief and rehabilitation plans, hazard zoning, etc.).
A sixth category was introduced to classify indicators describing climate change projections as Exogenous Drivers (ED).
Figure 2: The conceptualisation of the information base stored in the IIT within the DPSIR framework (screenshot of the mDSS software).
2.3. The DSS Design and implementation
Building upon the information acquired in the participatory activities carried out in the first two years of the project and referred to the first three NetSyMoD phases, two new workshops were organised, one in Salzburg, Austria (UDRB) and one in Kathmandu, Nepal (UBRB), with the aim of testing the proposed methodology and providing the project consortium with a preliminary assessment of the expected effectiveness of the four response categories to cope with flooding risks under the pressure of climate change in the two river basins. In order to guarantee the comparability of the results of the two river basins, both workshops were structured using the same methodology and procedure, designed with the purpose of building a common language, knowledge and understanding of the problems within the groups of local actors, and between them and the research consortium.
Following the techniques developed in a series of previous applications of the NetSyMoD approach, the workshops started with the presentation of the goals and of the preliminary results of the downscaling of climate change (CC) scenarios, by means of storylines developed by the project climatologists (Institute for Atmospheric and
Environmental Sciences of Johann-Wolfgang Goethe University, JWG), with focus on the possible effects of CC on local water resources over the coming 40 years3.
Having introduced the problem and the scenarios, a brainstorming session was conducted for eliciting and consolidating the sets of possible responses within the four main categories, as defined throughout the previous project meetings. This section created the bases for the correct implementation of the further steps, and led to the identification of sub-categories and specific actions, within the proposed four major categories of responses, in order to:
• consolidate the range of possible adaptive responses to cope with flooding risk and CC;
• develop a common understanding of the broad classes of adaptive responses;
• enhance the confrontation among LAs regarding the needs and the opportunities of intervention in the river basin;
• analyse and compare LAs’ opinions from the twinned river basins in Europe and Asia.
Having consolidated the identification of responses, the participants were asked to move to the selection of the criteria for the evaluation of responses, from the Sub-domains listed in the IIT. Every participant was asked to rank them in terms of relevance for evaluating the responses, by identifying the first, second and third most important criterion (i.e. Sub-domain) within the three lists pertaining to the Economic, Social and Environmental Domains. The selection was carried out by every LA through a voting exercise, then the votes were summed up and the criteria with the highest scores selected. In the case of equal performance, the criterion voted by the highest number of LAs was preferred.
After having identified the evaluation criteria, participants were involved in the exercise for attributing criterion weights. The criterion weights provide the information about the relative relevance to be given to the criteria, within the set of nine selected (three per sustainability Domain), in order to identify the most promising responses to cope with the issue of flooding under the pressure of CC. The criteria weighting procedure was
based on the method proposed by Simos (1990) and revised by Figueira and Roy (2002). The method utilizes two sets of cards provided to each participant. In the coloured set each card identifies one of the objects to be weighted (in this case the criteria) and the weighting is expressed by placing the cards according to their ranking. The set of white (blank) cards allows participants to emphasise differences between ranks by interposing one or more white cards between two successive coloured cards. The participants are also asked to express a measure of the overall multiplicative distance between the first and the last object4. Criterion weights are subsequently
calculated using the ranking and the overall difference, with a simple algorithm, which converts ranks into real numbers summing up to 1, i.e. the vector of weights to be applied to the evaluation criteria in the subsequent MCDA. Experience shows that this method is very appropriate for these workshops, because it provides a simple and effective approach for weighting, without the need of a computer lab.
Criteria and responses were used to define the entries of the Analysis Matrix (AM) (9 rows and 4 columns for criteria and response options respectively) and, together with the weight vectors, they were utilised for the subsequent evaluation exercise, by means of the MCDA methods provided by the mDSS software. Participants were asked, therefore, to proceed to fill the matrix by evaluating the potential effectiveness of each response (columns) in coping with the issues expressed by the criteria (rows) by means of a Likert scale (from 1 to 5 ranging from “very high effectiveness” to “very low effectiveness”). Forms were thus distributed to all the participants with the question: “What is the potential effectiveness of the Responses (columns) in coping with the issues expressed by the criteria (rows)?” and the AM with the Likert scale reported in every cell where participants placed tick marks expressing their preferences.
Moreover, in accordance with the “Guidance Notes for the lead authors of IPCC 4th Assessment Report on Addressing Uncertainties” (IPCC 2005), a second scale was added in every cell to analyse the degree of confidence and uncertainty related to local actors’ opinion. Here, the concept of uncertainty was related to the unpredictability of the effectiveness of the responses, which can be caused by various reasons: e.g. the
4
For practical reasons, the card sets were substituted by form sheets with graphical representations of the cards, to be compiled by colouring or coding blank cards, thus facilitating the recording and collection of data.
unpredictable projections of human behaviour; the unpredictable evolution of political systems; the chaotic components of the eco-system, etc. Thus, a second question was reported in the form sheets: “What is your degree of confidence in giving your answer, considering its predictability?”, and a second Likert scale was added in every cell of the AM.
The compilation of the AM concluded the first part of the NetSyMoD workshop. All the data collected were coded with a spreadsheet software and then passed to the mDSS tool, for Multi-Criteria Analysis (MCA) and Group Decision Making (GDM). The mDSS software allowed for the comparison of the alternative options using MCA techniques, by operating parallel evaluation processes, representing the preferences of each participant. The alternative options (i.e. the four categories of responses), were judged against their contributions to solve the expected impact due to flooding under a CC scenario, expressed through the criteria values and their weights.
In practice, the qualitative evaluations contained in the Analysis Matrix were transformed in scores expressing the performances of the responses by applying a normalisation procedure, which converts them into a continue scale from zero to one, subsequently processed by means of MCA decision rules. For the purposes of the workshop the Simple Additive Weighting (SAW) decision rule was utilised to aggregate partial preferences of the individual criteria into a global preference and rank of the alternative responses. SAW applies additive aggregation of decision outcomes, which is controlled by weights expressing the importance of criteria. It is one of the most popular decision methods because of its simplicity and for this reason it was adopted for reporting on the outcomes of the evaluation exercise, all together with the results of the combination of all the rankings expressed by the participants, by means of the Borda rule. The Borda rule is one of the most simple outranking procedure provided by the mDSS software, in which a total Borda mark is calculated by summing up all the (reversed) rankings obtained by the LAs (i.e. the best option is given a value of 3, while the worst, in this case the fourth is given a value of 0). The best (consensus) option is obviously the one with highest total Borda mark.
All the results of data processing were reported in plenary to the participants in the final part of the NetSyMoD workshop.
4. Results
According to the preliminary results of downscaled CC scenarios, in both study areas, intensified weather events are expected to cause an increase of rainfall in the wet season and of droughts, during the dry periods. Climate change could thus exacerbate the uncertainty related to water availability, its quality and to the occurrence of extreme events, as Brahmatwinn climatologists have suggested. The procedure described above produced the selection of the criteria from the Integrated Indicators Table. LAs in the two river basins converged on the same five criteria, out of nine, choosing from a set of 40 criteria listed in the IIT (15 social criteria, 17 environmental criteria, and 8 economic ones). Such a relatively large number of common selected criteria reveals that the two river basins, even if characterised by different geographical locations, ecological, social and economic dimensions, present similar problems and issues, at least in the perception of LAs participating to the project meetings. This finding is very useful to address more effectively further research efforts, focusing on the analysis, on the one side, on the comparable relevant issues, on the other, on the indicators specifically relevant at the local level. These results have been circulated among the research consortium to drive the attention of modellers in the next phase of the project, where quantitative indicators will be produced in both case studies.
Beside the emergence of the above listed important similarities in the opinion of LAs in the two river basins, further outcomes of the vote distribution analysis in each river basin are noteworthy. Concerning the social criteria the distribution of votes shows that, in both areas, the criteria relevant only in one or the other river basin also were the most voted ones. This tells us that even if we can recognise similarities in the two areas, from a social point of view, strong attention has to be put on the peculiarities of each geographical area, trying to avoid a trite generalization of problems. In the Upper Brahmaputra River Basin, to which belong mainly low income countries, “Poverty” is picked as the most relevant criterion by a marked majority of local actors, highlighting how poverty level and low life styles strongly affect the significance of flooding damages. Indeed, any response to deal with poverty problems would not reduce flooding occurrence, but would lower flooding risk vulnerability and increase the adaptive capacity of the socio-ecosystem. On the other side, in the UDRB, LAs converged their votes to “Housing settlements” and “Population Dynamics”, showing
the different perspective in the European area when considering flooding risk. According to LAs, the flooding risk in the UDRB seems to be affected mostly by the concentration of housing, high density of population and concentration of residential construction, located in areas exposed to flooding risk.
The preferences expressed on environmental criteria don’t reveal a strong convergence of opinion to specific criteria. In both river basins, a variety of different environmental indicators were considered as relevant. This is particularly marked in UDRB, whereas in the UBRB, with exception of “Precipitation”, we can recognize an evident concordance on the importance of the three criteria “Vulnerability”, “Basin morphology” and “Forest
management”5. It is interesting to also notice that on the average “Forest management”
was considered relevant only in the UBRB. Forest management is, indeed, a historically important topic in this area, and probably due to the importance of this issue for the area, LAs considered this criterion one of the most relevant also for evaluating the effectiveness flooding risk reduction policies.
With respect to the economic criteria, “Agriculture production” has been considered as one of the most relevant criteria in both river basins, but more so in the Upper Brahmaputra. This confirms that, according to LAs’ opinion, agricultural systems, irrigation infrastructures and land use in general are crucial and can contribute to either aggravate or reduce the risk from flooding. Within the criteria relevant only in one or the other specific area, in the UDRB LAs focused on the “Construction sector” and “Energy consumption”, while in the UBRB “Energy production” and “Employment” appeared to be more significant.
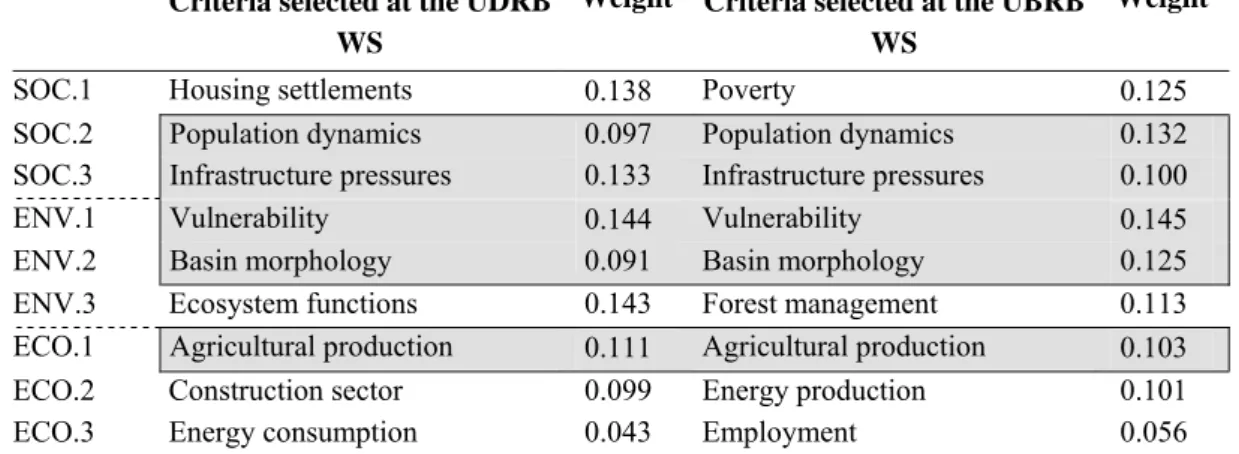
Having identified the set of nine evaluation criteria, workshop participants defined their relative importance by attributing criterion weights. On the average, in both river basins the highest weight was given to the “Vulnerability” criterion, meaning that it was considered the most important element for the ranking of flood responses (see Table 1). In the UDRB, “Ecosystem function” obtained almost the same weight of “Vulnerability”, revealing the high consideration of European LAs for ecosystem health and the related services provided to human beings, and “Housing Settlements” closely
followed it. In the Upper Brahmaputra river basin, the second most important criterion was “Population dynamics” and “Poverty” was the third, as reported in Table 1.
Criteria selected at the UDRB WS
Weight Criteria selected at the UBRB WS
Weight
SOC.1 Housing settlements 0.138 Poverty 0.125 SOC.2 Population dynamics 0.097 Population dynamics 0.132 SOC.3 Infrastructure pressures 0.133 Infrastructure pressures 0.100 ENV.1 Vulnerability 0.144 Vulnerability 0.145 ENV.2 Basin morphology 0.091 Basin morphology 0.125 ENV.3 Ecosystem functions 0.143 Forest management 0.113 ECO.1 Agricultural production 0.111 Agricultural production 0.103 ECO.2 Construction sector 0.099 Energy production 0.101 ECO.3 Energy consumption 0.043 Employment 0.056
Table 1: Criteria selected by LAs from the Integrated Indicators Table
Besides the difference in the relative importance of each criterion, it is interesting to observe that in both river basins LAs tend to consider more significantly environmental and social criteria, than economic ones. We can easily see this by summing up criterion weights for each dimension: the environmental dimension was considered the most important, counting for 38% of the total weights, followed by the social - 36-37% - and lastly by the economic one -25-26%.
The calculation of weights by means of average aggregation, however, can homogenise and flatten the values. Aggregate values can therefore hide important information, such as divergence and convergence of participants’ opinions. For this reason, we also analysed the distribution and the spread of individual preferences for each criterion weight using Box and Whisker plots and the Variability Coefficient. We verified, thus, that in general, among the Salzburg participants, there was a good accordance in weights attribution. The only exception was for “Basin Morphology”, for which 50% of LAs’ opinions spread around a large range of weight values. On the contrary, in the Kathmandu workshop we observed a quite high discordance in weight evaluations around the average. Only the “Employment” criterion showed a good concordance in the weight distribution.
The discordance in the weight evaluations reflects clearly the different perceptions and objectives of LAs, and reveals the presence of possible conflicts of interests among them. The elicitation of weights is therefore a very crucial phase, because weights can strongly influence the results. For this reason, in theory, it should be guarantied that all issues at stake are equally represented and integrated in the participative exercises.
Figure 3: Spreads of weights as expressed by workshop participants in the two river basins.
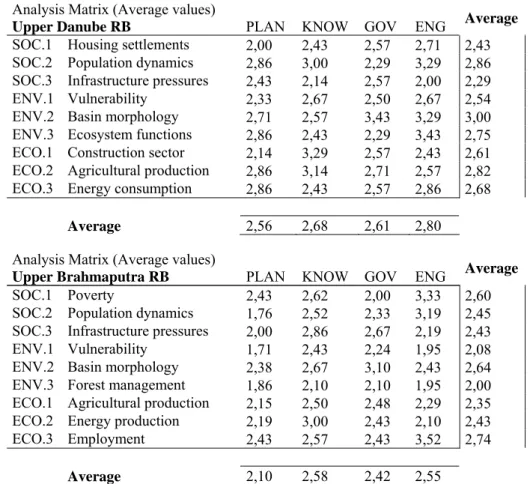
Using all the collected information from the exercise of filling the matrix and aggregating the individual LAs’ evaluations, two average AMs were built (see Table 2). Having remembered the effect of averaging the different views of the involved LAs, we can observe that both UDRB and UBRB results showed that none of the categories of responses is clearly dominating the others. All the average criterion scores (row) or response (columns) are in a range between “very high effectiveness” and “medium effectiveness”, meaning that all the responses are considered to be potentially good for responding to flooding risk. This stresses the potential validity of the four categories of
responses, while, on the other hand, it also evidences the need for more detailed analyses within the categories, to be carried out in a subsequent phase of the project.
Analysis Matrix (Average values)
Upper Danube RB PLAN KNOW GOV ENG Average
SOC.1 Housing settlements 2,00 2,43 2,57 2,71 2,43 SOC.2 Population dynamics 2,86 3,00 2,29 3,29 2,86 SOC.3 Infrastructure pressures 2,43 2,14 2,57 2,00 2,29 ENV.1 Vulnerability 2,33 2,67 2,50 2,67 2,54 ENV.2 Basin morphology 2,71 2,57 3,43 3,29 3,00 ENV.3 Ecosystem functions 2,86 2,43 2,29 3,43 2,75 ECO.1 Construction sector 2,14 3,29 2,57 2,43 2,61 ECO.2 Agricultural production 2,86 3,14 2,71 2,57 2,82 ECO.3 Energy consumption 2,86 2,43 2,57 2,86 2,68
Average 2,56 2,68 2,61 2,80
Analysis Matrix (Average values)
Upper Brahmaputra RB PLAN KNOW GOV ENG Average
SOC.1 Poverty 2,43 2,62 2,00 3,33 2,60 SOC.2 Population dynamics 1,76 2,52 2,33 3,19 2,45 SOC.3 Infrastructure pressures 2,00 2,86 2,67 2,19 2,43 ENV.1 Vulnerability 1,71 2,43 2,24 1,95 2,08 ENV.2 Basin morphology 2,38 2,67 3,10 2,43 2,64 ENV.3 Forest management 1,86 2,10 2,10 1,95 2,00 ECO.1 Agricultural production 2,15 2,50 2,48 2,29 2,35 ECO.2 Energy production 2,19 3,00 2,43 2,10 2,43 ECO.3 Employment 2,43 2,57 2,43 3,52 2,74
Average 2,10 2,58 2,42 2,55
Table 2: Analysis Matrix - average values of LAs’ evaluations on the potential effectiveness of each response in coping with the issues expressed by the criteria (rows) by means of a Likert scale
ranging from 1 “Very high effectiveness” to 5 “Very low effectiveness”.
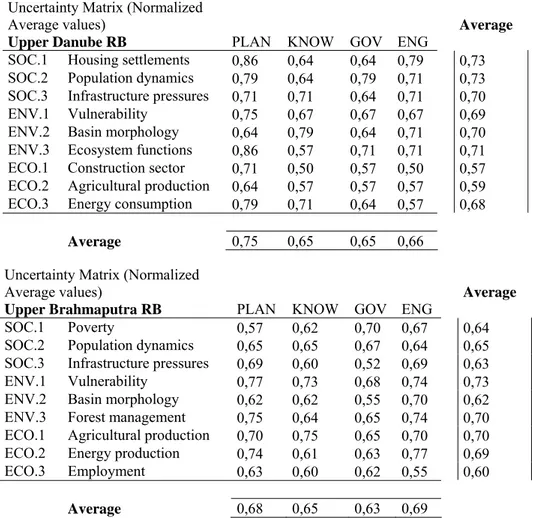
A supplementary confirmation of these results is given by the general confidence LAs’ attributed to their evaluations (see Table 3). All the answers were given with a confidence above the normalised value 0.5 and very close to the highest one (i.e. 1.0). This outcome reflects the fact that local actors consider, even with a relative degree of unpredictably, all the four categories of responses to positively match their expectations in term of their effectiveness. A detailed analysis of Table 2 and 3 allows investigation of relative variations of performances of the combination of criteria and strategies, also in terms of uncertainty of the judgements provided. We do not go in such details here given the demonstration character of the application.
Uncertainty Matrix (Normalized Average values)
Upper Danube RB PLAN KNOW GOV ENG
Average
SOC.1 Housing settlements 0,86 0,64 0,64 0,79 0,73 SOC.2 Population dynamics 0,79 0,64 0,79 0,71 0,73 SOC.3 Infrastructure pressures 0,71 0,71 0,64 0,71 0,70 ENV.1 Vulnerability 0,75 0,67 0,67 0,67 0,69 ENV.2 Basin morphology 0,64 0,79 0,64 0,71 0,70 ENV.3 Ecosystem functions 0,86 0,57 0,71 0,71 0,71 ECO.1 Construction sector 0,71 0,50 0,57 0,50 0,57 ECO.2 Agricultural production 0,64 0,57 0,57 0,57 0,59 ECO.3 Energy consumption 0,79 0,71 0,64 0,57 0,68
Average 0,75 0,65 0,65 0,66
Uncertainty Matrix (Normalized Average values)
Upper Brahmaputra RB PLAN KNOW GOV ENG
Average
SOC.1 Poverty 0,57 0,62 0,70 0,67 0,64 SOC.2 Population dynamics 0,65 0,65 0,67 0,64 0,65 SOC.3 Infrastructure pressures 0,69 0,60 0,52 0,69 0,63 ENV.1 Vulnerability 0,77 0,73 0,68 0,74 0,73 ENV.2 Basin morphology 0,62 0,62 0,55 0,70 0,62 ENV.3 Forest management 0,75 0,64 0,65 0,74 0,70 ECO.1 Agricultural production 0,70 0,75 0,65 0,70 0,70 ECO.2 Energy production 0,74 0,61 0,63 0,77 0,69 ECO.3 Employment 0,63 0,60 0,62 0,55 0,60
Average 0,68 0,65 0,63 0,69
Table 3: Uncertainty Matrix- average values of LAs evaluations expressing the degree of confidence related to their answer (Scale of confidence: 1 “Very high confidence” to 0 “Very low confidence”).
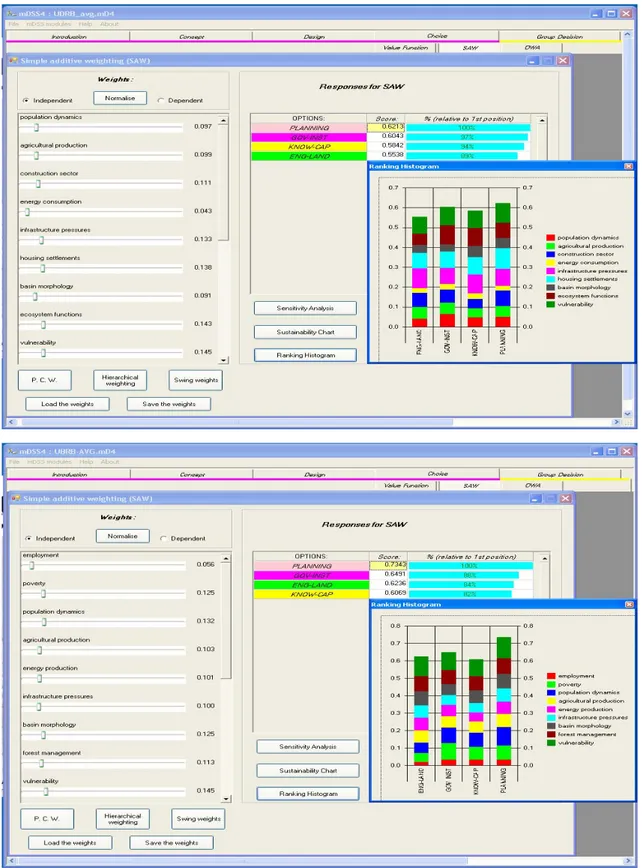
The last part of the analysis consists in the calculation of the ranking of alternatives by applying the MCDM capabilities of the mDSS software. The Simple Additive Weighting decision rule was adopted for its simplicity and easiness in communicating to workshop participants. The average scores of the Evaluation Matrix (the normalised Analysis Matrix), were thus processed by multiplying each criterion value by the corresponding weight, and then summing up the values along the columns.
As we can see from Figure 4, the PLANNING category of responses has been evaluated by LAs of both river basins as the most promising in terms of effectiveness to cope with problems related to flooding risk under the pressure of climate change. Planning is followed by the GOVERNANCE typology of responses. KNOWLEDGE
IMPROVEMENT AND CAPACITY BUILDING and ENGINEERING AND LAND MANAGEMENT solutions have reversed order in the UDRB and the UBRB, but still
Figure 4: UDRB (first) and UBRB (second) Analysis of Alternatives. On the left side we can see the applied criterion weights, while on the right side the SAW window appears with the final ranking.
The score of the best response is coloured in yellow and has a relative value of 100%. The others are ranked in % relative to the first position. The histogram graph can help to visualise the results
On one side, very similar results were recorded in the two river basins concerning also the final ranking, confirming that, beside the differences in their environmental and socio-economic conditions, the areas present a certain level of problem similarities, and also of expectations regarding possible solutions. On the other side, however, all the categories of response strategies performed very similarly, meaning that no clearly preferred solution emerged. This is quite likely due to the effect of three factors: the effect of averaging much more dispersed preferences by different LAs, the compensatory effect of the decision rule adopted, and the very broad categories of strategies analysed. Regarding the first two factors, they could be dealt with – and they would in the final phase of the project – by means of the capabilities of the mDSS software in terms of application of non compensatory decision rules, exploration of conflicts and group decision making procedures. Regarding the last factor, a new application of the same conceptual decision model is planned for the final phases of the project with focus on much a better defined set of concrete strategies to be identified within the preferred category of PLANNING measures.
5. Discussion and conclusions
The methodological framework applied in the Brahmatwinn project and reported above facilitated exchanges of experiences between the twinned river basins and between scientists of different disciplines and local actors (in particular local experts and representatives of local institutions). The two parallel participatory processes allowed to explore the visions and preferences of local actors regarding the sustainable management of water resources. Moreover, they contributed significantly to ensuring that the scientific knowledge and approaches provided by the research consortium could meet the perceptions and needs of local people and decision makers, who would ultimately be the end-users of the project’s outputs.
The participatory activities integrated to the scientific research led to structured and very effective discussions concerning adaptation responses for flooding in those areas, and allowed for the collection of a significant amount of insights and lessons, drawn from the experience with local actors’ involvement.
coordinated and combined series of participatory activities in the two geographical areas.
The participatory process carried out in this project, just like many similar efforts implemented within research project activities, should not be intended as public participation in strict sense,, because the activities were – at least to some extent – academic simulations of social processes, having as a consequence that the results must be considered only for their role of methodological demonstration. For this reason, crucial aspects of real world applications were not dealt with by the project, such as the statistically sound identification of representative local actors.
Having clarified this also with the participants involved since the beginning, these activities can still provide two very important opportunities: (1) testing and refining methods and tools to be applied in real world decision processes, and (2) disseminating information about scientific developments and the availability of methods and tools to potential users of the project results.
Indeed, as previously stated, there was no ambition to provide a sort of internal decision process for the project, and even more to provide outcomes with a sort of statistical significance for the two areas for various reasons like the fact that the processes of selection of actors were not carried out with the intention to identify “representative” stakeholders, the multi-criteria analyses were conducted with very simple decision rules, the potential conflicts between participants were not investigated in depth. Having clarified this, the interest of the case remains for the development and testing of innovative participatory approaches within research activities and on the exploitation of these activities, for establishing communications outside the research consortium, for collecting information, for having very valuable feedbacks, and for disseminating ongoing efforts, innovative methods, and results.
The experimental application of the NetSyMoD approach to the twinned river basins provided the Brahmatwinn project with an effective interface between the research activities, and potential beneficiaries, in the case studies located in Asia and Europe. In this case, the participative activities presented in this paper, and those that were carried out before, in the earlier phases of the project, allowed to maintain an open communication interface with communities of experts, policy makers, and bureaucrats,
allowing the project consortium to learn from local knowledge and orient research activities. They also provided a means to concretely put in place the twinning of the two river basins, shedding light on commonalities and distinct features.
Concerning the results of the two workshops reported above, the phases of climate change scenarios presentation and brainstorming showed to be very important, because they set the foundations for the DSS Design and permitted to set up the activities on a common and shared framework of understanding of each local river basin features. Those phases also contributed to raise awareness about climate change dynamics, and the state of the art of the available modelling approaches downscaled to the level of the two case studies.
The phase of DSS design carried out through the use of the mDSS software raised great interest among the participants, who were thus involved in the project activities, exposed to preliminary results and contributed to orient the final phases of the project. Several participants appreciated in particular the use of public domain software, which provided a perspective of possible re-use of the approach proposed in the local decision problems.
Acknowledgements
We would like to take this opportunity to acknowledge the work carried out by other colleagues at FEEM: Jacopo Crimi, Alessandra Sgobbi, Yaella Depietri, and also the contribution given by the BrahmaTWinn partners: Geoinformatik Department, Friedrich Schiller Univerity, Jena (Germany); Department for Geography, Ludwig Maximilians University, Munich (Germany); Institute for Atmospheric and Environmental Sciences, Goethe University Frankfurt (Germany); Z_GIS, University of Salzburg (Austria); GeoData Insitute, University of Spouthampton (UK); Centre for Water Law, Policy and Science, University of Dundee (UK); Department of Limnology and Hydrobotany, University of Vienna (Austria), Department of Geosciences, University of Oslo (Norway); ICIMOD, Kathmandu (Nepal), Royal University of Bhutan, Thimphu (Bhutan); Institute of Tibetan Plateau Research, Chinese Academy of Science, Beijing (China); Center for Agricultural Resource Research, Shijiazhuang (China); Indian Institute of Technology Roorkee, Roorkee (India).
Research funded by the European Community, SUSTDEV-2005-3.II.3.6: Twinning European/third countries river basins; Contract No. 036592 (GOCE).
References
Belton, Di Valerie, and Theodor J. Stewart. 2002. Multiple criteria decision analysis. Boston: Kluwer Academic Publishers.
De la Vega-Leinert, Anne, Dagmar Schröter, Rik Leemans, Uta Fritsch, and Jacomijn Pluimers. 2008. A stakeholder dialogue on European vulnerability. Regional Environmental Change 8, no. 3: 109-124.
EEA (European Environmental Agency). 1999. Environmental Indicators: Typology and Overview. Technical Report. Copenhagen: EEA.
European Commission. 2009. Towards a comprehensive climate change agreement in Copenhagen. Brussels: Communication from the Commission to the European Parliament, the Council, the European Economic and Social Committee and the Committee of the Regions.
Figueira, José, Salvatore Greco, and Matthias Ehrgott. 2005. Multiple criteria decision analysis: state of the art surveys. Vol. 57. Springer.
Figueira, José, and Bernard Roy. 2002. Determining the weights of criteria in the ELECTRE type methods with a revised Simos' procedure. European Journal of Operational Research 139, no. 2 (June 1): 317-326.
Geurts, Jac. L. A., and Cisca Joldersma. 2001. Methodology for participatory policy analysis. European Journal of Operational Research 128, no. 2 (January): 300-310.
Giupponi, Carlo. 2007. Decision Support Systems for implementing the European Water Framework Directive: The MULINO approach. Environmental Modelling & Software 22, no. 2 (February): 248-258.
Giupponi, Carlo, Alessandra Sgobbi, Jaroslav Mysiak, Roberta Camera, and Anita Fassio. 2008. NetSyMoD - An Integrated Approach for Water Resources Management. In Integrated Water Management, 80:69-93. Patrick Meire, Marleen Coenen, Claudio Lombardo, Michela Robba and Roberto Sacile. IV: Earth and Environmental Sciences. Springer Netherlands.
Heltberg, Rasmus, Paul Bennett Siegel, and Steen Lau Jorgensen. 2009. Addressing human vulnerability to climate change: Toward a ‘no-regrets’ approach. Global Environmental Change 19, no. 1 (February): 89-99.
IPCC. 2000. Special Report on Emissions Scenarios: a special report of Working Group III of the Intergovernmental Panel on Climate Change. Cambridge University Press, UK: IPCC.
IPCC. 2005. Guidance Notes for the lead authors of IPCC 4th Assessment Report on Addressing Uncertainties. IPCC.
IPCC. 2007. Climate Change 2007: Synthesis Report. Contribution of Working Groups I, II and III to the Fourth Assessment Report of the Intergovernmental Panel on Climate Change. Geneva, Switzerland: IPCC.
Irvin, Renée A., and John Stansbury. 2004. Citizen Participation in Decision Making: Is It Worth the Effort? Public Administration Review 64, no. 1: 55-65.
Mace, M.J. 2005. Funding for Adaptation to Climate Change: UNFCCC and GEF Developments since COP-7. Review of European Community & International Environmental Law 14, no. 3: 225-246.
Messerli, Bruno, Daniel Viviroli, and Rolf Weingartner. 2004. Mountains of the World: Vulnerable Water Towers for the 21st Century. Ambio (November): 29-34. Mysiak, Jaroslav, Carlo Giupponi, and Paolo Rosato. 2005. Towards the development
of a decision support system for water resource management. Environmental Modelling & Software 20, no. 2 (February): 203-214.
Nogués-Bravo, D., M.B. Araújo, M.P. Errea, and J.P. Martínez-Rica. 2007. Exposure of global mountain systems to climate warming during the 21st Century. Global Environmental Change 17, no. 3-4 (October): 420-428.
Renn, Ortwin. 2006. Participatory processes for designing environmental policies. Land Use Policy 23, no. 1 (January): 34-43.
Schipper, E. Lisa F. 2006. Conceptual History of Adaptation in the UNFCCC Process. Review of European Community & International Environmental Law 15, no. 1: 82-92.
Sgobbi, Alessandra, and Carlo Giupponi. 2007. Models and decision support systems for participatory decision making in integrated water resource management. In Water saving in Mediterranean agriculture and future research needs, II:259-271. CIHEAM-IAMB. Options Méditerranéennes: Série B. Etudes et Recherches 56. Bari.
Simos, J. 1990. L’évaluation environnementale: Un processus cognitif négocié. DGF-EPFL, Lausanne.
Stewart, Iris T. 2009. Changes in snowpack and snowmelt runoff for key mountain regions. Hydrological Processes 23, no. 1: 78-94.
Viviroli, D., and R. Weingartner. 1999. The hydrological significance of mountains: from regional to global scale. Hydrol. Earth Syst. Sci. 8, no. 6 (November 30): 1017-1030.
Viviroli, Daniel, Hans H. Dürr, Bruno Messerli, Michel Meybeck, and Rolf Weingartner. 2007. Mountains of the world, water towers for humanity: Typology, mapping, and global significance. Water Resour. Res. 43 (July 28).