Multistage Classification for Bacterial Colonies
Recognition on Solid Agar Images
Alessandro Ferrari
∗†, Alberto Signoroni
∗∗University of Brescia, Brescia, Italy,†Copan Italia, Brescia, Italy
[email protected], [email protected]
Abstract—The advent of laboratory automation in clinical microbiology is entailing a revolution in the way most common bacteriological clinical exams are accomplished. As an essential part of these systems, digital recording and processing of cultured bacteria images is expected to improve plate reading, with a key role of image analysis tools in guaranteeing cost-effectiveness, accuracy, flexibility and reliability of the clinical tasks. In this work, we propose an image analysis system capable to address the complex problem of different bacteria species identification on cultured agar plates. Our solution is based on a modular segmentation/classification pipeline where a chain of supervised classification stages provides solutions to a series of nested task issues, from foreground separation toward isolated colony detection and classification. Performance assessment, based on an experimental dataset obtained in standardized laboratory condi-tions, clearly demonstrates the feasibility and the potentiality of the proposed solution and favorably opens to generalizations as well as to clinical validation studies.
I. INTRODUCTION A. Microbiology background
Bacteria culturing on solid agar plates (Petri dishes) is a fundamental process in microbiology, which is widespread for clinical laboratory exams, environmental control, food and beverage safety assessment. The culturing process starts by inoculating the specimen to be examined on the agar, thus a solution of the specimen is spread over the agar surface. After inoculation, bacterial cultures are incubated for reproducing optimum conditions for human pathogens bacteria growth. Vi-able bacteria starts to reproduce, generating bacterial colonies, within an incubation time that can range from several hours to few days. There are different types of solid agar, composed by different compounds. Their recipe determines their behaviour, that may help, differentiate, select or inhibits the growth of certain bacterial species. Solid agar choice is taken according to diagnostic needs. By looking at the morphology and appear-ance of the formed colonies, the trained specialist may infer presumptive pathogens identification. While establishing the presence of an infectious disease in the patient, the evaluation of which (if any) pathogens are grown, their bacterial load and their pathogenicity are crucial. The clinicians usually perform a visual screening of massive amounts of cultured plates, e.g. the ones prepared in a laboratory workday, discarding plates that do not require further attention, while disposing further analyses for those that may be critical or that require more accurate identification, usually starting from material directly picked up from isolated cultured colonies.
The recent introduction of laboratory automation systems is affecting traditional practices in clinical microbiology in
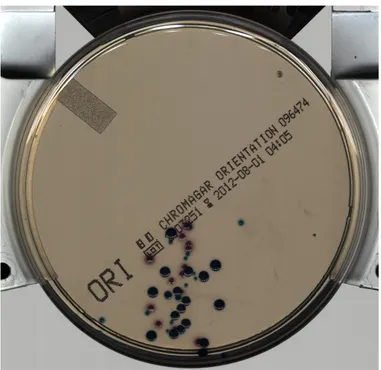
Fig. 1: Chromagar solid agar plate
two different ways [1]. From one hand, lab automation sys-tems dramatically reduce the manual fatiguing overburden of specimen handling during the pre-analytical phases (sample preparation, processing and incubation), nonetheless leading to an increased reliability and reproducibility of the whole sample management process, thanks to standardized working conditions. The second drastic change concerns the digitaliza-tion of the cultures, that are not anymore held by the hands of the microbiologists, but instead they are visualized as high-resolution images (see Fig.1).
B. Motivation
Bacterial strains differentiation is an important step in the diagnostic decision making. For easing differentiation among colonies growth in the same culture, agar manufacturers de-velop differential agars which contain chemical compounds that modify the appearance of colonies depending on certain phenotypical features of selected bacterial species. Despite this, the task of species or strains (sub-groups within the species) differentiation remains error prone. Image analysis may increase reliability of this task, also spotting differences on small colonies that the human eye may miss. More in general, digital images in lab automation systems open new
research opportunities toward developing automatic solutions, oriented to assist and support the (pre)diagnostic processes. From these new perspectives, the possibility for the image analysis tools to suggest clinicians to examine first the samples that are more likely to be critical, can considerably antici-pate patients treatment or other critical decisions, especially whether massive amounts of cultured plates are processed daily. This is a main motivation in developing an automated image classification system targeted to the recognition and identification of different bacteria species, as the one described in this work. An automated presumptive recognition and identification of different bacteria species is also important for disposing further analysis on suspicious colonies, such as Antibiotic Susceptibility Tests or species identification with Maldi ToF mass spectrometry, to name a few.
C. Related Works
Up to now, the majority of HW/SW imaging solutions re-lated to bacteria colony growth have been focused on providing automated colony counting features, especially for application fields relying on exact (quantitative) and fast bacterial load esti-mation, such as food and beverage safety [2],[3],[4] or various environmental control and specific clinical usages [5],[6],[7]. Clinical bacteriology usually requires qualitative bacterial load estimation even in cases where massively confluent colonies growth occurs and traditional bacterial enumeration systems would fail. After grown bacteria segmentation, a segment may contain an isolated colony or a cluster of confluent colonies, and it may be really tricky or impossible to split clumps in certain clusters. In [8] different colony segmentation methods have been compared. In [9] complex shape recognition has been addressed for colony detection. In [7] a neural network approach to estimate the number of colonies included in confluent growth segments is proposed.
When one or different bacterial species or even strains are grown on the same agar plate, it is necessary to identify and distinguish among them before to proceed to their enumer-ation. This justifies the need of combined segmentation and classification strategies that should be capable to adapt and provide solutions for a possibly variegated range of domain requisites. Despite this fact, reference papers on bacteria image classification are more sporadic and are usually related to specific clinical application (e.g. phage typing [10]) or dedicated image acquisition setups (e.g. forward scattering [11] or Raman spectroscopy [12]). To our knowledge the first work entailing a complete segmentation, enumeration and classification pipeline has been proposed in [13], where quite general results have been obtained in an interactive way, where users assist the selection of suitable algorithms and their parametrization. Achromatic (without color features) agar images are segmented using automatic thresholding algorithm, while agar images with a lot of colors are segmented with a region growing approach. After background and foreground segmentation, undesired segments are discarded by means of Kolmogorov-Smirnov null hypothesis test. Then, the user indicates a small set of samples for each bacterial colonies type present on the agar, the system will assign a category to the others unlabeled colonies according to the model learnt from the supervised labeled data set by means of simple features such as segment size and segment circularity. After colonies classification, colony counting is performed by means
of segments enumeration.
We expect that the transition to digitally recorded petri dishes in microbiology lab automation systems will foster research efforts to find new and effective solutions for machine-assisted bacteria identification and quantification, and the present work wants to be a step in this direction.
D. Contribution
The large amount of variables involved in bacterial cul-turing, such as the broad possible types of bacteria in the specimen, bacterial load in the specimen, the agar specific be-haviour, the streaking pattern used for inoculating, incubation temperature and time, and so on, leads to incredibly variegated range of possible outcomes. While, from an image analysis point of view, it is clear that to obtain bacteria identification results it is necessary to exploit the feature expressed by the bacterial colony, particular attention must be taken in determining the requirements of the specific problems to solve, in order to not incur in ill posed questions or unspecific results generation. In this work, we concentrate on one of the most common and widespread laboratory test performed worldwide: presumptive identification of the most common Urine Tract Infection (UTI) pathogens growth on differential CHROMagar Petri dishes. CHROMagar plates select and differentiate colony appearance of the seven most common UTI pathogens, allow-ing lab technicians to presumptively identify them by sight. An automated image analysis solution of this problem has not yet been approached in literature and, as can be imagined, there are several issues to be solved in order to reach an automated presumptive identification of bacterial species from images like the one in Fig.1. The structure of the proposed solution is exemplified in Fig.2, which also represents the general architecture of the proposed image analysis solution (here specialized and tested for the URI recognition task, but also worthy of consideration to guide the processing of images from other kind of tasks). Since bacteria identification is meaningful only on isolated colonies, confluent ones have to be filtered out for identification. Isolated colonies have to be selected from other image components, that may artifacts or dust, which could be potentially confused with grown bac-teria. In our scheme different supervised classification stages provide solutions to the above nested set of tasks toward isolated colony identification and classification for the main UTI pathogens.
II. PROPOSED METHOD
As anticipated, the proposed and tested processing chain, represented in Fig.2, has been designed to provide scalability and flexibility with respect to a wide class of problems and it will be specialized to the detection and identification of the main UTI pathogen which grows on CHROMagar plates. The modules composing the architecture are:
• Denoising: the noise which possibly affects the
ac-quired images is handled with a classical Wiener filtering approach [14], [15], which acts optimally (in a mean squared error sense) on gaussian noise, while affecting minimally the target structures;
• Segmentation: this module, described in Sec.II-A,
D enoi si ng S egm ent at ion S egm ent s fi lt eri ng Is ol at ed c ol ony de te ct . Ba ct eri a ide nt ifi ca ti on
Fig. 2: Architecture of the system. The system is composed by a cascade of modules. The last three modules perform a segments classification and together they represent the multi-stage classifier. The first two stages have the same training set, while the third stage has a reduced one.
Cbias Cbias (a) (b) 1! 0! 1! 0!
Fig. 3: Local thresholding applied on an object (a) and applied on pure background (b). In blue the original signal, in orange the filtered one, in green the segmentation result. The pictures evidence the role of the Cbias shift (red lines).
the aim to extract image components comprising bac-teria colonies but also writings, impurities, scratches and other non interesting elements on the agar to be detected and eliminated in the subsequent phases;
• Colony Image Classification: a cascaded series of
three classification steps is able to provide the desired bacteria identification starting from the foreground segmentation result:
1) Segments Filtering: this module (described
in Sec.II-B) implements a classification that discards all the segments that do not contain bacterial growth;
2) Isolated Colony Detection: this classification
module (described Sec.II-C) implements the detection of isolated colonies;
3) Colony Classification: this module (described
in Sec.II-D) produces the final bacteria clas-sification.
For all the above classification steps we adopted Sup-port Vector Machines (SVM) with Radial Basis Func-tion (RBF) kernels [17],[18]. For each step different features have been extracted (as will be specified), and this is followed by feature reduction (with Principal Component Analysis) and feature scaling steps.
A. Image segmentation
Similarly to what proposed in [6] we adopted the adaptive thresholding foreground detection technique described in [16] where, for each pixel I(x, y), a different threshold is selected according to the intensity values in its local neighborhood. A binary segmentation result is obtained according to the following steps (also depicted in Fig.3):
Fig. 4: Image segmentation results. Together with colonies also written and dust are segmented.
• 1) compute A(x, y) = hσ(x, y)?I(x, y) with hσ(x, y)
the averaging kernel of radius σ. In our case, σ has to be bigger than the biggest colony, but small enough to ensure that the neighborhood is not affected by the lighting patterns;
• 2) subtract the original from the convolved image,
D(x, y) = I(x, y) − A(x, y) and obtain a binary thresholded image T (x, y) = sgn[(D(x, y) + Cbias], where the bias term Cbias has to be big enough for avoiding to consider the agar as foreground, while small enough to consider all the colonies as fore-ground.
An example of a typical segmentation result is shown in Fig.4. The red lines around the segments clearly show that, although very simple, the described segmentation tool is effective in
separating foreground material from the background agar1.
B. Classification-based segment filtering
After the segmentation step, segments may contain isolate colonies but also fragments of colonies, cluster of
homo-1The representative case of urine derived specimens cultured on selective
CHROMagar plates and acquired in a backlight setup considered in our experiments produces images where the transparent agar can be assumed brighter than the colonies (and however where many additional problems such as writings and dirt come up evidenced). Despite this can lead to some simplification in the selection of the processing tools, this should not be considered restrictive because generalizations are not difficult to conceive in case similar assumptions cannot be made.
geneous or heterogeneous colonies, writings (especially for transparent agars), dirt and scratches on the agar surface. A first problem is therefore to distinguish what is interesting for us from what is not related to the bacterial growth. This has been addressed within a first binary classification stage, where the objective is to keep only segments related to bacterial growth. The features extracted from each segment that have been considered for learning, along with their rationale, are listed in the following: segment area (this may be a discriminative element between small artifacts and colonies, in general dust is way smaller than a colony); segment area / filled segment area ratio (it may be useful in order to discriminate written, since some of the written segments present cavities); compactness and solidity (they may be useful since, in general, segments that contain colonies tend to be more regular than artifacts or undesired segments); mean, median and standard deviation of pixel intensities of the segment in the Luv colorspace channels (these are useful since undesired segments tend to be dark and uniform, such as written or black scratches on the agar surface, while colonies present gradations of color). The Luv colorspace has been adopted since it encodes differences between colors closely to human perception.
C. Classification-based isolated colonies detection
Reliable presumptive colonies identification can be per-formed only on isolated colonies. In fact, confluent colonies have a really unpredictable morphology that can make bac-teria classification not meaningful. In addition, only isolated colonies can be considered for further analytical phases in-volving samples derived by means of colony picking. Thus, a second binary classification module is committed to select, within the segments selected at the first stage, the ones that contains isolated colonies. All training features used at the first stage have been adopted. Among them, the standard deviation of the different Luv channels pixels intensity is expected to play an important role, since isolated colonies tend to have smaller variance than clusters of colonies. The compactness is relevant as well, since isolated colonies are nearly circular. In addition, the magnitude of the Zernike moments [19],[20],[21] up to the 12th order have been computed on the binarised segments in order to foster the recognition of circular-like shaped segments. To guarantee the desirable shift and scale invariance of the Zernike moments, the centroid of the segment is always centered in the middle of a 100x100 pixels image, while the segments area are normalized to a constant value. Moreover, despite it would seem more natural to base the training of this second stage solely on the segments issued from the first one, it is instead convenient to use for that purpose the same segments set used for the first stage. This way we take advantage of the possibility to boost the performance of the first two stage of our cascaded classifier, for example by possibly intercepting false positives from the first stage. The benefits of this opportunity have been experimentally verified, so that the above training strategy has been adopted.
D. Classification-based bacteria identification
For the final bacterial identification task a one-against-all classification scheme has been adopted. Compared to the previous ones, this last stage can count on a smaller number of available samples, so the choice of the right set of features
(a) (b)
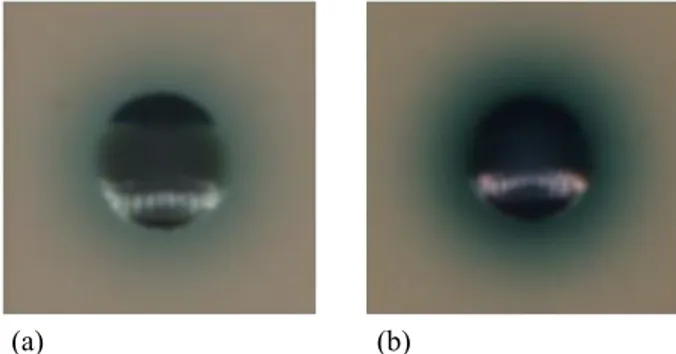
Fig. 5: Example of colonies presenting similar pigmentation:
Streptococcus agalactiae (a) and Enterococcus faecalis (b).
is even more critical for obtaining good classification results. Note that despite the CHROMagar agar provides substrates to differentiate bacteria that release differently colored com-pounds upon degradation of certain species for the detection of certain groups of organisms, not always it is possible to clearly distinguish different bacteria visually nor even by a simple color segmentation approach (see Fig.5). For the above reasons we considered and tested three different possible feature set selections. The first set (hue oriented) of selected features is composed by: segment area, mean, median and standard
deviation of the pixel intensities of the segments for each Luv
channel. This set lacks of features able to characterize the morphology of the colony and how the encoded information is spatially distributed. The second set (shape oriented) of features comprises the magnitude of the Zernike moments, up to the 20th order, of the intensity profile of the colony pixels for each channel of the Luv colorspace. They consists in 121 features for each channel (363 in total). The third considered set was composed by the union of the first two.
III. RESULTS
A total of six between the most clinically relevant bac-terial species have been considered: Enterococcus faecalis, Escherichia coli, Klebsiella, Proteus mirabilis, Staphylococcus aureus, Streptococcus agalactiae. The system has been tested
on CHROMagarTMorientation (BD Diagnostics) solid agars, a
category of chromogenic differential agar specialized in the differentiation of certain pathogens of the urinary tract. Solid agar images are acquired with a high resolution color linear camera with 16 mega-pixels resolution, a telecentric objective
and a bar lighter, installed in the WASPLabTMautomation
system (Copan Italia S.p.A.). For each bacterial class two solid agar plates have been inoculated (without mixed flora). Moreover, 5 different combinations of multiple bacterial types have been inoculated to two solid agar each. In total, twenty-two images of solid agar plates have been analyzed for this experiment. From these images, a total of 74 isolated bacterial colonies have been identified. Hypothesis evaluation has been done by splitting the dataset in a training set (60% of the samples), a cross-validation set that has been used for model selection (20% of the samples) and a validation set that has been used to measure the classifier generalization performances (20% of the samples). For each classification stage, in order to improve the dependability of the perfor-mance assessment, twenty dataset partitions rearrangements
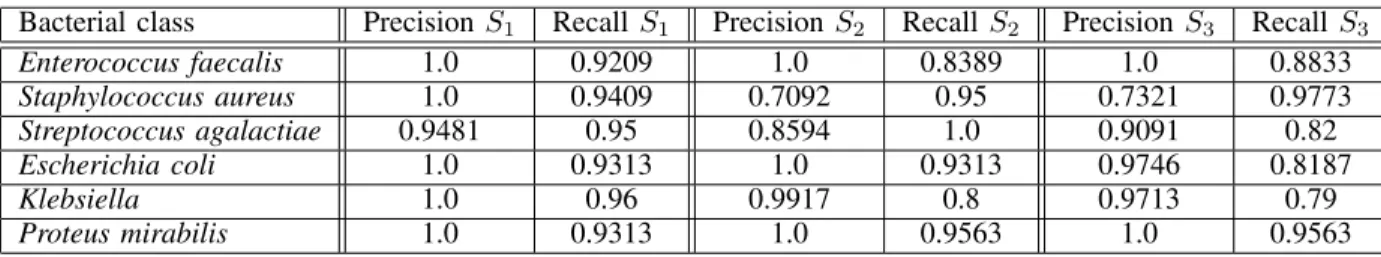
TABLE I: Bacterial colonies classification results using statistical (Set 1), Zernike (Set 2) and combined (Set 3) moment features.
Bacterial class Precision S1 Recall S1 Precision S2 Recall S2 Precision S3 Recall S3
Enterococcus faecalis 1.0 0.9209 1.0 0.8389 1.0 0.8833 Staphylococcus aureus 1.0 0.9409 0.7092 0.95 0.7321 0.9773 Streptococcus agalactiae 0.9481 0.95 0.8594 1.0 0.9091 0.82 Escherichia coli 1.0 0.9313 1.0 0.9313 0.9746 0.8187 Klebsiella 1.0 0.96 0.9917 0.8 0.9713 0.79 Proteus mirabilis 1.0 0.9313 1.0 0.9563 1.0 0.9563
has been performed and an average of the obtained results have been taken as performance metric. In order to diagnose a possible presence of overfitting or underfitting, learning curves have been analyzed for the obtained hypothesis [22]. A GUI software has been realized to perform supervised labeling of segments for each classification step.
A. Segmentation
The role of segmentation is not to loose growth material. Although apparently simple (due to the uniformity of the agar) this task has to face with the high variability of the contrast and the characteristics of colonies belonging to different species. Then, we had to find a compromise between capturing finer details of low contrasted colonies and reducing shading halos for more contrasted colonies. Best results were obtained with Cbias = 200. Since a quantitative evaluation at this stage would risk to have an uncertain significance, a qualitative though careful assessment of the segmentation results (well represented by the example of Fig.4) has been performed by observing the segments obtained for each different bacterial species. This evidenced that the system is adequate to the expected foreground extraction, i.e. to feed the following classification steps toward the detection of isolated colonies. B. Segments filtering
The obtained foreground segments are randomly distributed in the training, cross-validation and validation sets which re-sulted to be composed by 2913, 731 and 730 segments respec-tively. Since only 17.53% of samples are positive, precision and recall (PR) measures have been adopted (typically choice in presence of skewed classes) as informative parameters for classification performance assessment . The average obtained precision is 89.61%, while the average recall is 95.31%. The analysis of the learning curves showed that the features extracted from the segments are sufficiently discriminative (almost no training error). However, a 3% valued minimum gap majority measured between cross-validation and training learning curves evidenced an overfitting tendency for this classification stage.
C. Isolated Colonies Detection
As explained in Sec.II-C, the sample set used for training in this stage is the same used in the first one. The positive samples are the 10.12%. Thus, also in this case PR metrics have been adopted. The average precision obtained in segments classification from the different partitions is the 93.02%, while the average recall is the 92.09%. By analyzing the obtained learning curves, as in the previous classification stage, the training error is almost null, while the cross-validation error
has a minimum that attains the 1%. The overfitting is less than in the previous case (this stage concentrates on a smaller set of positives).
D. Bacteria Classification
The number of isolated colonies produced by the previ-ous stages, which determine the colony dataset for the last classification stage, is 270 (164 in the training set and 54 for both the cross-validation and the validation sets) distributed in the following proportion: 16.67% are Enterococcus faecalis, 20.37% are Staphylococcus aureus, 18.52% are Streptococcus agalactiae, 14.81% are Escherichia coli, 9.86% are Klebsiella and 14.81% are Proteus mirabilis. Table I shows the last stage classification performance for the different considered
set of features (S1: hue oriented statistical moments, S2: shape
oriented Zernike moments, S3: S1∪ S2). The training of the
different classifiers have been debugged by means of learning
curves. The training exploiting S1 features set has produced
satisfactory results, producing a training error and a cross-validation gap between the 0.1% and 4%. Learning curves
of the classifier with features set S2 have evidenced worse
performances, with a gap oscillating between the 0.3% for the best case and 13% for the worst case. The classifier with
features set S1∪ S2 have shown slightly worse performances
with respect the second set.
E. Discussion
The system is composed by a series of modules in a cascade, so its effectiveness relies on the behavior obtained by each module. The first assumption is about the presence of iso-lated colonies. In a solid agar where all the grown colonies are confluent with others, the system will not work. However, this does not constitute a problem because also diagnostic clinical protocols require isolated colonies for presumptive diagnosis or for colony picking to further analysis. The first segmentation step turned out to be adequate for the extraction of material growth on plates. Of course, a more sophisticated segmentation technique could be devised for an improved colony isolation in cluttered situations, in order to attain possibly more favorable balance between segmentation and classification work. We left this for future investigation. In the common scenario we observed that a sufficient number of isolated colonies is segmented, and the multi-stage classification offers reliable performances. The first 2 steps have a really high recall, which is a warranty that almost all the isolated colonies reach the last classification stage. The last stage offers satisfactory classification performances. The observed overfitting can be addressed in prospect by collecting more samples.
IV. CONCLUSION
Clinical microbiology is a wide, varied and complex field of investigation. The foreseeable diffusion of microbiology laboratory automation systems and the consequent massive image digitalization is expected to entail, on the one hand, new paradigms for clinical investigation and diagnosis and, on the other hand, new image analysis challenges and tasks. What we proposed in this work is a first attempt to tackle the main challenges that arise by addressing the problem of different bacterial species identification. We considered one of the most representative and widespread clinical scenarios where automatic identification can be useful for example to assist presumptive diagnosis or to automatically produce a prioritized clinical reading schedule. The proposed multi-stage classification formulation proved its ability of skimming isolated colonies off of a complex, varied and cluttered ini-tial situation and demonstrated fully satisfactory classification results on a well representative set of pathogens for urinary infections. Thanks to its modular architecture, the proposed system can be considered as a proof of concept for a wider related class of problems, being it open to improvements and specializations according to requirements coming from different clinical scenarios.
REFERENCES
[1] P. P. Bourbeau and N. A. Ledeboer, “Automation in clinical microbiol-ogy,” Journal of clinical microbiology, vol. 51, no. 6, pp. 1658–1665, 2013.
[2] D. P. Mukherjee, A. Pal, S. E. Sarma, and D. D. Majumder, “Bacterial colony counting using distance transform,” International Journal of Bio-Medical Computing, vol. 38, no. 2, pp. 131 – 140, 1995. [3] H. Ogawa, S. Nasu, M. Takeshige, H. Funabashi, M. Saito, and
H. Matsuoka, “Noise-free accurate count of microbial colonies by time-lapse shadow image analysis,” Journal of Microbiological Methods, vol. 91, no. 3, pp. 420 – 428, 2012.
[4] J. Marotz, C. L¨ubbert, and W. Eisenbeiss, “Effective object recognition for automated counting of colonies in petri dishes (automated colony counting),” Computer Methods and Programs in Biomedicine, vol. 66, no. 23, pp. 183 – 198, 2001.
[5] M. L. Clarke, R. L. Burton, A. N. Hill, M. Litorja, M. H. Nahm, and J. Hwang, “Low-cost, high-throughput, automated counting of bacterial colonies,” Cytometry Part A, vol. 77, no. 8, pp. 790–797, 2010. [6] S. D. Brugger, C. Baumberger, M. Jost, W. Jenni, U. Brugger, and
K. M¨uhlemann, “Automated counting of bacterial colony forming units on agar plates,” PLoS ONE, vol. 7, no. 3, pp. e33695, 2012. [7] G. L. Masala, U. Bottigli, A. Brunetti, M. Carpinelli, N. Diaz, P.L. Fiori,
B. Golosio, P. Oliva, and G.Stegel, “Automatic cell colony counting by region-growing approach,” Il Nuovo Cimento C, , no. 6, 2007. [8] W. Wang, “Colony image acquisition system and segmentation
algo-rithms,” Optical Engineering, vol. 50, no. 12, pp. 123001–123001–9, 2011.
[9] C. Teutsch, D. Berndt, E. Trostmann, and M. Weber, “Real-time detection of elliptic shapes for automated object recognition and object tracking,” in Machine Vision Applications in Industrial Inspection XIV, 2006, vol. Proc. SPIE 6070, pp. 0J1–9.
[10] S. Trattner, H. Greenspan, G. Tepper, and S. Abboud, “Automatic identification of bacterial types using statistical imaging methods,” Medical Imaging, IEEE Transactions on, vol. 23, no. 7, pp. 807–820, July 2004.
[11] W. M. Ahmed, B. Bayraktar, A. K. Bhunia, E. D. Hirleman, J. P. Robinson, and B. Rajwa, “Classification of bacterial contamination using image processing and distributed computing,” Biomedical and Health Informatics, IEEE Journal of, vol. 17, no. 1, pp. 232–239, Jan 2013.
[12] E. K. Kastanos, A. Kyriakides, K. Hadjigeorgiou, and C. Pitris, “A novel method for urinary tract infection diagnosis and antibiogram using raman spectroscopy,” Journal of Raman Spectroscopy, vol. 41, no. 9, pp. 958–963, 2010.
[13] W.-B. Chen and C. Zhang, “An automated bacterial colony counting and classification system,” Information Systems Frontiers, vol. 11, no. 4, pp. 349–368, 2009.
[14] N. Wiener, Extrapolation, interpolation, and smoothing of stationary time series: with engineering applications, MIT Press, 1949. [15] J. S. Lim, Two-dimensional signal and image processing, Prentice Hall,
Englewood Cliffs, NJ, 1990.
[16] R. Fisher, S. Perkins, A. Walker, and E. Wolfart, Hypermedia image processing reference, Wiley, 1996.
[17] V. Vapnik, Ed., Statistical learning theory, Wiley, 1998.
[18] B. Scholkopf, C.J.C Burges, and A.J. Smola, Eds., Advances in kernel methods - support vector learning, MIT Press, 1998.
[19] A. Khotanzad and Y. H. Hong, “Invariant image recognition by zernike moments,” Pattern Analysis and Machine Intelligence, IEEE Transactions on, vol. 12, no. 5, pp. 489–497, May 1990.
[20] S.X. Liao and M. Pawlak, “On the accuracy of zernike moments for image analysis,” Pattern Analysis and Machine Intelligence, IEEE Transactions on, vol. 20, no. 12, pp. 1358–1364, Dec 1998.
[21] W.-Y. Kim and Y.-S. Kim, “A region-based shape descriptor using zernike moments,” Signal Processing: Image Communication, vol. 16, no. 12, pp. 95 – 102, 2000.
[22] C. M. Bishop, Pattern recognition and machine learning, Springer, 2006.