Behavioral/Systems/Cognitive
Modulation of Gamma and Theta Spectral Amplitude and
Phase Synchronization Is Associated with the Development
of Visuo-Motor Learning
Bernardo Perfetti,
1Clara Moisello,
1Eric Carl Landsness,
2Svetlana Kvint,
1Simona Lanzafame,
1,3Marco Onofrj,
4Alessandro Di Rocco,
5Giulio Tononi,
2and M. Felice Ghilardi
11Department of Physiology and Pharmacology, City University of New York Medical School, New York, New York 10031,2Department of Psychiatry,
University of Wisconsin, Madison, Wisconsin 53719,3Department of Matter Physics and Electronic Engineering, University of Messina, I-98155 Messina,
Italy,4Department of Neuroscience and Imaging, University of Chieti-Pescara, I-65127 Chieti, Italy, and5Department of Neurology, Division of Movement
Disorders, New York University School of Medicine, New York, New York 10016
The formation of new motor memories, which is fundamental for efficient performance during adaptation to a visuo-motor rotation, occurs when accurate planning is achieved mostly with feedforward mechanisms. The dynamics of brain activity underlying the switch from feedback to feedforward control is still matter of debate. Based on the results of studies in declarative learning, it is likely that phase synchronization of low and high frequencies as well as their temporal modulation in power amplitude underlie the formation of new motor memories during visuo-motor adaptation. High-density EEG (256 electrodes) was recorded in 17 normal human subjects during adaptation to a visuo-motor rotation of 60° in four incremental steps of 15°. We found that initial learning is associated with enhancement of gamma power in a right parietal region during movement execution as well as gamma/theta phase coherence during movement planning. Late stages of learning are instead accompanied by an increase of theta power over that same right parietal region during movement planning, which is correlated with the degree of learning and retention. Altogether, these results suggest that the formation of new motor memories and, thus, the switch from feedback to feedforward control is associated with the modulation of gamma and theta spectral activities, with respect to their amplitude and phase, during movement planning and execution. Specifically, we propose that gamma/theta phase coupling plays a pivotal role in the integration of a new representation into motor memories.
Introduction
Accuracy of rapid reaching movements mostly relies on the pre-cision of the motor plan, which, in turn, is based on motor mem-ories, or internal models. Such memories can be formed, updated, and retrieved during motor learning with the coopera-tion of feedback and feedforward mechanisms. Initially, in the learning of a new visuo-motor transformation, the original mo-tor plan is inadequate for the new situation and must be corrected during its execution, a feedback-type mechanism. With practice, information about errors are integrated in the motor plan—a feedforward process—and the resulting trajectories do not need
additional online correction. Motor adaptation is successful when new visuo-motor relationships are formed and internal models are created or updated (Kawato, 1999).
Despite a plethora of studies showing that visuo-motor adap-tation to a rotated display involves activity of posterior parietal, premotor, and frontal regions (Ghilardi et al., 2000; Inoue et al., 2000; Contreras-Vidal and Kerick, 2004; Huber et al., 2004; Krakauer et al., 2004; Anguera et al., 2009; Gentili et al., 2011), cerebellum (Imamizu et al., 2000), and basal ganglia (Graydon et al., 2005), the neural mechanisms underlying the changes in movement planning and execution during adaptation have not been defined. It has been suggested that adaptation may result from synaptic changes in posterior parietal and frontal areas (Huber et al., 2004; Gentili et al., 2011); however, direct evidence for such synaptic changes or their dynamics is rather sparse.
Recent studies on declarative working memory with EEG, which was used to study functional coupling of neural popula-tions and the temporal dynamics of sensorimotor and cognitive processes, suggest that both low- and high-frequency oscillations are important in sharpening existing memories and in forming new ones (Herrmann et al., 2010; Sauseng et al., 2010). In partic-ular, phase coupling between regions and frequency bands would promote memory formation and neural communications (Lis-man, 2010; Fell and Axmacher, 2011), whereas theta oscillatory activity would be crucial for memory maintenance and
utiliza-Received March 15, 2011; revised Aug. 17, 2011; accepted Aug. 23, 2011.
Author contributions: B.P., C.M., G.T., and M.F.G. designed research; B.P., C.M., E.C.L., S.K., and S.L. performed research; B.P., C.M., E.C.L., S.K., S.L., and M.F.G. analyzed data; B.P., M.O., A.D.R., G.T., and M.F.G. wrote the paper. This work was supported by grants from the McDonnell Foundation to (M.F.G. and G.T.), National Parkinson Foundation (M.F.G.), and Rudin Fellowship (S.K.) and by the National Institutes of Health Grants NS-054864 (M.F.G.), NS-055185 (G.T.), and P20MH-077967 (G.T.). B.P. thanks Fiscellus Mons for the kind and precious support to the study. We thank ETT s.r.l. (Electronic Technology Team, Genova, Italy) for providing the software for the behavioral data collection and analysis. We also thank Dr. M. X. Cohen for sharing the code used in the cross-frequency phase coherence analysis.
The authors declare no competing financial interests.
Correspondence should be addressed to M. Felice Ghilardi, Department of Physiology and Pharmacology, City University of New York Medical School, 138th Street and Convent Avenue, New York, NY 10031. E-mail: [email protected].
DOI:10.1523/JNEUROSCI.1319-11.2011
tion (Sauseng et al., 2010). Therefore, phase synchronization might well underlie the formation of new internal models also during visuo-motor adaptation. In addition, because theta activ-ity has been associated with motor performance enhancement (Caplan et al., 2003; Tombini et al., 2009; Gentili et al., 2011; Perfetti et al., 2011), we hypothesize that motor memory forma-tion is linked to the emergence of theta oscillaforma-tions during motor planning in specific brain areas. The present study investigates the changes in high-density EEG (hd-EEG) during a task in which subjects are exposed to small stepwise rotation increments and adaptation is achieved implicitly, without awareness (Ghilardi et al., 2000; Huber et al., 2004). We found that the shift from feed-back to feedforward mechanisms during adaptation is associated with enhancement of gamma power and gamma/theta coherence in right parietal areas. Specifically, in the right parietal areas, enhanced gamma power occurs during movement execution in the early adaptation phases and is followed by, later on, an in-crease of theta activity during movement planning.
Materials and Methods
SubjectsSeventeen subjects (mean 6 SD age, 21.2 6 1.4 years; 14 men) partici-pated in the study. All subjects were naive to the aims of the experiments. They were all right handed as determined by the Edinburgh inventory (Oldfield, 1971), had normal or corrected vision, and no history of neu-rological or psychiatric disorders. The experiments were conducted with the approval of the Institutional Review Boards of the participating in-stitutions, and all participants signed a written informed consent form. Experimental setup and motor tasks
Subjects were seated in front of a computer screen and moved a cursor on a digitizing tablet with their right hand. An opaque panel placed at shoul-der level prevented the view of the hand and forearm at all times. Subjects were outfitted with a 256-electrode cap, and hd-EEG data were collected for the entire duration of the experiment. They performed two motor
tasks that have been described in details previ-ously (Ghilardi et al., 2000; Huber et al., 2004; Perfetti et al., 2010, 2011). Briefly, participants were required to perform straight out and back movements from a central starting point to one of eight radially arrayed targets (distance, 4.0 cm), which were presented at 1.5 s intervals in an unpredictable order. Instructions were to respond as soon as possible and to move as fast and as accurately as possible, to avoid correc-tions, and to reverse sharply within the target circle.
In the baseline motor task, RAN, the direction of the cursor on the screen, corresponded to that of the movement on the tablet. In the motor learning task, ROT, unbeknownst to the subjects, the direction of the cursor on the screen was ro-tated relative to the direction of the hand by 60° in four incremental steps of 15° each (Huber et al., 2004). In both tasks, targets were presented in “runs” of 88 movements, each with a total run duration of 132 s. After familiarization with the apparatus, subjects performed two runs of RAN and 12 of ROT (three for each 15° rotation steps). Figure 1 summarizes the experimental design. In a subset of 13 subjects (11 men; mean 6 SD age, 21.0 6 1.2 years), we also assessed retention the following day using the same experimental pro-cedure but without EEG recordings.
As reported previously (Ghilardi et al., 2000; Perfetti et al., 2011), for each movement, we measured several parameters: reaction time, as the time from the target appearance to the movement onset; amplitude of peak velocity; movement time, as the time from movement onset to reversal; and directional error at the peak ve-locity. The latencies of both reversal point and stimulus presentation were marked and aligned to the corresponding EEG recordings and used for signal processing (see below) to define the brain dynamics related to movement preparation and execution (Perfetti et al., 2010, 2011).
Adaptation was computed for each step of rotation (15°, 30°, 45°, 60°) as the decrease in mean directional error between the first 30 trials and the last 30 trials (Fig. 1). The means for each subject were then averaged across the four rotation steps to get global individual indices of adapta-tion for correlaadapta-tion analyses (Pearson’s r) with electrophysiological markers.
To investigate the adaptation process, general linear models for repeated-measures and paired-sample t tests were performed on mean directional errors. Post hoc analyses were performed when needed with Bonferroni’s correction procedures.
To determine whether performance improved the following day, in the subset of 13 subjects, mean directional errors of the EARLY ROT of day 1 and day 2 were compared with paired t tests. The average difference between the two days was used as an index of retention for correlational analyses with electrophysiological data (Pearson’s r).
EEG recording and signal processing
hd-EEG was recorded from 256 electrodes (Hydrocel net; Electrical Geo-desics) while subjects performed the motor tasks. Data were collected using the high-impedance amplifier Net Amp 300 and Net Station 4.3 (Electrical Geodesics). Impedances were kept below 50 kV with a sam-pling rate of 250 Hz, and no electrolyte bridges were detected in any of the recording sessions. From the original 256 electrodes, we selected 181 sites on the basis of their location on the scalp. To do so, we removed 75 channels there were located on the cheeks and on the neck. The remain-ing 181 electrodes were used for additional analysis. Durremain-ing the record-ing, the EEG signal was referenced to a Cz sensor. For analysis, data were re-referenced to the average across the 181 electrodes. No technical issue was associated with the recording.
Figure 1. Experimental design for the adaptation task. Subjects adapted their movements to 60° rotation in four incremental steps of 15°. Each steps was made of three runs of 88 trials for a total of 264 trials per step. The first 30 trials of each step were averaged (EARLY ROT) and reflected the early stages of learning, whereas the average of the last 30 trials of each step (LATE ROT) reflected the latest stages of adaptation.
Pre-processing. Data pre-processing was performed with Net Station 4.3 software (Electrical Geodesics) and the public license toolbox EEGLAB (Delorme and Makeig, 2004), as described previously (Perfetti et al., 2010, 2011). Briefly, the continuous EEG signal was high-pass filtered above 0.5 Hz and low-pass filtered below 80 Hz with a notch filter centered at 60 Hz; channels affected by bad scalp– electrode contact (ei-ther silent or saturated electrodes) were visually identified and replaced with spherical splines interpolation (for a maximum of 10 channels). EEG was then segmented into 6 s epochs based on movement onset latencies (from 23 to 3 s after movement onset). This epoch length was selected to prevent contamination of the EEG with possible effects of filters edge artifacts that might be associated with some of the analyses. Finally, stereotypical artifacts, such as blinks, eye movements, motion-related signals, muscular activity, slow drift of the signal, detachment of the transient electrodes, line noise, and heart signals were removed by principal component analysis (Jung et al., 2000; Dien and Frishkoff, 2005) and any non-stereotypical artifacts by visual inspection. In partic-ular, the identification of components accounting for extra-brain artifac-tual stereotyped sources was based on a well-established procedure detailed previously (Makeig et al., 1997; Jung et al., 2000). Briefly, we visually inspected the power spectral density, topographical maps, and time activations of each estimated component, which have been proved to be highly informative of the nature of the signal accounted by the spatial filter. For instance, components showing peculiar and selective activity in the higher-frequency bands and that were associated with a “spotty” topography were considered as spatial filters accounting for muscular activity. Conversely, selective high power in the 2– 4 Hz range with peculiar activity in anterior frontal region were considered as com-ponents accounting for ocular signals. The comcom-ponents identified as “bad” were removed from the raw EEG signal. On average, we rejected 43.8 6 7.6 components of 100 estimated spatial filters, accounting for 59.3 6 19.1 (ranging from 25 to 79%). We further visually inspected the power spectral density of the “corrected” raw EEG signals to rule out the presence of any residual artifacts (Perfetti et al., 2010, 2011).
Because the main aim of the current investigation was to study the brain activity associated with early and late phases of adaptation, all EEG analyses were performed on the first 30 and the last 30 trials of each step of rotation (Fig. 1). Importantly, we did not find significant differences in the adaptation rate in the four steps (see Results). Thus, to account for the time-dependent variation of the EEG signal, in each subject, we obtained an average across the four steps for the first 30 trials of the four steps (EARLY ROT) and for the last 30 trials (LATE ROT; Fig. 1).
Spectral estimates. Spectral estimates at all channels were obtained in each participant on a single-trial basis by using Matlab 7 (Math-Works) and the public license toolbox EEGLAB (Delorme and Makeig, 2004). Time–frequency representations (TFRs) were com-puted using Morlet Wavelet transforms. The epoch length used was 3750 ms (1250 ms before to 2500 ms after movement onset; this was done to visualize low-frequency changes). Each trial epoch was portioned into 200 segments (distance between two consecutive bins was 16 ms). The lowest frequency was set at 4 Hz with three cycles, resulting in a window size of 209 sample points (836 ms). At the maximum frequency (80 Hz), the cycles were 30. The distance between two output frequency bins was 0.5 Hz. For each step, we averaged the single-trial TFRs of the first 30 trials and, separately, of the last 30 trials. The results (TFRs) were further normalized: TFRs of each channel was normalized by the average power calculated across all channels for all the specific frequency bins.
Task-related power variations were investigated within four frequency bands (theta, 4 – 8 Hz; alpha, 8 –13 Hz; beta, 13–25 Hz; and gamma, 25–55 Hz) and two temporal windows: movement planning (250 ms before movement onset) and execution (250 ms after movement onset). Figure 2 A showed that both reaction time and movement times were, on average, ;250 ms. TFRs were averaged within the two temporal windows and the four frequencies for both RAN and ROT and then for ROT, across the four steps in the EARLY ROT and LATE ROT.
Finally, to investigate local changes of EEG power across RAN, EARLY ROT, and LATE ROT, for all the selected time intervals and frequencies, we constructed topographic maps by using a statistical nonparametric mapping procedure (SnMP; simple-threshold, pperm5 0.05).
Paired-sample t tests were used to compare group spectral estimates between two conditions at all channels. The resulting t scores were plotted on the scalp by spherical spline interpolation. To take advantage of the actual data distribution and account for multiple comparisons testing in high-density EEG recordings, significant criteria were determined on the basis of a permutation test (Nichols and Holmes, 2002) as described in previ-ous papers (Huber et al., 2004; Perfetti et al., 2011). Specifically, EEG readings at each electrode for two conditions were shuffled according to 4096 possible permutations (randomly selected). Based on the statistics obtained from the permutation data, we calculated a t value for each electrode and found the maximal t value over all electrodes. The t value threshold was taken as the 95th percentile of the permutation-derived t values, and electrodes exceeding that threshold were taken as showing a significant difference between the two conditions. Based on these maps, we identified channels with significant differences in any of the contrasts, which were further pooled into two regions of interest (ROIs) on the basis of their scalp localization (Fig. 3B). ANOVA for repeated measures was used to assess differences in ROI power across the RAN, EARLY ROT, and LATE ROT (condition was the main factor with three levels). Least significance difference test was used for post hoc analysis and false discovery rate was used to minimize type I error. Finally, for each fre-quency and interval, we computed the difference between first and the last TFRs and averaged the results across the four rotation steps. These values were used in correlational analyses with indices of adaptation and retention.
Cross-frequency phase coherence. We explored the phase synchroniza-tion between theta and gamma frequency bands within the right parietal ROI above described and depicted in Figure 3B. We selected this ROI because, first, it showed significant task-related power changes in the theta and gamma bands, two frequency ranges that have been primarily considered fundamental in declarative memory processes. Second, in a number of EEG sleep and resting state studies (Huber et al., 2004; Land-sness et al., 2009, 2011; Ma¨a¨tta¨ et al., 2010), we have shown previously significant local changes of spectral activity (delta and alpha bands) as-sociated with learning that were localized over the right parietal cortex at scalp sites that almost overlapped the ones identified here. We first aver-aged the raw signal for the selected region (right parietal; Fig. 3B) and then computed the cross-frequency phase coherence analysis (Cross-FrPC), as described by Cohen (2008). To compute Cross-FrPC, we used a three-step procedure that was repeated over different frequency bins and temporal windows at a single-trial level. For optimal frequency–time resolution tradeoff, we used overlapping time windows of 500 ms, mov-ing by 12 ms in each iteration. Upper frequency bin distance was 2 Hz, with a total bandwidth of 5 Hz and ranging from 25 to 55 Hz (gamma
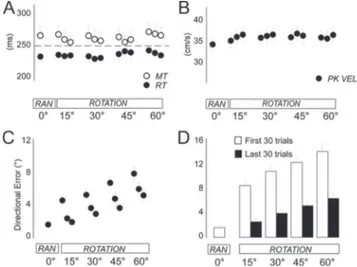
Figure 2. Kinematic results. A, Movement time (MT) and reaction time (RT) during RAN (baseline motor task) and ROT (visuo-motor adaptation task). Each circle and bar represent mean and SE of each run. B, Peak velocity (PK VEL) as per A. C, Mean directional errors (in degrees) and SE for each run of RAN and ROT. D, Mean directional errors (in degrees) and SE for the first and last 30 movements of RAN and each step of ROT.
band). The lower frequency was centered at 7 Hz, with a total bandwidth of 3 Hz (theta band; 7 6 1.5 Hz). In a first step, the EEG signal of the upper frequency bin was narrow bandpass filtered, and the power time series was extracted as the squared magnitude of the analytic signal ob-tained from the Hilbert transform. Then, the EEG signal of the lower-frequency band was bandpass filtered, and its phase time series was obtained from the angle of the Hilbert transform. The filtering was done by using a two-way, least-squares FIR (finite impulse response) proce-dure [as implemented in EEGLAB (Delorme and Makeig, 2004)]. In a second step, coherence value between the upper and lower frequencies in the preselected time window was computed. The power time series of the upper frequency in the 500 ms was extracted and normalized, and its instant phase was obtained through the Hilbert transform. For the same time window, the phase time series of the lower frequency band was extracted, and the Cross-FrPC between the two frequencies was com-puted using the phase coherence measure:
Cross-FrPC 51
n3t51
O
nei@f lt2fut#
where n is the number of time points, futis the phase value of the power
time series in the upper frequency at time point t, and fltis the phase of
the lower frequency band time series at time point t (Cohen, 2008). The
magnitude of the Cross-FrPC value can vary from 0 to 1, where 0 reflects absence of phase synchronization and 1 indicates that the phase indices are completely synchronized. The computation of Cross-FrPC was re-peated over time and frequency for every single trial to get a full matrix of gamma/theta phase coupling in the time interval of interest. Because we were interested in the planning and execution of movement, the compu-tation of the Cross-FrPC values was restricted to the window ranging from 500 ms before to 500 after movement onset even if the 6 s epoch trials were used for the filtering processes. After this procedure was ap-plied at trial level, in a third step, we computed the mean of Cross-FrPC values across trials for RAN and ROT. Specifically, we first obtained these values for the RAN and for all the first and last 30 trials. Then, as for previous analyses, we averaged the resulting values across the four steps of rotation to estimate coherent phase gamma/theta activity for the EARLY ROT and LATE ROT. Task-related changes in gamma/theta phase coupling were assessed using SnMP. t scores were computed along the frequency (the different gamma band bins) and time (time interval, 2500 to 500) dimensions. The uncorrected p values (puncorr, 0.01) and the signifi-cant criteria determined on the basis of permutation test (pperm5 0.05) were
assessed and plotted on the time–frequency maps. Analyses were performed in Matlab 7 (MathWorks) using signal processing and the public license EEGLAB (Delorme and Makeig, 2004) toolboxes.
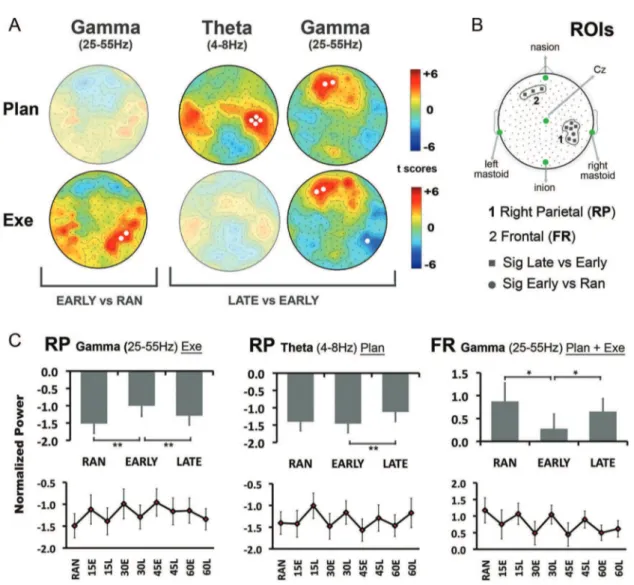
Figure 3. Spectral power analysis. A, Statistical nonparametric mapping analysis comparing EARLY ROT with RAN and LATE ROT during movement planning (Plan, 250 ms before movement onset) and movement execution (Exe, 250 ms after movement onset). Only the significant results are presented. White circles represent electrodes with significant power differences. B, Identifi-cation of two ROIs. Circles and squares represent electrodes with significant power variation in the EARLY ROT versus RAN and LATE ROT versus EARLY ROT comparisons, respectively. C, Mean and SE of TFRs of the two ROIs for gamma range in right parietal regions (RP, first column), theta in RP (second column), and gamma in frontal area (FR, third column). The gray bars are mean TFRs and SE of RAN, EARLY ROT, and LATE ROT. In the bottom graphs, circles represents the mean and SE of TFRs for RAN and for the first 30 trials (E) and last 30 trials (L) in each step (15, 30, 45, 60) of ROT. *p , 0.05, **p , 0.01.
Cross-channels phase coherence. We computed cross-channel phase co-herence (Cross-ChPC) values for RAN and all the first and last 30 trials of ROT to study the formation of transient neural assemblies between the right parietal region (the same identified for Cross-FrPC; Fig. 3B) and all the 181 electrodes. For each participant, we obtained Cross-ChPC in-dexes on a single-trial basis in the range of 4 – 80 Hz for a 3750 ms time window (1250 ms before to 2500 ms after movement onset) by using Matlab (MathWorks) and the public license toolbox EEGLAB (Delorme and Makeig, 2004). First, we obtained an average signal for the right parietal region and then we computed the coherence values (Delorme and Makeig, 2004). A Morlet wavelet approach was used with the same parameters reported previously in the spectral analysis section. We then determined mean coherence estimates for the two temporal intervals, planning and execution, and for the four frequency bands. Finally, task-related changes in phase coherence were estimated by using SnPM procedure (pperm5 0.05) and the relative t scores maps plotted, as described previously. Significant criteria were determined on the ba-sis of permutation test (Nichols and Holmes, 2002). Cross-ChPC is a frequency– domain measure that reflects coherent activity between distant areas engaged in a specific task. The degree of phase synchroni-zation between two channels (expressed by values between 0 and 1, where 1 indicates the maximum synchronization) is commonly considered as an index of reciprocal interactions between the participating neural pop-ulations. However, it could also be sensitive to shared activity as a result of volume conduction or computational consequence of the choice of a recording reference.
Results
Adaptation rate is similar across steps
As in previous experiments (Huber et al., 2004; Landsness et al., 2009; Perfetti et al., 2011), movements in both RAN and ROT tasks were straight with sharp reversals and overlapping strokes. Velocity profiles were bell-shaped, with clear acceleration and deceleration phases. Reaction time, movement duration, and peak velocity were stable across the entire session (Fig. 2 A, B).
The directional accuracy at the peak velocity in fast-reaching movements is a good proxy for planning accuracy. Thus, its changes in the course of adaptation reflect the switch from feedback to feedforward mechanisms: a higher accuracy at that point indicates a better plan, a greater degree of learning, and, thus, a lesser need for feedback corrections. Indeed, during ROT, subjects progressively decreased the directional error at peak ve-locity across runs and steps (run, F(2,32)5 55.01, p , 0.0001; step, F(3,48)5 39.04, p , 0.0001; run 3 step, F(6,96)5 0.75, p 5 0. 610; Fig. 2C). This result was confirmed by the finding of lower direc-tional errors in the last 30 movements compared with the first 30 movements of each step (blocks, F(1,16)5 141.93, p , 0.0001; step, F(3,48)5 29.26, p , 0.0001; run 3 step, F(6,96)5 1.7, p 5 0.18; Fig. 2 D). Importantly, adaptation rates (i.e., the difference of directional error between the first and last 30 movements) were similar across steps (F(3,48)5 1.71, p 5 0.20; Fig. 2 D). Thus, for each subject, we computed an average index of early adapta-tion (EARLY ROT) and one of late adaptaadapta-tion (LATE ROT) by averaging the corresponding directional errors across the four steps. These indices were used for correlations with EEG-derived indices (see below).
Finally, as reported previously (Huber et al., 2004; Landsness et al., 2009), adaptation rates were faster when tested the follow-ing day (t(12)5 2.44, p 5 0.031; day 1, 11.3 6 1.2; day 2, 9.02 6 1), suggesting the occurrence of retention and enhancement in this visuo-motor skill. Notably, when subjects were asked whether they have noticed anything during the task execution, they re-ported that something “strange” was going on with the mouse, but nobody ever mentioned explicitly that the cursor on the screen was rotated.
Modulation of gamma and theta activity in a right parietal cortical region
To find the EEG correlates of the switch from feedback to feed-forward mechanisms, and thus the development of learning, we first used power analysis to compare RAN (baseline motor task) and EARLY ROT, RAN, and LATE ROT, as well as between EARLY ROT and LATE ROT for all the frequency bands, in both the motor planning and execution temporal windows (250 ms each, see Materials and Methods). Figure 3 shows the significant results. EARLY ROT and RAN did not significantly differ in the motor planning window in any of the frequency bands. However, during movement execution, we found a selective increase of gamma in a small set of electrodes over the right posterior parietal scalp region (Fig. 3A). In the same area, when we compared LATE ROT and EARLY ROT, we found a significant increase of theta oscillatory activity during movement planning, although there was a decrease of gamma activity during movement execution. Finally, during both movement planning and execution, a signif-icant increase of gamma activity was present over frontal sites. Altogether, these results suggest that the right parietal region plays an important role in the switch from feedback to feedfor-ward mechanisms.
These findings were confirmed and further characterized with the direct comparison of the mean spectral estimates in the three conditions: RAN, EARLY ROT, and LATE ROT. These analyses were performed for the two ROIs, the right parietal and the frontal (Fig. 3B), obtained by pooling the electrodes with significant power variation. The results are summarized in Figure 3C (bars). Briefly, in right parietal ROI, the tree conditions differed in gamma activity during movement execution (F(2,32) 5 10.93, p , 0.001), with higher values in EARLY ROT compared with RAN (p , 0.001) and LATE ROT (p 5 0.016). Also, theta activity during movement planning showed an effect of condition (F(2,32) 5 3.8, p 5 0.033), with higher values in the LATE ROT compared with EARLY (p , 0.001). For the frontal ROI (Fig. 3C, bars), gamma activity did not show any difference between the two temporal windows: in both, there was a significant effect of condition (F(2,32)5 5.1, p 5 0.012), with a significant decrease in EARLY ROT compared with RAN (p 5 0.025) and LATE ROT (EARLY vs LATE, p 5 0.018). Importantly, the changes in both gamma and theta oscillatory activity between EARLY and LATE ROT were present for all the four rotation steps, as illustrated in the bottom diagrams of Fig-ure 3C. Even if adequate procedFig-ures were used to reduce artifacts associated with eye movements, muscle and eye activities might have partially affected the results obtained in the frontal ROI.
We then ascertained whether the gamma and theta differences between EARLY and LATE ROT in right parietal ROI could pre-dict the degree of adaptation and retention in our task. We found that the higher was the increase in right parietal ROI theta oscil-latory activity in LATE compared with EARLY ROT during movement planning, the larger was the degree of adaptation (r 5 0.5; p 5 0.04; n 5 17). No correlation was found with any of the other kinematics indices (all r , 0.14; p . 0.57), suggesting a specificity of theta modulation in memory processes. In addi-tion, in the subset of 13 subjects in which retention was tested the following day, we found that the same change in theta power showed a correlational trend with the degree of reten-tion (r 5 0.5; p 5 0.08; n 5 13). No relevant correlareten-tions were found between gamma band and behavioral indices of learn-ing or retention, suggestlearn-ing that theta activity in right parietal ROI plays a specific role in the promotion and maintenance of new motor memory.
In summary, our results suggest that learning might be related to a local switch, in the right parietal regions, from gamma activity during movement execution in EARLY adaptation to theta oscillatory ac-tivity during movement planning in the LATE stages of adaptation. It is worth not-ing that, to estimate the contribution of the phase locked oscillatory activity to our findings, we computed the time–fre-quency transformations on the averaged signal and performed the same analysis as described above. Interestingly, the oscilla-tory activity phase locked to the move-ment onset did not show any significant difference between the conditions of in-terests in any frequency band (data not shown).
During adaptation, gamma/theta phase coupling is enhanced in motor planning
Analysis of the local dynamics of this phe-nomenon in right parietal ROI should in-deed provide important insights on how the brain dynamically forms new and, possibly, more efficient internal models during adaptation. In agreement with the present and previous results that the right posterior parietal cortex plays an im-portant role in visuo-motor adaptation (Ghilardi et al., 2000; Huber et al., 2004), we focused our attention on the right pa-rietal ROI. In particular, we investigated the functional connectivity across gamma and theta frequencies, which has been suggested recently as a marker of memory formation (Lisman and Idiart, 1995; Sau-seng et al., 2010). The findings of the cross-FrPC are reported in Figure 4. The mean gamma/theta coherence values over the planning and execution of reaching plateaued in the gamma range between 35 and 50 Hz (Fig. 4 A). EARLY ROT com-pared with RAN yielded a general increase of gamma/theta phase coupling before the movement onset (Fig. 4 B), reaching sta-tistical significance during movement planning just after stimulus presentation. In the LATE ROT, the increased gamma/
Figure 4. FrPC between gamma and theta frequencies within the right parietal ROI. A, Top, Mean theta/gamma Cross-FrPC values for RAN, EARLY ROT, and LAT ROT. The y-axis represents gamma frequency in bins; the x-axis represents the coherence values of theta with each gamma bin. Bottom, Time–frequency plot of the Cross-FrPC for RAN, EARLY ROT, and LAT ROT. B, t score obtained from the comparisons between RAN, EARLY ROT, and LATE ROT. The y-axis represents the different gamma frequency. The x-axis represents time (0, movement onset; stim, stimulus presentation; end, arrival time in the target). Arrows point to
4
frequency–time spots (1 and 2) that showed significant differ-ences (white, p , 0.05 determined on the basis of permuta-tion test; shaded, uncorrected p , 0.01). Under each t-score maps, the time courses of the gamma/theta coherence within the significant spots for the two conditions are shown. C, Cir-cles represent the means and SE of the gamma/theta coher-ence for spots 1 and 2 during RAN and for the first 30 trials (E) and last 30 trials (L) for each step of ROT (15, 30, 45, 60). D, The maps show the t scores obtained from the comparisons of gamma/theta phase coupling across RAN, EARLY ROT, and LATE ROT at the spot squared in B.
theta phase coherence was still evident be-fore the movement onset. In summary, compared with RAN, movement plan-ning during adaptation is accompanied by an enhancement of gamma/theta phase coupling, which is more evident in the EARLY ROT (Fig. 4 B–D). Direct compar-ison between LATE and EARLY ROT re-vealed a significant decrease of gamma/ theta phase synchronization during movement execution (Fig. 4 B–D).
The higher values of gamma/theta phase coupling in the right parietal region during the adaptation process might reflect the dynamic changes related to synaptic plasticity—and thus, to the for-mation of new memories—in the poste-rior cortex (Wespatat et al., 2004; Jensen et al., 2007). In this context, the connec-tivity of the right parietal ROI with other regions acquires particular importance, because it might reveal the formation of transient neural assemblies important for motor learning.
Enhanced gamma band connectivity between centro-posterior regions occurs during early adaptation
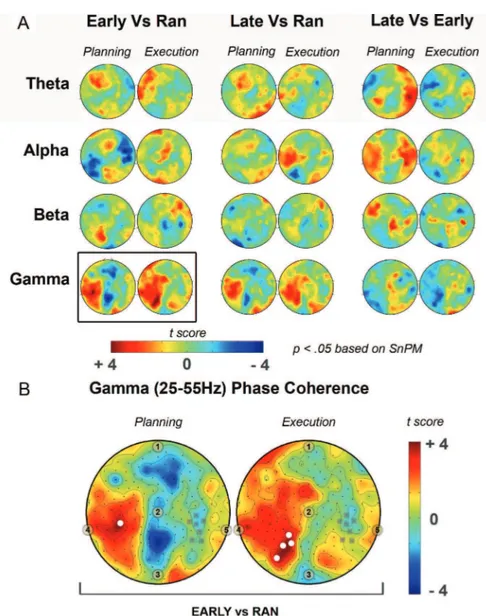
To determine the functional connectiv-ity of the right parietal ROI with the other sites of the scalp, we computed cross-channel phase coherence between the right parietal ROI and all the 181 electrodes. The obtained topographies in the planning and execution intervals were similar between conditions for all the frequency bands. Task-related coher-ence variation for all frequency bands was tested separately for planning and execu-tion with the SnPM approach. The signif-icant findings are shown in Figure 5. Briefly, the only significant differences were found in the gamma band (25–55 Hz) between EARLY ROT and RAN (p , 0.05). Specifically, in the EARLY ROT and only during movement planning, there
was a significant enhancement of phase coupling of the right parietal area with the contralateral homologous region. During movement execution, this phase synchronization spread widely over the left hemisphere, reaching significance over the left parieto-occipital region. These results suggest that the early stages of adaptation are associated with enhanced connectivity in the gamma band between the centro-posterior regions of the two hemispheres. However, we must acknowledge that the use of reference-dependent EEG signal for the phase coherence analysis could have biased our results.
Discussion
The current study is the first to characterize the dynamic changes in hd-EEG oscillatory synchronization associated with acquisition of new motor skills in a task in which visuo-motor learning is achieved without awareness. The main, novel finding is that the shift from feedback to feedforward mechanisms, which drives adaptation, is
associated with the modulation of gamma and theta power ampli-tudes and phase coupling in the right parietal regions: in these areas, gamma power, which is enhanced during movement exe-cution at the beginning of adaptation, leads, later on, to an in-crease of theta during movement planning. Moreover, gamma/ theta synchronization is enhanced during adaptation.
The early phase of learning
In the early stage of adaptation when errors were higher, we found that, over the right parietal region, gamma power in-creased during movement execution, whereas theta/gamma phase coupling increased during movement planning. Both changes likely reflect integration of feedforward and feedback information as well as attentional mechanisms promoting the development of new efficient motor plans. Specifically, enhance-ment of gamma power might reflect the mismatch between the old and the new visuo-spatial coordinates as well as its transient
Figure 5. Cross-ChPC for the four frequency bands between the right parietal ROI and all the remaining electrodes. A, The maps show the t scores obtained from the comparisons of Cross-ChPC across RAN, EARLY ROT, and LATE ROT during movement planning (Planning, 250 ms before movement onset) and movement execution (Execution, 250 ms after movement onset). B, Significant comparisons, as revealed by the SnPM procedure (p , 0.05), are reported. The maps show the cross-channel gamma phase coherence t scores obtained from the comparison of Cross-ChPC across RAN and EARLY ROT during movement planning (Planning, 250 ms before movement onset) and movement execution (Execution, 250 ms after movement onset). White circles indicate the significant electrodes (p , 0.05); gray squares indicate the electrodes of the right parietal ROI. 1, Nasion; 2, Cz; 3, inion; 4, left mastoid; 5, right mastoid.
representation, whereas the increase of phase coupling between high and low frequencies might reflect the integration of new information into a new internal model. Indeed, gamma band is enhanced in response to unfamiliar stimuli (Gruber and Mu¨ller, 2002; Fiebach et al., 2005). Also, gamma band synchronization is involved in forming transient representations in a specific sen-sory modality (Gray et al., 1989; Tallon-Baudry and Bertrand, 1999; Kaiser et al., 2004) and at multisensory levels (Yuval-Greenberg and Deouell, 2007; Schneider et al., 2008; Senkowski et al., 2009). In our study, gamma increase in the right parietal regions was selectively found during movement execution, when novel information about visuo-spatial coordinates is processed and integrated. Thus, gamma enhancement would serve to form a new representation that, once established, can be used to bias and shape the internal model, thus improving motor planning. Interestingly, this is the first demonstration of gamma modulation in a task in which adaptation is achieved without subjects’ awareness, and no anticipatory cognitive strategies can be adopted.
It has been proposed recently that oscillatory phase synchro-nization between frequencies is responsible for the transfer of the new integrated percept to memory systems and for the synaptic changes underlying sustained representations (Fell and Axm-acher, 2011). Indeed, a significant enhancement of gamma/theta phase during planning was evident both early and, to a lesser extent, late in visuo-motor adaptation. Accordingly, many EEG and MEG studies adopting short- and working-memory para-digms have shown that gamma/theta phase coupling is associated with encoding and retrieval of verbal and visual information (Cowan, 2001; Sauseng et al., 2009). Interestingly, a theory posits that memory formation is facilitated by the “nesting’ of gamma cycles into a theta period, where each gamma cycle represents a single item (Lisman and Idiart, 1995; Sauseng et al., 2010). These nested gamma/theta oscillations would code the stimuli temporal or spatial sequence by their phase relation (Sauseng et al., 2009; Fell and Axmacher, 2011). Thus, our results suggest that the for-mation of new motor memories is favored by increases of gam-ma/theta phase coupling. This is the first demonstration of this memory-promoting mechanism during learning without aware-ness. Of note, phase coherence between gamma and other fre-quencies as delta and alpha have been related to motor and sensory demands, as well as during resting state (de Lange et al., 2008; Lakatos et al., 2008; Osipova et al., 2008; Jerbi and Bertrand, 2009). Future studies are needed to investigate the contribution of these neural mechanisms to motor adaptation.
The main EEG changes during adaptation took place over right posterior parietal areas, which are involved in many spatial-related tasks (Haxby et al., 1991; Jonides et al., 1993; McIntosh et al., 1994; Fink et al., 1996; Haxby et al., 1996). We acknowledge that EEG analysis at the scalp level suffers of low spatial resolu-tion, especially in terms of lateralization. Nonetheless, our find-ings are in agreement with previous studies showing a specific learning-related involvement of the right parietal cortex in this task (Ghilardi et al., 2000; Huber et al., 2004; Landsness et al., 2009). These regions have been often addressed as crucial nodes in multisensory integration, attention, and motor planning dur-ing reachdur-ing (Batista et al., 1999; Sabes, 2000; Van Der Werf et al., 2010; Perfetti et al., 2011). Indeed, these processes are especially important in early adaptation, because the discrepancy between feedback and feedforward information triggers the development of new internal models and must occur with the synergy of mul-tiple regions. Supporting these conclusions, we found that, dur-ing early adaptation, connectivity between the right parietal
region and the contralateral hemisphere increases in the gamma band, in agreement with the findings of parietal gamma oscilla-tory activity in visuo-spatial processes of reaching and saccadic movements (Womelsdorf and Fries, 2006; Van Der Werf et al., 2010).
Interestingly, frontal areas also showed marked changes in gamma power: it diminished in early adaptation both during planning and execution but returned toward the range of the RAN at the end of adaptation. This modulation might be associ-ated with the general selection and attention processes that are involved in reaching, because frontal gamma synchronization has been associated with attentional and intentional processing during motor tasks in humans (Brovelli et al., 2005) and with action selection during a variety of tasks in animals (for review, see Womelsdorf and Fries, 2006). The few EEG and MEG studies with visuo-motor learning tasks have extensively documented involvement in many frequency bands of frontal regions, fronto-parietal networks, and primary sensory motor areas (Contreras-Vidal and Kerick, 2004; Anguera et al., 2009; Bradberry et al., 2010; Gentili et al., 2011). The results of such studies are not easily comparable with ours for methodological reasons. First, and most importantly, the paradigms used in those studies required, or at least allowed for, the implementation of cognitive strategies, whereas learning in our task occurred implicitly, without the subjects’ awareness. Second, differently from the other studies, we used a direct contrast between conditions without any base-line, normalizing the data by global power within frequency bins. This proved to be an effective method to detect local spectral changes (Kaiser et al., 2008).
Late adaptation
In late adaptation, when the directional error was lower, over the right parietal region, movement execution was associated with a decrease of gamma power, whereas movement planning was ac-companied by a significant increase of theta oscillatory activity. In addition, the synchronization between gamma/theta bands diminished. Altogether, these findings represent the physiologi-cal cascade associated with the acquisition of a new motor mem-ory or internal model. In each rotation step, directional error constantly decreased in the late trials compared with the early ones, suggesting that the development of new and more efficient motor plans occurred equally across steps. This, in turn, implies that visuo-spatial remapping had taken place and new neural representations have been established. We thus hypothesize that the decrease of gamma band power during movement execution compared with the early stage of learning reflects a “repetition– suppression” phenomenon (Gruber and Mu¨ller, 2002), whereas the increase of theta power during movement planning is the hallmark of an accurate, successful motor plan formation (Fig. 3A). Consistent with these conclusions are the reports of an en-hancement of gamma band oscillations in response to repetition of unfamiliar stimuli (Gruber and Mu¨ller, 2002; Fiebach et al., 2005) and a decrease of gamma power in response to repetition of familiar items (Gruber and Mu¨ller, 2002). Similarly, in our task, early exposure to a new visuo-motor transformation was associ-ated with gamma enhancement, whereas its repetition was ac-companied by gamma decrease. Recent studies revealed that both movement speed and direction could be decoded by low-frequency modulation (in the range of delta and low theta bands; ,7 Hz) during movement execution (Jerbi et al., 2007; Waldert et al., 2008; Acharya et al., 2010). In our study, it would be plau-sible to expect an association between changes in movement di-rection during rotation learning and variation of low-frequency
oscillatory activity. Unfortunately, the short intertrial interval ad-opted in our motor task would have likely caused an overlap of the activity at very low frequency (,4 Hz) over consecutive trials, making the results of this analysis difficult to interpret.
Theta enhancement during planning and, most importantly, its positive correlation with adaptation and retention indices sug-gest that theta oscillations are involved in the sustained represen-tation and retrieval of new internal models. This conclusion is in agreement with the role of theta band in reaching (Perfetti et al., 2011) and motor learning (Caplan et al., 2003; Tombini et al., 2009; Gentili et al., 2011) and in memory acquisition, retention, and retrieval in verbal and spatial working memory tasks (for review, see Sauseng et al., 2010).
References
Acharya S, Fifer MS, Benz HL, Crone NE, Thakor NV (2010) Electrocorti-cographic amplitude predicts finger positions during slow grasping mo-tions of the hand. J Neural Eng 7:046002.
Anguera JA, Seidler RD, Gehring WJ (2009) Changes in performance mon-itoring during sensorimotor adaptation. J Neurophysiol 102:1868 –1879. Batista AP, Buneo CA, Snyder LH, Andersen RA (1999) Reach plans in
eye-centered coordinates. Science 285:257–260.
Bradberry TJ, Gentili RJ, Contreras-Vidal JL (2010) Reconstructing three-dimensional hand movements from noninvasive electroencephalo-graphic signals. J Neurosci 30:3432–3437.
Brovelli A, Lachaux JP, Kahane P, Boussaoud D (2005) High gamma fre-quency oscillatory activity dissociates attention from intention in the hu-man premotor cortex. Neuroimage 28:154 –164.
Caplan JB, Madsen JR, Schulze-Bonhage A, Aschenbrenner-Scheibe R, New-man EL, Kahana MJ (2003) HuNew-man theta oscillations related to senso-rimotor integration and spatial learning. J Neurosci 23:4726 – 4736. Cohen MX (2008) Assessing transient cross-frequency coupling in EEG
data. J Neurosci Methods 168:494 – 499.
Contreras-Vidal JL, Kerick SE (2004) Independent component analysis of dynamic brain responses during visuomotor adaptation. Neuroimage 21:936 –945.
Cowan N (2001) The magical number 4 in short-term memory: a reconsid-eration of mental storage capacity. Behav Brain Sci 24:87–114; discussion 114 –185.
de Lange FP, Jensen O, Bauer M, Toni I (2008) Interactions between poste-rior gamma and frontal alpha/beta oscillations during imagined actions. Front Hum Neurosci 2:7.
Delorme A, Makeig S (2004) EEGLAB: an open source toolbox for analysis of single-trial EEG dynamics including independent component analysis. J Neurosci Methods 134:9 –21.
Dien J, Frishkoff GA (2005) Principle component analysis of ERP data. In: Event-related potentials. A methods handbook (Handy TC, ed). Cam-bridge, MA: Massachusetts Institute of Technology.
Fell J, Axmacher N (2011) The role of phase synchronization in memory processes. Nat Rev Neurosci 12:105–118.
Fiebach CJ, Gruber T, Supp GG (2005) Neuronal mechanisms of repetition priming in occipitotemporal cortex: spatiotemporal evidence from func-tional magnetic resonance imaging and electroencephalography. J Neu-rosci 25:3414 –3422.
Fink GR, Halligan PW, Marshall JC, Frith CD, Frackowiak RS, Dolan RJ (1996) Where in the brain does visual attention select the forest and the trees? Nature 382:626 – 628.
Gentili RJ, Bradberry TJ, Oh H, Hatfield BD, Vidal JL (2011) Cerebral cor-tical dynamics during visuomotor transformation: adaptation to a cognitive-motor executive challenge. Psychophysiology 48:813– 824. Ghilardi M, Ghez C, Dhawan V, Moeller J, Mentis M, Nakamura T, Antonini
A, Eidelberg D (2000) Patterns of regional brain activation associated with different forms of motor learning. Brain Res 871:127–145. Gray CM, Ko¨nig P, Engel AK, Singer W (1989) Oscillatory responses in cat
visual cortex exhibit inter-columnar synchronization which reflects global stimulus properties. Nature 338:334 –337.
Graydon FX, Friston KJ, Thomas CG, Brooks VB, Menon RS (2005) Learning-related fMRI activation associated with a rotational visuo-motor transformation. Brain Res Cogn Brain Res 22:373–383.
Gruber T, Mu¨ller MM (2002) Effects of picture repetition on induced
gamma band responses, evoked potentials, and phase synchrony in the human EEG. Brain Res Cogn Brain Res 13:377–392.
Haxby JV, Grady CL, Horwitz B, Ungerleider LG, Mishkin M, Carson RE, Herscovitch P, Schapiro MB, Rapoport SI (1991) Dissociation of object and spatial visual processing pathways in human extrastriate cortex. Proc Natl Acad Sci U S A 88:1621–1625.
Haxby JV, Ungerleider LG, Horwitz B, Maisog JM, Rapoport SI, Grady CL (1996) Face encoding and recognition in the human brain. Proc Natl Acad Sci U S A 93:922–927.
Herrmann CS, Fru¨nd I, Lenz D (2010) Human gamma-band activity: a re-view on cognitive and behavioral correlates and network models. Neuro-sci Biobehav Rev 34:981–992.
Huber R, Hill SL, Holladay C, Biesiadecki M, Tononi G, Cirelli C (2004) Sleep homeostasis in Drosophila melanogaster. Sleep 27:628 – 639. Imamizu H, Miyauchi S, Tamada T, Sasaki Y, Takino R, Pu¨tz B, Yoshioka T,
Kawato M (2000) Human cerebellar activity reflecting an acquired in-ternal model of a new tool. Nature 403:192–195.
Inoue K, Kawashima R, Satoh K, Kinomura S, Sugiura M, Goto R, Ito M, Fukuda H (2000) A PET study of visuomotor learning under optical rotation. Neuroimage 11:505–516.
Jensen O, Kaiser J, Lachaux JP (2007) Human gamma-frequency oscilla-tions associated with attention and memory. Trends Neurosci 30:317–324.
Jerbi K, Bertrand O (2009) Cross-frequency coupling in parieto-frontal os-cillatory networks during motor imagery revealed by magnetoencepha-lography. Front Neurosci 3:3– 4.
Jerbi K, Lachaux JP, N9Diaye K, Pantazis D, Leahy RM, Garnero L, Baillet S (2007) Coherent neural representation of hand speed in humans re-vealed by MEG imaging. Proc Natl Acad Sci U S A 104:7676 –7681. Jonides J, Smith EE, Koeppe RA, Awh E, Minoshima S, Mintun MA (1993)
Spatial working memory in humans as revealed by PET. Nature 363:623– 625.
Jung TP, Makeig S, Westerfield M, Townsend J, Courchesne E, Sejnowski TJ (2000) Removal of eye activity artifacts from visual event-related poten-tials in normal and clinical subjects. Clin Neurophysiol 111:1745–1758. Kaiser J, Bu¨hler M, Lutzenberger W (2004) Magnetoencephalographic
gamma-band responses to illusory triangles in humans. Neuroimage 23:551–560.
Kaiser J, Rahm B, Lutzenberger W (2008) Direct contrasts between experi-mental conditions may yield more focal oscillatory activations than com-paring pre- versus post-stimulus responses. Brain Res 1235:63–73. Kawato M (1999) Internal models for motor control and trajectory
plan-ning. Curr Opin Neurobiol 9:718 –727.
Krakauer JW, Ghilardi MF, Mentis M, Barnes A, Veytsman M, Eidelberg D, Ghez C (2004) Differential cortical and subcortical activations in learn-ing rotations and gains for reachlearn-ing: a PET study. J Neurophysiol 91:924 –933.
Lakatos P, Karmos G, Mehta AD, Ulbert I, Schroeder CE (2008) Entrain-ment of neuronal oscillations as a mechanism of attentional selection. Science 320:110 –113.
Landsness EC, Crupi D, Hulse BK, Peterson MJ, Huber R, Ansari H, Coen M, Cirelli C, Benca RM, Ghilardi MF, Tononi G (2009) Sleep-dependent improvement in visuomotor learning: a causal role for slow waves. Sleep 32:1273–1284.
Landsness E, Ferrarelli F, Sarasso S, Goldstein MR, Riedner BA, Perfetti B, Moisello C, Cirelli C, Ghilardi MF, Tononi G (2011) Electrophysiolog-ical traces of visuomotor learning and their renormalization after sleep. Clin Neurophysiol. Advance online publication. Retrieved September 4, 2011. doi:10.1016/j.clinph.2011.05.001.
Lisman J (2010) Working memory: the importance of theta and gamma oscillations. Curr Biol 20:R490 –R492.
Lisman JE, Idiart MA (1995) Storage of 7 6 2 short-term memories in os-cillatory subcycles. Science 267:1512–1515.
Ma¨a¨tta¨ S, Landsness E, Sarasso S, Ferrarelli F, Ferreri F, Ghilardi MF, Tononi G (2010) The effects of morning training on night sleep: a behavioral and EEG study. Brain Res Bull 82:118 –123.
Makeig S, Jung TP, Bell AJ, Ghahremani D, Sejnowski TJ (1997) Blind sep-aration of auditory event-related brain responses into independent com-ponents. Proc Natl Acad Sci U S A 94:10979 –10984.
McIntosh AR, Grady CL, Ungerleider LG, Haxby JV, Rapoport SI, Horwitz B (1994) Network analysis of cortical visual pathways mapped with PET. J Neurosci 14:655– 666.
Nichols TE, Holmes AP (2002) Nonparametric permutation tests for func-tional neuroimaging: a primer with examples. Hum Brain Mapp 15:1–25. Oldfield RC (1971) The assessment and analysis of handedness: the
Edin-burgh inventory. Neuropsychologia 9:97–113.
Osipova D, Hermes D, Jensen O (2008) Gamma power is phase-locked to posterior alpha activity. PLoS One 3:e3990.
Perfetti B, Moisello C, Lanzafame S, Varanese S, Landsness EC, Onofrj M, Di Rocco A, Tononi G, Ghilardi MF (2010) Attention modulation regu-lates both motor and non-motor performance: a high-density EEG study in Parkinson’s disease. Arch Ital Biol 148:279 –288.
Perfetti B, Moisello C, Landsness EC, Kvint S, Pruski A, Onofrj M, Tononi G, Ghilardi MF (2011) Temporal evolution of oscillatory activity predicts per-formance in a choice-reaction time reaching task. J Neurophysiol 105:18 –27. Sabes PN (2000) The planning and control of reaching movements. Curr
Opin Neurobiol 10:740 –746.
Sauseng P, Klimesch W, Heise KF, Gruber WR, Holz E, Karim AA, Glennon M, Gerloff C, Birbaumer N, Hummel FC (2009) Brain oscillatory sub-strates of visual short-term memory capacity. Curr Biol 19:1846 –1852. Sauseng P, Griesmayr B, Freunberger R, Klimesch W (2010) Control
mech-anisms in working memory: a possible function of EEG theta oscillations. Neurosci Biobehav Rev 34:1015–1022.
Schneider TR, Debener S, Oostenveld R, Engel AK (2008) Enhanced EEG gamma-band activity reflects multisensory semantic matching in visual-to-auditory object priming. Neuroimage 42:1244 –1254.
Senkowski D, Schneider TR, Tandler F, Engel AK (2009) Gamma-band ac-tivity reflects multisensory matching in working memory. Exp Brain Res 198:363–372.
Tallon-Baudry C, Bertrand O (1999) Oscillatory gamma activity in humans and its role in object representation. Trends Cogn Sci 3:151–162. Tombini M, Zappasodi F, Zollo L, Pellegrino G, Cavallo G, Tecchio F,
Gug-lielmelli E, Rossini PM (2009) Brain activity preceding a 2D manual catching task. Neuroimage 47:1735–1746.
Van Der Werf J, Jensen O, Fries P, Medendorp WP (2010) Neuronal syn-chronization in human posterior parietal cortex during reach planning. J Neurosci 30:1402–1412.
Waldert S, Preissl H, Demandt E, Braun C, Birbaumer N, Aertsen A, Mehring C (2008) Hand movement direction decoded from MEG and EEG. J Neurosci 28:1000 –1008.
Wespatat V, Tennigkeit F, Singer W (2004) Phase sensitivity of synaptic modifications in oscillating cells of rat visual cortex. J Neurosci 24: 9067–9075.
Womelsdorf T, Fries P (2006) Neuronal coherence during selective atten-tional processing and sensory-motor integration. J Physiol Paris 100: 182–193.
Yuval-Greenberg S, Deouell LY (2007) What you see is not (always) what you hear: induced gamma band responses reflect cross-modal interac-tions in familiar object recognition. J Neurosci 27:1090 –1096.