XXXI CYCLE OF PHD IN
CIVIL SYSTEMS ENGINEERING
DEPARTMENT OF CIVIL, ARCHITECTURAL AND ENVIRONMENTAL
ENGINEERING
PHD THESIS
Investigating the potential of the
combination of random utility models
(CoRUM) for discrete choice modelling and
travel demand analysis
Supervisor:
Prof. Andrea Papola
PhD Program Coordinator:
PhD candidate:
Prof. Andrea Papola
Fiore Tinessa
2
Alla mia famiglia, perché tutto il tempo che non le ho potuto dedicare è stato impiegato per questo.
3
Summary
Summary ... 3 List of figures ... 7 List of tables ... 9 Chapter 1 : Introduction ... 111.1 Overview of choice modelling issues ... 11
1.2 The CoRUM basic idea ... 13
1.3 Objectives and contributions of the thesis ... 14
1.4 Thesis canvas ... 15
Chapter 2 : State of the Art ... 17
2.1 Random utility theory – general assumptions ... 17
Random utility ... 17
Additive and multiplicative approaches ... 18
Maximizing benefit behaviour ... 18
Random utility maximization models (RUMs) ... 19
2.2 State of the art of RUMs ... 21
Error structure ... 21
2.2.1.1 GEV models ... 22
Multinomial Logit ... 22
Nested Logit ... 25
Cross Nested Logit and further generalizations ... 26
FinMix ... 28
2.2.1.2 Multinomial Probit ... 29
2.2.1.3 Mixed models ... 32
Error Component Logit ... 32
Normal alternative specific Error Component GEV ... 34
Taste heterogeneity ... 34
2.2.2.1 Observable taste heterogeneity... 35
2.2.2.2 Parametric approach ... 36
4
Random coefficient Logit ... 37
Posterior analysis and individual-level parameters on continuous distributions ... 38
2.2.2.3 Nonparametric approach ... 39
Latent class MNL ... 40
Discrete mixture of MNL ... 41
Variation on the theme ... 41
Posterior analysis with discrete distributions ... 42
2.2.2.4 Semi-nonparametric approach ... 42
Mixed Logit as mixture of parametric distributions ... 43
Latent class MNL with endogenous segmentation ... 43
Logit-Mixed Logit model ... 44
Latent class as a finite mixture of continuous distributions (Latent class Mixed Logit) ... 44
2.2.2.5 Variation on a theme – the scale heterogeneity ... 45
Unified framework ... 46
Probit and Mixed Logit with joint EC/RC specification ... 46
Mixed GEV ... 47
Mixed Probit ... 48
Latent class GEV ... 48
Going further ... 48
2.3 Application of RUMs to route choice ... 50
Route choice modelling: general issues ... 53
Logit based route choice models ... 54
2.3.2.1 Multinomial Logit - Dial’s algorithm ... 55
2.3.2.2 C-Logit ... 57
2.3.2.3 Path-Size Logit... 58
2.3.2.4 IAP Logit ... 59
GEV models for route choice ... 59
2.3.3.1 Link Nested Logit ... 60
2.3.3.2 Pair Combinatorial Logit ... 61
2.3.3.3 Link Based - Network GEV ... 62
2.3.3.4 Multinomial Weibit ... 62
Error component models ... 63
2.3.4.1 Multinomial Probit and Monte-Carlo algorithm ... 63
2.3.4.2 Mixed Logit ... 64
5
2.4 The Combination of random utility models (CoRUM) as a unified framework ... 67
Chapter 3 : CoRUM for taste heterogeneity ... 70
3.1 Background and motivation: the Mixed GEV as a practical solution to joint EC/RC Mixed Logit model ... 70
3.2 Mixed RUMs: notation and formulation... 73
3.3 The Combination of RUMs (CoRUM): a generalization for taste heterogeneity... 75
3.4 Application on real data ... 78
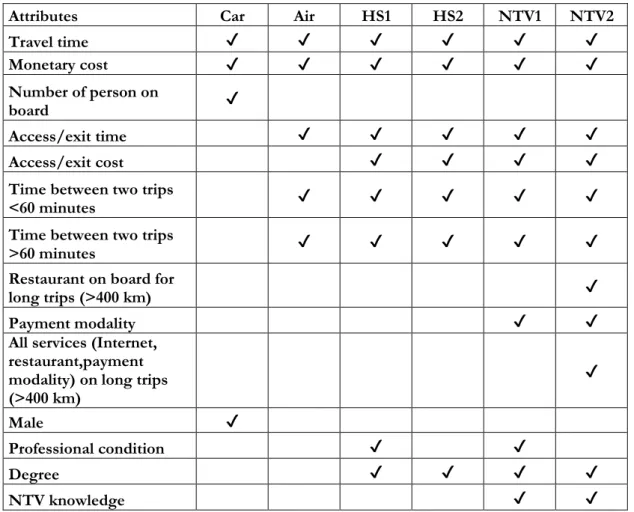
Stated preference survey ... 78
Utilities specification ... 78
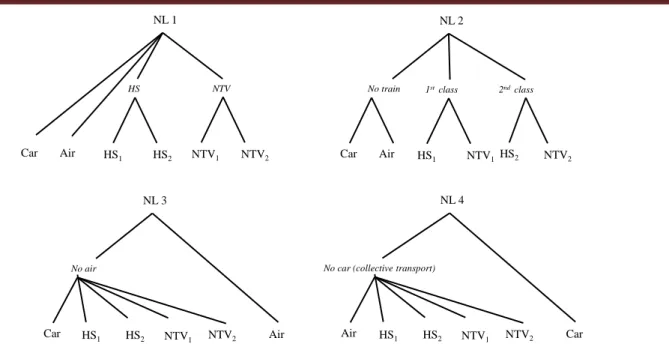
Models error structure ... 79
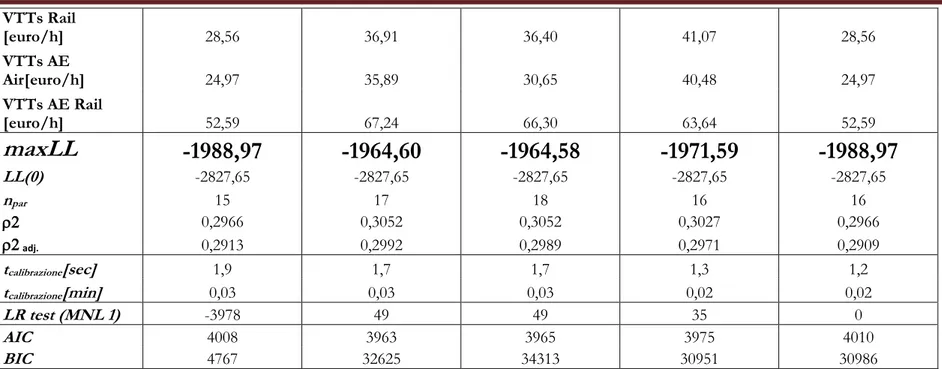
Estimation results... 82
3.5 Conclusions and future research ... 83
Appendix 3/A: Estimation results on real data ... 85
Chapter 4 : Random utility models: regression vs forecasting ...103
4.1 Closed-form R.U.M. and forecasting ... 103
4.2 Model’s elasticities ... 104
4.3 Experimental analysis ... 105
Experiment setting ... 105
Specification of the structure of the tested models ... 106
Experimental results... 106
4.4 Conclusions and future steps ... 114
Chapter 5 : The CoNL route choice model ... 115
5.1 Background and motivation ... 115
5.2 The CoRUM model and its CoNL particularization ... 117
5.3 A CoNL specification for route choice modelling ... 118
CoNL route choice: model structure ... 120
CoNL route choice: model parameters ... 122
5.4 The CoNL route choice model with implicit probability statement ... 124
Specification of mixing components and model structure ... 124
5.4.1.1 Double-step algorithm ... 125
5.4.1.2 Single-step algorithm ... 128
Calculation of model parameters ... 129
5.5 Experimental analysis ... 130
Four links-three routes network... 130
Braess’ network ... 132
6
Grid network ... 137
Sioux-Falls network ... 137
Summary of experimental analysis ... 140
5.6 Conclusions and research prospects ... 140
Chapter 6 : Some advance on CoNL route choice model ...142
6.1 Route choice modelling issues – a brief recap... 142
The computational problem in route choice: implicit enumeration algorithms ... 142
The overlapping problem in route choice ... 144
6.2 An implicit enumeration algorithm for CoNL route choice ... 146
CoNL recursive equations ... 146
Specification of mixing components algorithm without explicit enumeration ... 149
SNL CoNL algorithm ... 150
Simplified SNL CoNL algorithm ... 152
Experimental results... 153
6.3 An in depth analysis of CoNL route choice and Daganzo and Sheffi correlations ... 159
6.4 Experimental results on real data with unrestricted acyclic choice set ... 168
6.5 Conclusions and future steps ... 170
Chapter 7 : Conclusions of the thesis ...172
Contributi a questo lavoro ...176
Ringraziamenti personali ...178
7
List of figures
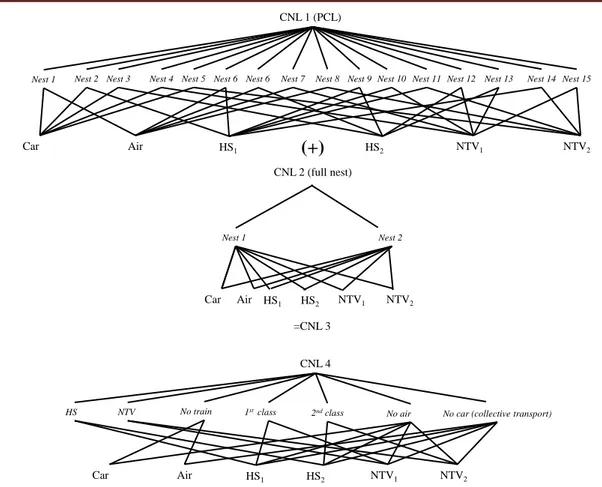
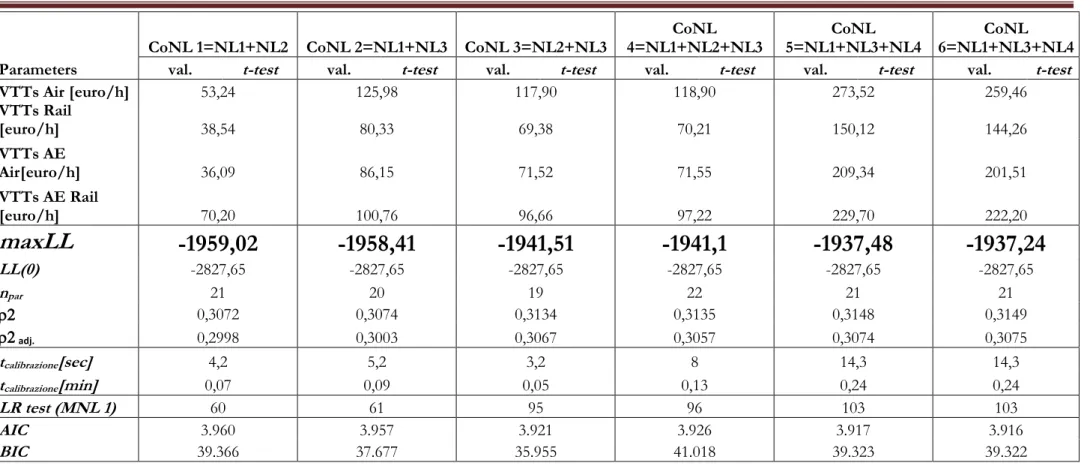
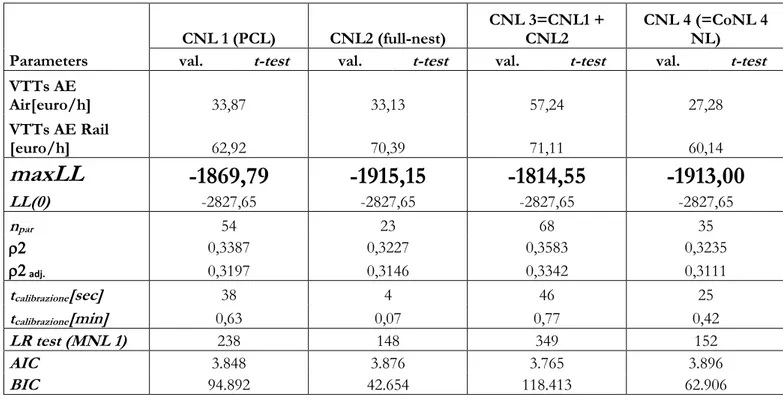
Figure 3.1: Model estimation on SP survey for six alternatives mode choice Naples-Milan - Nested Logit specifications for error structure. ... 80 Figure 3.2: Model estimation on SP survey for six alternatives mode choice Naples-Milan – Cross Nested Logit specifications for error structure. ... 81 Figure 4.1: Model’s specification for three alternatives-context. ... 108 Figure 4.2: Model’s specification for four alternatives-context. ... 108 Figure 4.3: 0.95-0-0 correlation scenario – synthetic performance plots indicator for forecasting (column 1) and regression (column2 and 3)... 109 Figure 4.4. 0.5-0.5-0 correlation scenario – synthetic performance plots indicator for forecasting (column 1) and regression (column2 and 3)... 109 Figure 4.5: 0.7-0.7-0 correlation scenario – synthetic performance plots indicator for forecasting (column 1) and regression (column2 and 3)... 110 Figure 4.6: 0.3-0.3-0.1 correlation scenario – synthetic performance plots indicator for forecasting (column 1) and regression (column2 and 3). ... 110 Figure 4.7: 0.5-03-0.3 correlation scenario – synthetic performance plots indicator for forecasting (column 1) and regression (column2 and 3). ... 111 Figure 4.8: 0.6-0.3-0 correlation scenario – synthetic performance plots indicator for forecasting (column 1) and regression (column2 and 3)... 111 Figure 4.9: 0.8-0.4-0.2 correlation scenario – synthetic performance plots indicator for forecasting (column 1) and regression (column2 and 3). ... 112 Figure 4.10: 0.9-0.7-0.33 correlation scenario – synthetic performance plots indicator for forecasting (column 1) and regression (column2 and 3). ... 112 Figure 4.11: 0.95-0-0-0.3-0-0 correlation scenario – synthetic performance plots indicator for forecasting (column 1) and regression (column2 and 3). ... 113 Figure 4.12: 0.9-0.4-0.5-0.3-0.2-0.7 correlation scenario – synthetic performance plots indicator for forecasting (column 1) and regression (column2 and 3). ... 113 Figure 5.1: Topology of a toy network to showcase throughout the chapter the definitions of the proposed CoNL route choice model... 120 Figure 5.2: Example of CoNL structure for the o-d pair 1-4 in the network in Figure 5.1... 121 Figure 5.3: Efficient choice sets with respect to the o-d pair 1-4 in the example of Figure 5.1. ... 125 Figure 5.4: CoNL specification provided by the double-step algorithm for the o-d pair 1-4 in the network in Figure 5.1. ... 128 Figure 5.5: Daganzo and Sheffi (1977) test network: topology and link cost structure. ... 130 Figure 5.6: Daganzo and Sheffi (1977) network: CoNL network levels for o-d pair 1-3 (top) and CoNL structure for destinations 2 and 3, given origin 1 (bottom). ... 131 Figure 5.7: Daganzo and Sheffi (1977) network: network levels and mixing components resulting from the application of the single-step illustrated in Section 5.4.1.2. ... 131 Figure 5.8: Braess’ network: link costs ... 132
8
Figure 5.9: Braess’ network: CoNL structure for o=1 and d=2,3,4 respectively. ... 133 Figure 5.10: Mesh network: topology and link costs. ... 135 Figure 5.11: CoNL mixing components and corresponding nesting structure (elemental alternatives not illustrated for the sake of brevity) for the network of Figure 5.10, o-d pair 1-12 ... 135 Figure 5.12: Sioux-Falls network, South Dakota. ... 138 Figure 6.1: Regione Campania zoning (TransCad screenshot). ... 168 Figure 6.2: Grid network (Figure 5.1): CoNL specification for o-d pair 1-4 with the exhaustive acyclic choice-set. ... 169 Figure 6.3: Screenshot of the SNL software developed in Matlab R2018a. ... 170
9
List of tables
Table 2.1: GEV generating functions for well-known GEV models. ... 23
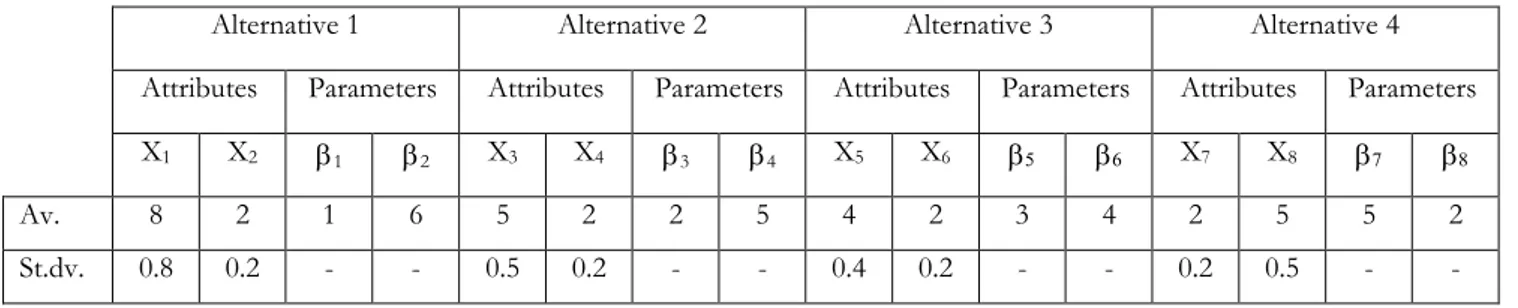
Table 3.1: Model estimation on SP survey for six alternatives mode choice Naples-Milan - Attributes for the six alternatives choice scenario. ... 79
Table 3.2: Model estimation on SP survey for six alternatives mode choice Naples-Milan – Multinomial Logit and Nested Logit estimation results. ... 86
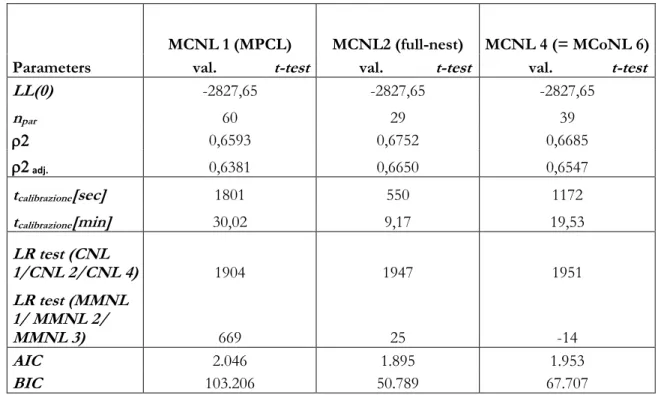
Table 3.3: Model estimation on SP survey for six alternatives mode choice Naples-Milan – CoNL estimation results. ... 88
Table 3.4: Model estimation on SP survey for six alternatives mode choice Naples-Milan – Cross Nested Logit estimation results. ... 92
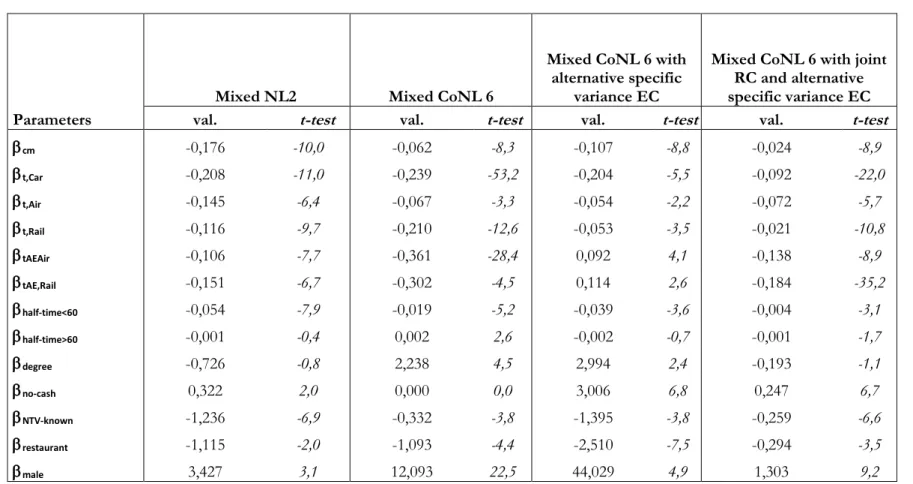
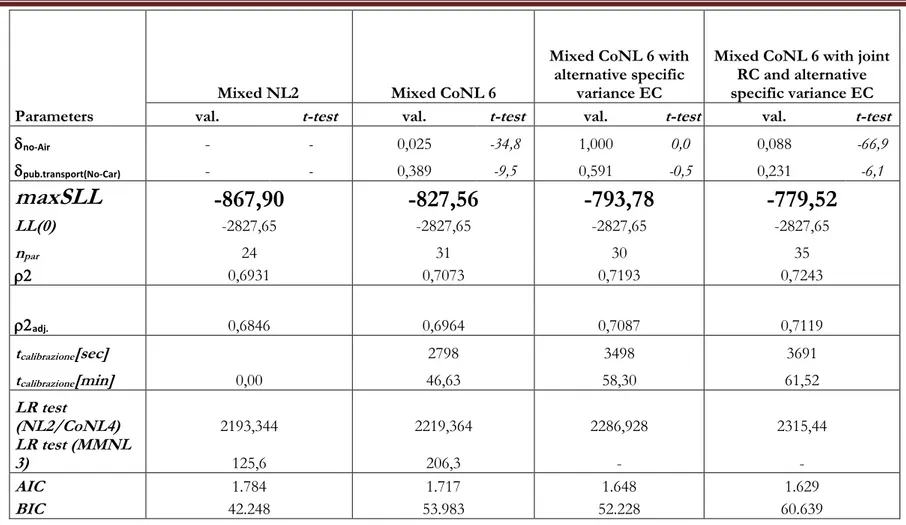
Table 3.5: Model estimation on SP survey for six alternatives mode choice Naples-Milan – Mixed Logit estimation results. ... 95
Table 3.6: Model estimation on SP survey for six alternatives mode choice Naples-Milan – Mixed CoNL estimation results. ... 97
Table 3.7: Model estimation on SP survey for six alternatives mode choice Naples-Milan – Mixed CNL estimation results. ... 102
Table 4.1: Experimental setting. ... 107
Table 5.1:– Illustration of the iterations of the algorithm described in Section 5.1.1 for the o-d pair 1-4 and the efficient routes depicted in Figure 5.3. ... 128
Table 5.2: Daganzo and Sheffi (1977) network: route choice probabilities for the o-d pair 1-2, under the link cost configuration c→10, h→0 and k=1 ... 132
Table 5.3: Braess’ network: route choice probabilities for the o-d pair 1-4. ... 134
Table 5.4: Route choice probabilities for the o-d pair 1-12, on mesh network with long bypass in Figure 5.10. ... 136
Table 5.5: Route choice probabilities for the network in Figure 5.1, o-d pair 1-4, with the link cost configuration c1-2=c8-4=3, c7-3=2 and 1 for all remaining links. ... 137
Table 5.6: Route choice probabilities for the Sioux-Falls network of Figure 5.12, o-d pair 1-15. ... 139
Table 6.1: SNL CoNL algorithm without explicit enumeration of routes. ... 152
Table 6.2: Simplified SNL CoNL algorithm without explicit enumeration of routes. ... 153
Table 6.3: Braess network, o-d pair 1-4 – Comparison of link flows. ... 155
Table 6.4: Mesh grid network with bypass, o-d pair 1-12 – Comparison of link flows. ... 156
Table 6.5: Sioux-Falls network, o-d pair 1-15 – Comparison of link flows. ... 158
Table 6.6: Sioux-Falls network – Computation time. ... 159
Table 6.7: Braess network – Target correlation matrix and reproduced correlation values for the compared route choice models. ... 162
Table 6.8: Mesh network with bypass, o-d pair 1-12: ID of the routes. ... 163
10
Table 6.10: Mesh network with bypass: target Daganzo and Sheffi correlation matrix for routes connecting the o-d pair 1-12. ... 164 Table 6.11: Sioux-Falls network: target Daganzo and Sheffi correlation matrix for routes connecting the o-d pair 1-15. ... 165 Table 6.12: Mesh network with bypass, o-d pair 1-12 –MSE indicator for reproduced correlation values. ... 166 Table 6.13: Sioux-Falls network, o-d pair 1-15 - MSE indicator for reproduced correlation values. ... 167 Table 6.14: Log-likelihood computation for the compared models. ... 170
11
Chapter 1: Introduction
1.1 Overview of choice modelling issues
People make choices every day. Many choices have a strong impact on the quality or their life.
Each day a person wakes up and chooses which action he1 wants to do before, what to have for
breakfast, what to wear, what time to go outside, how to manage his/her day by virtue of the budget and time constraints, which place to move to and how, which activity to do, which one to do before or after and so forth. There are choices that are not made every day, but they have a strong impact on the decision maker’s well-being. In fact, sooner or later, a person will decide his household location, whether to own a car, the typology and the vehicle model, whether to own a pet, which breed or size, how many children to have, in which school register them and much more.
Some of the above-mentioned choice examples involve mobility. Thus, it is easy to recognize why these kind of choices form the basis for the planning and policy actions in the transport field. What is called, at aggregate level, congestion or traffic, represents the sum of individual choices that everyone makes at different levels: do I move? What time do I move? Where I want to go? Which transport mode do I want to use? What itinerary do I travel?
This kind of choices, that can be termed transport choices, relating the so-called travel behaviour, are characterized by a significant modelling complexity. If, for example, an analyst wants to model the choice of the place to go (destination choice), this means that he should, in order: identify the set of all the feasible destinations, understand which sub-set a decision maker actually considers and consider the factors influencing the choices of a place rather than another one. Modelling the route choice means: representing all the elemental phases to make a trip, taking into account the significant quantity of alternatives depending on them, taking into account the similarities between the alternatives and how the perception of the choice set is influenced by these similarities, understanding which routes are more relevant (fast routes, highways, no lights, sightseeing roads), just to name a few aspects.
Many typologies of choices can be involved. Some of them are discrete, i.e. made in a finite choice set (e.g., transport mode to be used), while some of them are continuous, i.e. made on an infinite choice-set (e.g., time of departure to go outside). Moreover, the strategies of the decision makers could be different when choosing an alternative: maximizing the benefit, minimizing the undesirable effects, minimizing the risks, choosing the first alternative that allows for a minimum degree of satisfaction, choosing by thinking of collective benefits or on the basis of other people choices and so forth.
The random utility theory represents the most widely used paradigm in modelling the behaviour of people who make choices. It starts form the homo-economicus assumption, which states that the decision makers want to maximize their benefit when they choose a certain alternative. Quoting Simon (1978):
12
“The rational man of economics is a maximizer, who will settle for nothing less than the best.”
The random utility models (RUMs2) are discrete econometric models. The term “econometric”
refers to the fact that they are generally used downstream of having performed a regression on real data. The term “discrete”, instead, indicates that their outcomes (the dependent variable) assume a finite number of values. Going back to Taussig (1912), as reported in McFadden (2001):
“An object can have no value unless it has utility. No one will give anything for an
article unless it yield him satisfaction. Doubtless people are sometimes foolish,
and buy things, as children do, to please a moment’s fancy; but at least they think at
the moment that there is a wish to be gratified.”
Practically, the RUMs are mathematical models simulating the behaviour of a decision maker, whose choice set is finite, whose alternatives are distinct from each other, by means of an entity called perceived utility. This perceived utility, unknown to the analyst, can be represented as a random variable. This randomness, according to the econometric approach, is given by a lack of knowledge that an analyst has when modelling people’s behaviour. According to the psychometric approach, instead, the randomness is inherent in the decision maker.
Generally, such perceived utility is defined as a function of observable quantities (attribute/regressors), and the choices are reproduced (with some model errors) as a non-linear function of such utilities. In other words, it is impossible to reproduce deterministically a value of 1 or 0, respectively, if the decision maker chooses or does not choose the given alternative. Thus, an intermediate value can be reproduced, which can be interpreted as the probability of choosing the given alternative. Such a choice probability operationally needs the density function of the perceived utilities, and therefore, in general, involves some multi-dimensional integral computation. Sometimes (as deepened in Chapter 2) the choice probabilities can be computed with an analytical closed-form, while sometimes not and, therefore, the integral form stays, requiring simulation.
The issues that an analyst must face when he models choice probabilities are multiple. Mainly, the choice criteria could be different among the individuals (decision rule). The choice set could be different (choice set formation). The relevant quantities playing a role or, in other words, the utility functions, could be different (relevant attributes). Each measure of the observable quantities can be affected by some errors (error measures). The tastes, i.e. the importance that the decision makers attach to a certain attribute, can be different (inter-respondent taste heterogeneity), just like for the same decision maker they could vary over time or across different choice scenarios
(intra-respondent taste heterogeneity). Two or more alternatives can be perceived as very similar and thus
not perfectly disjoint (inter-correlation among alternatives or substitution pattern). For some alternatives, the perception of the utility could be affected by more randomness (heteroskedasticity). There may be more random decision makers than others (scale heterogeneity). There can be factors that are latent but they influence the choices (latent constructs). The past (history), the personal inclinations (attitudes) and the habits to choose always a given alternative only because previously made (inertia) can strongly influence the current choices. Some unobservable components can influence the observable quantities (endogeneity). When an
2 Sometimes the acronym RUM means Random Utility Maximization, and the relative models are indicated with RUM
13 individual states a choice on some hypothetical scenarios, he/she could make some errors due to the fact he/she has a biased perception of the scenario itself (stated preference effect).
For facing these modelling issues, the analyst needs models that are theoretically robust, i.e. capable to handle different problems in different situations. However, such models must be also operational. The theoretical background of a model is essentially represented by the stochastic assumptions made on the random part of it, that is on the perceived utilities. The fact of being operational, on the other hand, depends on the degree of simplicity, intuitiveness and computational cost necessary to work with it.
In this regard, obtaining a complex model as a mere combination of easier component models, may represent a good answer to these two questions. In fact, if the constituent bricks are chosen appropriately, combining models allows leading to a more general theoretical model. Moreover, it can help to better understand the complex model obtained and, consequently, to make it more easily operational.
1.2 The CoRUM basic idea
The conceptual-vehicle of the Combination of random utility models (CoRUM; Papola, 2016) is just the one described in the premise, i.e. obtaining a complex model by combining easier models. The idea is to fill the gaps of the existent models, creating a simple way for unifying their advantages. Combining partially general models could allow obtaining a model that is more general. This is the idea behind the CoNL model, a particular specification of the CoRUM, investigated by Papola (2016). The target of the CoNL is mainly reproducing the inter-correlation effects among utilities of the alternatives in a flexible way. Furthermore, the CoNL has the computational advantage of being a closed form models, thus not requiring simulation. It has been tested in a transport mode-choice survey on a dataset of about 1000 individual
choices in a seven alternatives scenario. The seven alternatives were: car, high-speed train (1st
and 2nd class), Eurostar train (1st and 2nd class) and Intercity train (1st and 2nd class). This was a typical context wherein the inter-correlations among the alternatives have an high impact on the choice probabilities. In fact, six alternatives of the total seven were train alternatives,
divided into 3 different kinds of train, each one with its 1st and 2nd class options. The proposed
CoRUM showed both the best goodness of fit and the best prediction results, compared with other complex models available in literature.
However, the CoRUM framework seems much more general and it potentially allows accommodating other crucial choice modelling issues. To date, in fact, there are some complex general models (see Mixed Logit; McFadden and Train, 2000) that require multi-dimensional integral simulations. But, by now, the latter do not scare when the integral simulation is performed on a few dimensions. However, in order to be more flexible, they need to add many dimensions of integration, with a prohibitive computational burden. In addition, there are other difficulties in estimating them, especially when using classic gradient-based methods. Under the CoRUM framework, instead, this generality can be achieved, for example, by combining a basic complex model formulation with other easier models formulations.
Another relevant question arises when using complex models, I whatever way they are obtained. How does their adding complexity reflect on the forecasting capability? Can we measure the danger of creating an instrument very capable of fitting real observations but incapable to make correct predictions? This is an interesting aspect to be investigated, to better understand the trade-off between adding complexity and effectiveness in different choice scenarios.
14
Furthermore, with reference to specific problems of travel demand estimation, the advantage of such a general framework can be used for solve some important theoretical and operative problems. For example, the route choice modelling have some peculiarities. The similarities among alternative routes, given by their physical overlapping, surely represents one of these. This similarity generates a positive correlation between their perceived utilities. Moreover, the number of routes generally involved is very high, if we compare it with other choice contexts, given the size of a real-world network. That means the correlation scenario can be very complex, thereby requiring a model with robust theoretical assumptions. The CoRUM, particularly the aforementioned CoNL specification, can be the answer to this complex operational question.
1.3 Objectives and contributions of the thesis
This thesis, as far as the general discrete choice theory is concerned, focuses on some of the choice modelling problems mentioned at the end of Section 1.1. Particularly, these problems are the substitution patterns among the alternatives, the inter/intra-respondent taste heterogeneity and the heteroskedasticity. The latter have certainly received the most attention in the discrete choice literature over the last five decades. Particularly, in the current thesis, concerning the inter-intra respondent taste heterogeneity and heteroskedasticity problems, a new model formulation has been proposed, aiming at providing a more practical formulation than that currently implemented in the software and analysed in the literature, obtained by a generalization of the current CoRUM framework (Chapter 3). The inter-correlations impact, on the other hand, has been analysed both in terms of ability to reproduce observed choices and in terms of predictive unbiasedness, analysing the main closed-form models of the literature, and contrasting them with the CoNL model (Chapter 4). These proposed advances are general and crosscutting to several other scientific fields than transport. The main application of Chapter 3, however, refers to a typical inter-urban transport mode choice. Furthermore, the formulations proposed in Chapter 3 could be easily introduced as kernel within other theoretical paradigms. In fact, sometimes the framework of the mathematical models used under different discrete choice theories can be equal (for example, the random utility models and the random regret minimization models have the same structure, but their arguments are different: in the first case is the perceived utility, to be maximized, in the second case is a combination of unpleasant effects, to be minimized).
The other advances proposed in the current thesis, on the other hand, are transport field-specific. The main transport problem addressed in the current thesis relates the route choice. In fact, as described in Section 2.3, the route choice models represent the core of traffic assignment problem and, therefore, of the traffic simulation. It surely represents the more demanding choice dimension (Cascetta, 2009) to be modelled, given its inherent complexity. A first problem comes from the size of a real-world network and the number of feasible alternatives that a decision maker could consider. A second problem is how the decision maker considers the alternatives that are highly overlapped and what is the impact on the probability that he
chooses one of them3. The latter is a very challenging theoretical problem. Several existing
models, with different basic assumptions, try to address it. Some of them consider the overlapping problem roughly, but they have proven to fail in several contexts (see Section 2.3.2 for relevant papers quoting this aspect). Other models address it with specific theoretical assumptions, but they can be very difficult to be used, given their computational complexity.
15 Consequently, in order to make them operational, it is necessary to formulate simplified hypothesis, which, however, imply the introduction of a bias in the choice probabilities they compute. This thesis proposes a new route choice model, namely the CoNL route choice model (Chapter 5), which allows very complex correlation patterns. The model is made operative by means of opportune algorithms that allow it to work on any network, without requiring neither the estimation of a large number of parameters, nor simulation procedures. Chapter 6 goes further, providing some advance on route choice modelling and, particularly, on the novel CoNL route choice model, allowing implementing an algorithm, that is theoretically consistent with the CoNL route choice model, for computing traffic flows, without the need to explicitly consider the routes, thus avoiding the operation computationally more onerous at stake. This and other algorithmic advances are proposed and tested on various aspects: choice probabilities, correlations reproduced and computed traffic flows. Several applications are presented both on toy networks and on a real big network (more than 500.000 road links), to show the goodness of fit measures of the CoNL model with reference to models of literature that are mainly implemented within the commercial software.
1.4 Thesis canvas
The thesis is structured as follows:
Chapter 2 reviews the state of the art on random utility theory and its application to route choice. In particular, the Section 2.1 provides the basic setup for the description of RUMs; Section 2.2 reviews the random utility models available in the literature, with reference to the two main problems of the error structure (inter-correlations and heteroskedasticity problems) and the inter/intra-respondent taste variation; Section 2.3 briefly summarizes the main applications of the random utility theory to the route choice problem; Section 2.4 describes the main assumptions of the Combination of random utility models (CoRUM) as a general framework for modelling discrete choices, with particular reference to travel choices.
Chapter 3 investigates more general specifications of the CoRUM than those previously analysed, allowing accommodating also the taste heterogeneity and the heteroscedasticity, in particular by combining mixtures of RUMs. To this end, the chapter proposes a theoretical generalization of the CoRUM framework and a real-world application on data collected on a stated survey of 1688 observations of 211 respondents. This is a forthcoming paper named:
Tinessa, F., Marzano, V., Papola, A., (forthcoming). “Combination of random utility models
for accommodating taste variation and flexible substitution patterns”.
Chapter 4 represents an estimation exercise with applications on future scenarios on the main closed form random utility models, on synthetic datasets with variable sample sizes and complex underlying correlation scenarios. Such correlation scenarios, on the other hand, can be representative of typical mode choice or route choice contexts. The aim of this chapter is investigating the potential of the CoNL (and the other models) in terms of forecasting, and comparing it with the models goodness of fit performances. The chapter entirely reprises and extends the set of experiments of the work published as:
16
Tinessa, F., Papola, A., Marzano, V., 2017. “The importance of choosing appropriate random
utility models in complex choice contexts”, M.T.-I.T.S. Conference Proceedings, 26-28 June
2017, Naples.
Chapter 5 proposes a new route choice model obtained under the CoRUM framework. It describes an algorithm to generate a CoNL specification, allowing detecting a set and a composition for the components of the model, and a way to compute all the structural model parameters, whatever the network. It has been published as:
Papola A., Tinessa F., Marzano V., 2018. “Application of the Combination of Random Utility
Models (CoRUM) to route choice”, Transportation Research Part B (111), 304-326.
Chapter 6 is currently an original contribution of this thesis and describes several advance compared to the published work in Chapter 5. In particular, an implicit enumeration algorithm theoretically consistent with the CoRUM route choice model,is proposed and tested on toy networks; an in-depth analysis of the complex route choice models is carried out on their ability to reproduce complex correlation scenarios, drawing important conclusions, both theoretical and applicative, on the novel CoNL route choice model, proposed in Chapter 5, and on the existent Link Nested Logit model; some practical advance on the original route choice model is proposed and tested both on toy networks and on a real network (Region Campania network). The goodness of fit of the CoNL route choice has been analysed and compared with the one of the other route choice models, using real observations collected by means of GPS detection of about 200 trajectories.
Chapter 7 reports a summary of the conclusions reached in the whole thesis and proposes several ideas for future research steps.
17
Chapter 2: State of the Art
2.1 Random utility theory – general assumptions
The choice modelling discipline is very broad and it embraces several sub-areas. The current thesis work focuses on random utility theory. The random utility models (RUMs) start from neoclassic micro-economic assumption that a decision maker searches for the maximum benefit in his choices. Particularly, it is assumed that the decision maker is rational, he considers a choice-set of alternatives and chooses the one that maximized his perceived utility. The latter, in general, can be seen as a function of several quantities that are observable (sometimes measurable or, eventually, ranked or dummies) and other quantities that are not observable. Since the presence of the latter, the perceived utility is an unknown quantity for the analyst.
Random utility
Attempting to embrace various formalizations of the problem (McFadden, 1974; Ben-Akiva and Lerman, 1985; Swait and Bernardino, 2000; Bierlaire, 2003; Train, 2009) in a general way, this thesis starts from the assumption that the perceived utility of the alternative i, for the decision maker n, facing a choice scenario (or choice task) t for a number of alternatives m, can be expressed as: , , , , , ( ; ) C n t n t n t n t n t i i i i U U V i (2.1) where:
Uin,t is the value of the perceived utility of the alternative i, for the decision maker n, facing
the choice scenario t;
Vin,,t is the expected value, so called systematic utility4, of the perceived utility of the
alternative i, for the decision maker n, facing the choice scenario t;
in,t is the unobservable term of Uin,t, so called random residual5 (Cascetta, 2009) or disturbance
or error. This term includes, with reference to the econometric approach, all that is unknown to the analyst, while according to the psychometric approach, all that is intangible to the decision maker. The assumption is that E[in,t]=0, i Cn t, i , as in the regression models;
Cn,t is the choice set considered by the decision maker n, facing the choice scenario t;
4 Sometimes improperly called observable part of the utility, in the current work, the Vin,,t simply means the expected value of the Uin,t..
5 Here it is assumed a different meaning for the random term in,t , that is “less inclusive” with reference to the definitions of Train (2009) and Cascetta (2009). It does not include all the randomness inherent the behavioural analysis, because some of them will be explicitly included into the taste coefficients, for better setup the discussion of the successive topics of the thesis.
18
The systematic utility Vin,t, in turn, can be expressed as a function of quantities that are
observable Xk,in,t, so called attributes/regressors or explanatory variables6, and other quantities
k,in,t, so called parameters/coefficients, representing the marginal utility for the alternative i with
reference to the attribute k. In other words, the generic k,in,t quantifies the importance that the
decision maker n in the choice task t gives to the kth attribute of the ith alternative’s perceived
utility.
Consequently, the expression (2.2) can be written as:
, , , , , , , , ( ; ; ) C n t n t n t n t n t n t i i k i k i i U U X i (2.2)
Additive and multiplicative approaches
Two main approaches can be adopted, depending upon how the systematic term Vin,t is
combined with the unobservable random term in,t:
additive R.U.M.) , , , , , , , , ( ; ) C n t n t n t n t n t n t i i k i k i i U V X i (2.3)
Wherein the random residuals in,t are adding noises with reference to the Vin,t.
multiplicative R.U.M.) , , , , , , , , ( ; ) C n t n t n t n t n t n t i i k i k i i U V X i (2.4)
Wherein the random residuals in,t are amplifiers of the disturbances as increasing
functions of the expected values of the perceived utilities Vin,t. Furthermore, Dagsvik (1995)
generalized the definition of random utility models with the definition of interpersonnel RUM. However, the current thesis focuses on the additive random utility models (ARUMs). Particularly, a linear in parameters specification of the systematic utility will be always assumed. In this way, the (2.3) can be expressed as:
, , , , , , , C n t n t n t n t n t i k i k i i k U
X i (2.5)In the (2.5), obviously, the notation Xk,in,t can indicate, in general, a function of observable
quantities. In the following, the (2.5) will be the main vehicle to show the main differences among all the random utility models described in Section 2.2.
Maximizing benefit behaviour
Defining yin,t as a binary variable assuming values 0/1, respectively, if the actual choice of the
individual n in the choice task t is or is not represented by the alternative i, what has been said in the premise of the current chapter can be easily formalized as follows:
, , , ,
(U ;C )
n t n t n t n t
i i
y d (2.6)
where dn,t indicates the decision rule, i.e. the synthesis of all the rules according to which the
decision maker n chooses i when facing t, in the choice-set Cn,t. In the random utility theory
case, dn,t summarizes the assumption of homo-economicus above described, who chooses the
alternative that maximizes his/her perceived utility. Thus, the (2.6) can written more explicitly as:
6 It will be assumed the exogeneity hypothesis, i.e. that the attributes and the random terms are stochastically independent.
19 , , , , , 1 , C , 0 n t n t n t n t j j i n t j y U U i j i y otherwise (2.7)
Extending the concept, by suppressing the superscript t, we can indicate with yin the result of a
sequence of choices for the individual n.
A choice obeying the maximizing benefit behaviour must respect three intuitive axioms (Debreu, 1954; Block and Marschak, 1959):
- Completeness: a decision maker is always able to make a binomial choice between whatever pair of alternatives a and b. In this case, the exact term is weak preference between the two, because, in a repeated choice situation with the same scenario, the decision maker could actually make another choice. The strong preference represents the opposite concept, i.e. the decision maker do prefer a to b always if he faces the choice task infinite times.
- Transitivity: if a decision maker prefers a to b and b to c, he will prefer a to c;
- Continuity7: an infinitesimal variation in a relevant attribute value does not vary the
preference of a certain alternative;
In the following, a general framework will be presented, i.e. the random utility theory, wherein the three above-mentioned axioms represent a pre-condition for make a model operative.
Random utility maximization models (RUMs)
Starting from (2.7), a generic random utility model is a mathematical relationship whose outcome is the probability of observing that a given alternative j is chosen by decision maker n
in the choice task t within the choice set Cn,t:
, , , , , , , ( ) Pr , C , Pr 0, C , n t n t n t n t n t n t n t j i j i p j U U i j i U U i j i (2.8)And given (2.3) it (2.8) can be also written as:
, , , , , , ( ) Pr , C , n t n t n t n t n t n t j i i j p j V V i j i (2.9)That is needed just to emphasize three relevant aspects. First, such probability depends entirely on the utilities differences, while the absolute values of the utilities do not matter. This represents a fundamental of the random utility theory, implying that the only parameters that can be estimated are the ones that allow to define the utilities differences. Second, when
multiplying the utility values for a scale factor, the pn,t(j) does not change. This leads to another
fundamental of the random utility theory, i.e. that the scale does not matter. Thus, quoting Train (2009), “only differences in utility matter and the scale is arbitrary”. Third, the choice probability essentially depends on how the random terms within the perceived utilities is distributed. As better described in the following sub-sections, the scale is directly linked to the variance of the perceived utilities.
A different interpretation for the pn,t(j) can be given in a similar linear regression fashion. The
probability pn,t(j) is the regression value of yn,tj affected by an error, averagely distributed with 0
mean (Dagsvik, 2004). As it will be seen, a random utility model is effectively a non-linear regression model in regressors with a discrete outcome.
The (2.8) can be translated into an operative formulation, by assuming the vector U of the
perceived utilities Uin,t distributed with a specific density function f(U), as:
20 , , , , , , m , , 1 m 1 , , , , m 1 m 1 , ( ) .... ( ) n t n t n t n t n t n t j j j j n t n t n t n t n t j U U U U U U U n t U U U U p j f d
U U (2.10)And the (2.9), indicating with and , respectively, the vectors of the in,t ‘s and the k,in,t’s, leads
to: , , , , , , , , , , m 1 m 1 , , , , m 1 m 1 , ( ) ... ( , ) n t n t n t n t n t n t n t n t n t n t j j j j j j j n t n t n t n t j V V V V V V n t p j f d d
β β ε β ε (2.11)wherein f(,) is the joint distribution of the and the. It has been noted that in the range bounds of each integral the Vin,t appears as a function of the k,in,t, under this framework
assumed in Section 2.1.1. Thus, the (2.10) and (2.11) integrals are multi-dimensional, with
dimension m in the space of the U. The same is an integral with m + n dimensions in the
space of the and wherein n represents the number of the coefficients k,in,t’s. However,
they can be expressed in the space of the differences between the perceived utilities, leading to an (m-1)-dimensional integral. The same applies when working in the space of the and
leading to an (m-1+ n)-dimensional integral. The difference can be made with reference to
anyone of the alternatives utilities/random terms taken as touchstone. For example, taking the
alternative j as touchstone, indicating with Wj the vector of the differences Uin,t – Ujn,t, and with
j the vector of the differences in,t – jn,t, the choice probability can be expressed as:
, , , , , , , , m 1 2 m 1 , , , , , , , , m 1 2 m 1 0 0 0 0 , ( ) ... ( ) n t n t n t n t n t n t n t n t j j j j n t n t n t n t n t n t n t n t j j j j U U U U U U U U n t j j U U U U U U U U p j f d
W W (2.12) , , , , , , , , , , , , , , , , m m 1 1 2 2 m 1 m 1 , , , , , , , , m 1 2 m 1 , ( ) ... ( , ) n t n t n t n t n t n t n t n t n t n t n t n t n t n t n t n t j j j j j j j j n t n t n t n t n t n t n t n t j j j j V V V V V V V V n t j j p j f d d
β β Λ β Λ (2.13)Another representation of choice probability is very interesting for our purposes. Quoting the introduction chapter of Train (2009), and adapting it with the introduced (2.2) (wherein, differently from Train, the marginal utilities are, in general, variable with individual n and choice situation t) consistently with the notation above defined, a binary 0/1 indicator Ijn,t can be
defined as a function of observable and non-observable quantities, as:
, , , I ( , , ) 1 1 I ( , , ) 0 n t n t j j n t j h j if y h j otherwise X β ε X β ε (2.14)This means, the probability of choosing the alternative j can be seen as the expected value of
Ijn,t over joint density f(,). Such expected value can be expressed as:
, , ( ) I ( , , ) ( , ) d n t n t j p j
h j f d β ε X β ε β ε β ε (2.15)Other authors (for instance, see Train,2009) refer this formulation, giving to the meaning of the whole random part of the perceived utility, i.e. incorporating the random part of . However, assuming the current thesis framework, the assumption on the joint density is generally that and are independent, thus giving f(,)=f()f().
Whatever definition of pn,t(j) is made, it is clear that (2.15) represents a multidimensional
integral, in the differences or in the single alternatives random terms space, and it has to be analytically solved or simulated. As described in Section 2.2, under opportune assumptions, the integral have a closed form solution.
21 The following section contains a review of the state of the art of the main random utility models analysed in literature.
2.2 State of the art of RUMs
The literature on choice modelling is very wide, being the latter a powerful transversal tool for many scientific areas. A lot of general and theoretical contributes to this discipline are trackable in economic, psychometric, transport, biological, healthcare and several others scientific fields. In fact, not infrequently a general mathematical model has been proposed to answer some very specific problem. This thesis work does not embrace all relevant issues analysed in scientific literature, but mainly focuses on some well-established lines of research. In Chapter 1, several choice modelling issues have been mentioned. Particularly, two main problems has always been recognized as very relevant, not only for transport aims the error structure assumptions on random terms and the taste heterogeneity. The proposed state of the art investigates the main random utility models, with reference to these two fundamental problems.
Error structure
The main assumption of the current sub-section is that marginal utilities j,kn,t ‘s are not
randomly distributed across population of individuals n and choice scenarios t, i.e. f() and its dimensions of integration are suppressed from (2.15). As clarified in the previous section, this is just a pedagogical assumption, to create a clear cut between the two phenomena. Actually, in real-world applications there is not the possibility to create such separation between the two. As mentioned in Section 2.1.4, a random utility model involves some multi-dimensional integrals computations. Whenever (2.15) does not have a closed form solution, this means involving simulation.
The first random utility models family totally avoids this computational problem, by making some appropriate assumptions on f() and, therefore, on f(U). Unfortunately, it is not always possible to resort to these easier tools, and, in general, closed form models actually exhibit some limitations. Other models that do not have closed form solution need to be specified in a way to ensure the computation of the integral is feasible. Although these models are harder to work with, the advantages, whenever possible, are not negligible. Particularly, three main problems can be identified, with reference to error structure of random terms:
- Heteroskedasticity;
- Substitution across alternatives;
- Correlation of the random terms over time;
For a more comprehensible discussion, it is better to make the more didactic, but unrealistic
assumption, that parameters k,in,t do not vary across respondents and choice situations. This
problem, i.e. the second one presented in the premise of this chapter (taste heterogeneity), will be discussed in Section 2.2.2. In this sub-section, the choice to isolate the two effects has exclusively a clarifying aim. Another assumption of the section, that is actually very common in literature, is that the error structure of the jn,t ‘s is keep fixed across the observations. The
reader can refer Swait and Bernardino (2000) for a relaxation of this assumption in a three tran-oceanic air travels choice context.
22
2.2.1.1 GEV models
The GEV family (Mac Fadden, 1978) represents a wide class of random utility models. The underlying assumption on random residuals is that they are distributed as Multivariate extreme value (MEV). Although chronologically this brilliant generalization has come after the existence of the simplest and best-known GEV family exponent, i.e. the Multinomial Logit (Luce, 1959), the GEV family will be presented at first, and the main GEV models will be summarized in the following sub-sections, briefly describing their properties and limitations.
Specifically, a GEV model can be always represented in this way:
, , , , , , , , exp( ) ( ) exp( ) n t n t n t j j n t n t j n t n t n t j V G Y p j G G V G (2.16)
Wherein G is the so termed GEV generating function and, apart from superscripts n and t, Gj
represents its first order derivative with reference to Yj, in turn defined as the exponential of
systematic utility of j, while m is a constant defining the degree of homogeneity of the function G. The latter is defined strict utility function in psychologists’ literature (Domencich and McFadden, 1975). Thus, the GEV family models represent a wide class of closed form models, whose underlying distribution and the choice probabilities (2.16), are defined by assuming an appropriate formulation for the function G.
McFadden (1978) and successive generalizations (Ben-Akiva and Francois, 1983) exposed the main properties of the GEV generating function G, to give a GEV model, as follows:
1) Non-negativity ∀ Vjn,t, i.e. ∀ positive value of Yjn,t (Daly and Bierlaire, 2006);
2) Homogeneity of degree ;
3) Positive divergence when each Yjn,t. goes to +∞;
4) Non negativity of kth cross partial derivatives in Yin,t , with j≠i, when k is odd number;
5) Non positivity of kth cross partial derivatives in Yin,t , with j≠i, when k is even number;
It is possible to demonstrate (Cascetta, 2006), that:
- a cumulative distribution function of residuals given by F( )ε exp(G), where F is a
function of the residuals as GG(exp(ε)), is MEV distributed;
- the mean of maximum between perceived utility values is equal to
, , 1 , max[ ] ln( ) n t n t n t j j C E U G
where is the Euler-Mascheroni’s constant
(0.57721566…); and, obviously, the (2.16).
Dagsvik (1994) analysed the generality of the GEV models, indicating that a GEV model could theoretically mimic effectively every possible random utility structure.
Based on the above mentioned properties, several models will be presented. The assumptions on G for the main models is reported in Table 2.1. All indexes involved in the formulations will be discussed in the following sub-sections.
Multinomial Logit
Multinomial Logit, as mentioned above, represents the first GEV family member, but its birth comes before the GEV class birth. Luce (1959) was the first to propose the following Logit formula:
23 Multinomial Logit) , , , C exp( ) n t n t n t i i V G
(2.17) Nested Logit) , , K exp( ) k n t n t i k i k k V G
(2.18) Cross Nested Logit) , , K exp( ) k k n t n t i ik k i k k V G
(2.19) Pair Combinatorial Logit) , , m 1 m , , , 1 1 exp( ) exp( ) ij ij ij n t n t j n t i i ij j ij i j i ij ij V V G
(2.20) FinMix) ,
, ,
C c n t c n t c G G
(2.21)Table 2.1: GEV generating functions for well-known GEV models.
, , , , exp( ) ( ) exp( ) n t n t j n t n t i i C V p j V
(2.22)Wherein is the inverse of the so-called scale parameter. In additive models, the scale of
systematic utilities does not affect the choice probabilities. Luce started from the assumption of
Independence of irrelevant alternatives, or, as more intuitively called by Block and Marschak (1959), the independence from added alternatives. Actually, Luce saw this property as desirable, expressing the
following concept: if a new alternative k is added to the choice set, the ratio between the choice probabilities of any pair of alternatives j and s does not change. In fact, according to (2.22), the ratio would be:
, , , , ( ) exp( ) ( ) n t n t n t j i n t V V p j p i (2.23)
i.e. it is not affected at all by the introduction of k. This ensures the consistence with the maximizing utility axioms (Marschack, 1960). Marley (Luce and Suppes, 1965) demonstrated that the (2.22) descends from an i.i.d. Gumbel assumption on random residuals. McFadden (1974) demonstrated the Logit formula necessarily implies extreme value distribution for random residuals. Thus, the i.i.d. Gumbel assumption is both necessary and sufficient for (2.22). Recently Ye et al. (2017) proposed a practical test for the validity of the Gumbel assumption when estimating a MNL on a given sample. This is consistent with (2.17), because:
, ,
, ,
,
C C
( ) exp( ) exp exp( ) exp exp( )
n t n t n t n t n t i i i i F G
ε (2.24)that represents the product of identical Gumbel distributions for each i. This means the
Multinomial Logit assumption is that residuals are independently distributed as Gumbel with
the same variance parameter . More succinctly, this is well-known in literature as the i.i.d.
24
the same for all alternatives, the model (as all GEV models) is homoscedastic. The variance parameter is the inverse of the scale and it flattens the differences between choice probabilities when it rises. Conversely, when it decreases, it emphasizes the choice probability of the maximum systematic utility alternative, that goes to 1. On the other hand, an infinite dispersion means null capacity of the analyst to explain the phenomena, whilst 0 variance means perfect knowledge, i.e. a deterministic scenario.
However, (2.23) actually represents the main limitation of Multinomial Logit. In fact, (2.23)
implies proportional substitution across alternatives. In other words, when a Vjn,t
rises/decreases is immediate to recognize that the choice probabilities of j rises / decreases and the other choice probabilities decrease/rise the same relative quantity. This has potentially undesirable forecasting implications, because several could be the situations wherein the market share choosing an alternative could be penalized more than the one of another alternative. Famous example of the counter-intuitiveness of this result are reported in Chipman (1960), Debreu (1960), Daganzo and Sheffi (1977), Ortuzar (1983), Brownstone and Train (1999), Cascetta (2006), Train (2009). The most known are maybe the red bus/blue bus problem and the Daganzo network.
Thus, Multinomial Logit, as evident by the i.i.d. assumption (Gumbel is not relevant), does not allow for heteroscedasticity and inter-correlations between alternatives or random terms over time, i.e. none of the three problems mentioned in the premise of Section 2.2.1. A different approach for generalizing the Multinomial Logit model, whilst not renouncing to a closed-form expression for the choice probability, is represented by the Mother (or Universal) Logit model (McFadden, 1975). The idea is putting, in some ways, the observable attributes of the other
alternatives within the utility of the examined alternative8. Thus, no different assumptions on
random residuals are made, but, substantially, a different utility specification within the observable part. Examples of this framework are, with various declinations, the Dogit model (Gaundry and Dagenais, 1978), the Parametrized Logit Captivity model (Swait and Ben-Akiva, 1987), but, above all, the C-Logit (Cascetta et al., 1996) and the Path-Size Logit model (Ben-Akiva and Ramming, 1998). The last two, in particular, are route choice models, and they will be described in Section 2.3.2.2 and 2.3.2.3.
For an heteroskedastic formulation of Logit the reader can refer to Bhat(1995), who hypothesized a multivariate Gumbel distribution with different variance parameters for the alternative utilities. This leads to a formulation without closed form. It has received no interest in the practical applications given the successive strong development of the more general Mixed Logit model (see Sections 2.2.1.3 and 2.2.2.2). Other formulations that have not received an interest in the literature is the Negative Exponential model (Daganzo, 1978a) and the Weibull model (Beilner and Jacobs, 1971), both described in the book of Daganzo (1979). A model with an underlying Weibull assumption will be deepened in Section 2.3.3.4 for route choice applications, under some specific assumptions.
The strong limitations of Logit model, although its appealing great simplicity and the incomparable computational efficiency of its parameters estimation, has driven the researchers to move towards other more complex formulations. Although there are many situations wherein, with a good utility specification, it is possible to reduce the undesirable effects of Logit (it has been reminded that all the problems mentioned regards the unobservable components
8 This idea is very similar to the one of the Random Regret minimization (RRM) theory, as described in Mai (2017) for route
choice. However, in the RRM, the decision maker is assumed to choose the alternative who minimizes the perceived regret, rather than maximizing the perceived utility.
25 of the perceived utilities), unfortunately, in the practical applications, often it could be convenient to opt for other models.
Nested Logit
The Nested Logit model (partially) relaxes the assumption of independence of random residuals of alternatives, allowing for correlations among some groups of alternatives. Practically, the alternatives are clustered into groups k, called nests, identifying positively correlated alternatives. Also the Nested Logit formulation comes before GEV family and its GEV membership demonstration. Several authors (Ben-Akiva, 1974; Domencich and McFadden, 1975; Williams, 1977; Daly and Zachary, 1978), probably independently, proposed the following framework for choice probabilities, in an intuitive conditional form:
, , ,
( ) ( / ) ( )
n t n t n t
p j p j k p k (2.25)
For creating a correlation within a nest of alternatives, the generic random residual can be viewed as portioned in two adding i.i.d. Gumbel random residuals:
, , ,
/
n t n t n t
j k j k
(2.26)
The part kn,t represents the part that is shared among the correlated utilities. In fact, the
correlation is the tendency of two random variables to go in the same direction with reference to their average values. Sharing a random portion with the same sign, a positive correlation is induced. In other words, two utilities are positively correlated if an unobservable factor influences both of them.
Thus, the integral (2.15) involves the joint distribution f(kn,t,j/kn,t), represented by the product
between f(kn,t) and f(j/kn,t), being the two random portions independent one from the other.
Therefore, the integral in the second part clearly becomes the Multinomial Logit formula applied to alternatives within the nests. In other words, the first term of the (2.25) is the Logit formula involving all alternatives a ∈ k, within which in the denominator of the exponential’s
argument there is the variance of the parameter of the j/kn,t. It is clear to recognize that the
variance of the total random residuals is given by the sum of the variances of the two portions in (2.26)(the covariance is null), so, the variance within k will be smaller than the total variance. This means k is smaller than .
The second term is Gumbel distributed with variance given by the difference (k2) times
2/6. For the nest probability, it is worth to think of the perceived utility of a group. It is defined as the maximum of utilities of alternatives within the group, so the systematic utility is defined as:
, , , , , / max max( ) n t n t n t n t n t k a a a k k a k a k U E U E V (2.27)So, inasmuch as maximum of Gumbel random variables with the same k is always a Gumbel
with parameter k and mean given by:
, , , , / max( ) ln exp n t n t n t n t a k a a k k a k a k k V V E V
(2.28)The closed form expression (2.28) for the log-sum, according to McFadden (2001), seems due to the PhD thesis of Ben-Akiva (1972).
The Ukn,t is characterized by a random residual distributed as jn,t, i.e. with variance .
Consequently, the choice probability for nest follows the Logit formula extended to all nest