The BioRobotics Institute – Scuola Superiore Sant’Anna
PhD Programme in BioRobotics
Controlled ultrasound exposure for innovative
therapeutic applications
PhD Candidate: Andrea Cafarelli Tutor: Prof. Arianna Menciassi
Supervisor: Dr. Leonardo Ricotti
XXIX Doctoral Cycle June 21st, 2017
Summary
1 Motivation of the work ... 6
1.1 Thesis outline ... 9
2 Introduction to Therapeutic Ultrasound ... 11
2.1 Physical principles of medical ultrasound ... 12
2.1.1 Transmission/reflection between different interfaces ... 14
2.1.2 Attenuation ... 15
2.1.3 Main acoustic properties of natural tissues ... 16
2.2 Physical effects, biological effects and clinical indications of therapeutic ultrasound ... 17
2.2.1 Thermal and mechanical effects on tissues induced by US ... 19
2.2.2 A possible classification of therapeutic ultrasound ... 22
2.3 Controlled ultrasound exposure and the problem of reporting exposure conditions ... 24
3 Acoustic characterization of materials ... 27
3.1 Tuned materials for ultrasound applications: agarose, polyacrylamide and polydimethylsiloxane ... 28
3.2 Material characterization ... 32
3.2.1 Acoustic characterization ... 34
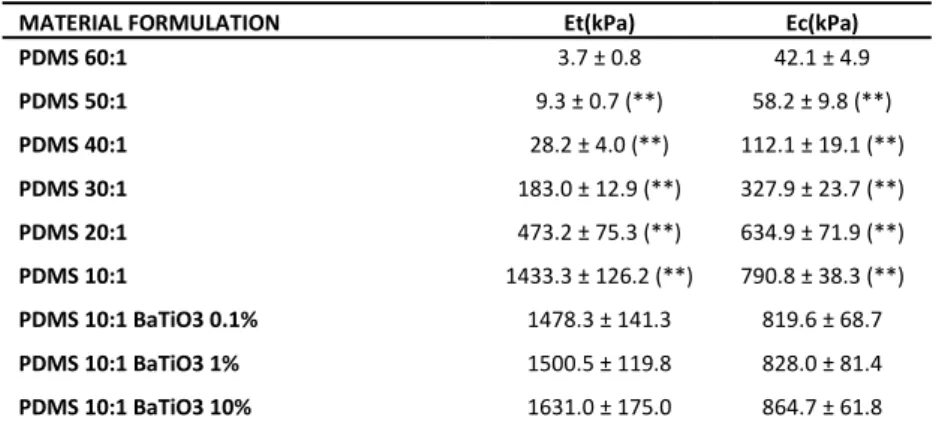
3.2.2 Mechanical characterization ... 40
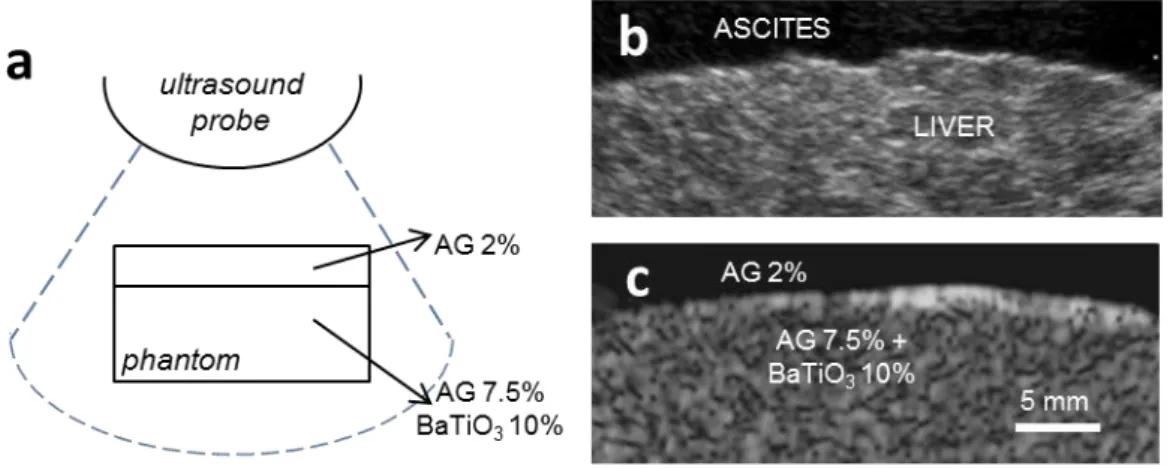
3.3 Development of ultrasound phantoms ... 42
3.4 Controlled in vitro ultrasound cell exposure ... 44
3.4.1 Ultrasound fibroblasts stimulation mediated by piezoelectric nanoparticles ... 46
Scientific production (Chapter 3) ... 49
4.1 In vitro LIPUS stimulation: background ... 52
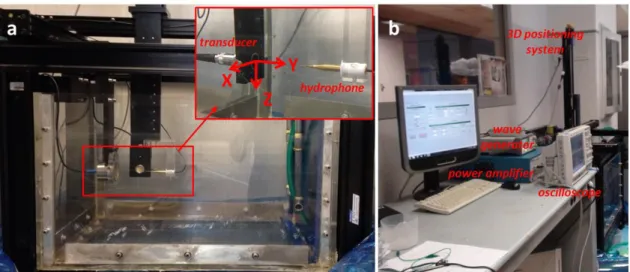
4.2 Ultrasound transducer characterization ... 55
4.2.1 Impedance matching circuits ... 55
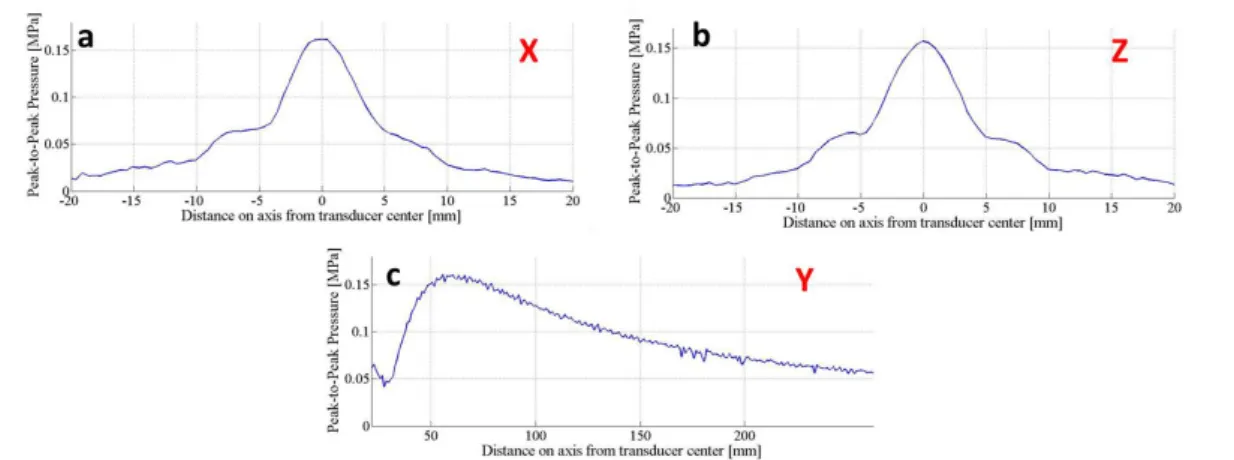
4.2.2 Pressure mapping and Intensity characterization ... 57
4.3 Experimental set-up ... 63
4.4 C2C12 muscle cell Ultrasound stimulation ... 66
4.4.1 C2C12 proliferation results ... 69
4.4.2 C2C12 differentiation results ... 71
4.4.3 Temperature measurements ... 76
Scientific production (Chapter 4) ... 78
5 High Intensity Focused Ultrasound for cancer treatment... 79
5.1 HIFU: background ... 80
5.2 A robotic system for HIFU surgery: the FUTURA platform ... 85
5.2.1 Platform architecture and modules ... 87
5.2.2 Experimental procedure ... 90
5.3 HIFU transducer characterization ... 91
5.3.1 HIFU field characterization ... 91
5.3.2 Verification of the confocal configuration of the 2D US probe ... 93
5.4 Assessment of HIFU procedure ... 95
5.4.1 In vitro tests in static conditions ... 95
5.4.2 Ex vivo tests in static consitions ... 97
5.4.3 Ex vivo tests in dynamic conditions ... 99
Scientific production (Chapter5) ... 105
6 Focused Ultrasound-induced Blood Brain Barrier opening ... 107
6.2 Passive cavitation detection for BBB opening ... 111
6.3 FUS induced BBB opening in rats with cavitation control ... 114
6.3.1 Transducer characterization: the Radiation Force Balance ... 114
6.3.2 In vivo experiments: protocol ... 118
6.3.3 In vivo experiments: results ... 122
Scientific production (Chapter 6) ... 124
7 Conclusions ... 125
APPENDIX A: Abbreviations ... 127
APPENDIX B: Scientific Production ... 128
APPENDIX C: Additional material on acoustic and mechanical characterization of AG, PAA, PDMS. ... 132
APPENDIX D: Design of a LIPUS stimulation set-up with a real-time optical monitoring ... 137
6
1 Motivation of the work
Medical technology paradigms continuously evolved in the last decades, leading towards more and more effective therapeutic solutions [1]. Recent efforts have been focused on personalized treatments that selectively and efficiently target specific pathological areas, thus minimizing side effects on healthy tissues. Minimally invasive procedures [2] have been developed in this regards. Such procedures are continuously being developed and are rapidly gaining acceptance in the clinics, especially when controllability is produced by robot-assisted methods [3].
The epitome of minimally invasive procedures consists of delivering the therapy in a completely non-invasive manner, e.g. by means of therapeutic ultrasound.
Ultrasound (US) based therapeutic tools consist of a invasive exposure of a non-ionizing, mechanical energy deep within the body without harming the healthy tissues. US can completely overturn the paradigms of current medicine and surgical interventions. Considering cancer treatment, for example, there are nowadays three main approaches, namely: chemotherapy, surgery and radiation therapy. However, none of these solutions can be considered free of side effects, such as non-specific targeting treatment, invasive incisions and use of ionizing radiation, respectively.
Figure 1.1. Schematic representation of the three current main pillars in fighting cancer: chemotherapy,
surgery and radiation therapy. The emerging technology of therapeutic US is also represented. Figure adapted from the lecture of Prof. Holger Grüll at the Winter School on Therapeutic Ultrasound 2015.
7
Image-guided Focused Ultrasound (FUS) has the potential to guarantee a totally non-invasive treatment. This can concern ablative procedures, or a method to delivery drugs in a localized area in the body, hence avoiding standard systemic administration of chemotherapeutic drugs. Treatments can be performed with the US source external to the patient, without ionizing radiation, general anesthesia, incisions or scars, thus resulting in minimal pain, short recovery time and fewer complications compared with conventional surgery or radiation therapy [4].
While several medical applications of therapeutic US have been clinically demonstrated (www.fusfoundation.org, Figure 5.3), the underlying mechanisms of the interaction between US and cells, US and tissues and US and materials are often not well understood, yet.
Therefore, research efforts have been devoted to both in vitro and in vivo tests aimed at better understanding the correlation between the cause (US stimulation) and the effect (biological or material response). The major open problems, which hamper further development and impact of therapies based on US, can be summarized as follows:
1) Optimization of acoustic stimulation. Many efforts still have to be made in this direction, in order to optimize treatments by providing the correct US dose at the target that causes the desired biological effect.
2) Understanding the influence of interactions between US-cells, US-tissue and
US-materials. Understanding such interactions occurring between acoustic
energy, cells, tissues and materials, can lead to the achievement of the desired physical effect (thermal, mechanical, etc.) and the resulting bioeffect, hence improving US-based interventions. Such knowledge is largely missing at present. On the other hand, it is also crucial to improve treatments safety and efficiency, as well as to devise future therapies based on analogue paradigms.
3) Measuring and reporting of US exposure conditions. The use of smart experimental systems, an accurate measurement system of the US field and an
8
accurate reporting of the data is a time-consuming and not always easy task. However it is of fundamental importance. Such systems could speed up a wider diffusion of therapeutic US among researchers and physicians.
4) Formulation of US-responsive materials. Further research and technical efforts will be needed to achieve suitable materials, with finely tuned physio-chemical properties and responsiveness, thus allowing proper response to an US stimulation (e.g. drug delivery vectors, US responsive piezoelectric nanocomposites).
As briefly highlighted in point 3), unfortunately many users and researches in this field exploit US by using non standardized configurations both in vitro and in vivo conditions, vulnerable to errors during calibration and use [5]. Therefore, the results available in the state-of-the-art are hardly comparable, slowing down the progress of this technology.
Any attempt to determine a quantitative relationship between US exposure and observed effect, in fact, should be based on reliable measurements of the US field that is used and on a proper design of the test bench [6].
The work which led to the preparation of this document was based on, and driven by, these considerations.
All the activities described in this manuscript, dealing with different aspects of therapeutic US (Effects mediated by acoustically tuned and responsible materials in
Chapter 3, Low Intensity Pulsed Ultrasound for regenerative medicine in Chapter 4,
High Intensity Focused Ultrasound for cancer treatment in Chapter 5 and Ultrasound-induced Blood Brain Barrier opening in Chapter 6) were investigated from an engineering point of view, trying to follow the same scientific approach and the aforementioned considerations.
9
1.1 Thesis outline
The contents of this PhD thesis are organized as follows.
In Chapter 2 Therapeutic Ultrasound is introduced, with a brief mathematical presentation of wave propagation and a delineation of the main parameters describing both propagation and interaction of US through tissue (Section 2.1). In Section 2.2 the main physical effects (thermal and mechanical) induced by US on tissues are described, focusing on the associated biological effects and the clinical indications where these phenomena can be exploited. Section 2.3 reports a best practice approach for studying and reporting exposure conditions used in therapeutic US studies for a wider and more rapid diffusion of therapeutic US application in clinics. This approach was then used for the studies conducted and described in the next chapters.
Chapter 3 describes the acoustic characterization of different materials and how this knowledge can be used to build tissue-mimicking phantoms which exhibit analogue echogenicity to real tissues for US-based medical procedures and to estimate the real US dose delivered to the target (i.e. cells exposed to US during in vitro experiments). First, in Section 3.1 the relevance in developing biomaterials with tuned acoustic - and mechanical - properties with a focus on agarose, polyacrylamide and polydimethylsiloxane is reported. The experimental set-up used to measure acoustic properties of these materials is detailed in Section 3.2, while the development of custom tissue-mimicking phantoms and smart materials (e.g. piezoelectric nanocomposites) for stimulating cells with a highly controlled US dose are reported in Section 3.3 and Section 3.4, respectively.
In Chapter 4 an experimental system for in vitro cell stimulation is described. After exploring the state of the art of Low Intensity Pulsed Ultrasound (LIPUS) stimulation (Section 4.1), the characterization of the US field in terms of pressure field maps and intensity of each transducer at several frequencies of interest (Section 4.2) are presented. The consequent system design is also reported (Section 4.3). The system was exploited to investigate the effects of controlled LIPUS exposures at different frequencies and intensities, on C2C12 muscle cells (Section 4.4).
10
Chapter 5 is devoted to High Intensity Focused Ultrasound (HIFU) surgery for cancer treatment. An innovative robotic system that merges HIFU technology with US guidance and robotic control is described (Section 5.2), after briefly exploring the main principles of HIFU and highlighting the main limitations of current systems (Section 5.1). A 16 channels annular array transducer has been integrated in the platform, properly characterized (Section 5.3) and exploited for an in vivo and ex vivo validation of the procedure both in static and dynamic conditions (Section 5.4).
Chapter 6 reports the results of a six-month experience at the Neurospin Lab (Commissariat à l'énergie atomique, Saclay, France) where a controlled US exposure was used in vivo for a safe permeabilization of the Blood Brain Barrier (BBB) has been used. After exploring the state of the art of FUS-induced BBB opening (Section 6.1) a procedure for a safe and effective transient BBB permeabilization based on passive cavitation on rats is presented (Section 6.2). Results are reported in Section 6.3.
Finally, Chapter 7 reports the conclusions of the work, the achieved objectives and the future perspectives.
11
2 Introduction to Therapeutic Ultrasound
Besides the well-known use of US in diagnostics, the use of US as therapeutic tool has recently emerged. Thanks to its intrinsic non-invasive nature (no incisions and no ionizing radiation) and the capability to localize the effects of a treatment with extreme precision (use of a focused beam), therapeutic US is rapidly gaining clinical acceptance for a wide range of pathologies.
However, there are a number of challenges to overcome which obstruct the widespread development of applications of therapeutic US in clinics. Examples range from an accurate knowledge of the underlying mechanisms to treatment optimization and safety issues.
In this Chapter the basic physical principles of US are introduced in Section 2.1 with a brief mathematical introduction of elastic wave propagation and a delineation of the main parameters useful to describe the propagation of US through tissue. In Section 2.2 the main physical effects, i.e. thermal and mechanical effects, induced by US propagation in tissues are described, paying particular attention to the associated biological effects. The clinical indications where these phenomena can be exploited are also described. Section 2.3 reports a best practice approach for studying and reporting exposure conditions used in therapeutic US studies for a wider and more rapid diffusion of therapeutic US applications in clinics.
12
2.1 Physical principles of medical ultrasound
US waves are mechanical vibrations that propagate through a medium with frequencies higher than 20 kHz (upper limit of the human hearing range). Unlike electromagnetic waves, which can propagate in vacuum, sound and US waves need a medium to propagate.
Even though a thorough mathematical description of US propagation is far from the main aim of this work, the basic definitions of acoustic waves are described as follows for the sake of completeness.
The simplest starting point to analytically describe the propagation of a pressure wave is by considering the medium stationary [7]. When a stable state is perturbed by a propagating acoustic wave, the total pressure pT, at the position x and time t, can be written as follows:
𝑝𝑇(𝑥, 𝑡) = 𝑝0+ 𝑝(𝑥, 𝑡) Eq. 2.1
where the subscript 0 denotes an unperturbed condition. An analogous equation can also be written for the density of the medium ρT.
The wave equation can be derived from the continuity equation, the momentum equation, considering the approximation of small perturbations (p/p0<<1 and ρ/ρ0<<1) and the constitutive equation which relates p and ρ:
{ −𝜕𝜌 𝜕𝑡 = 𝜌0 𝜕𝑢 𝜕𝑥 −𝜕𝑝 𝜕𝑥 = 𝜌0 𝜕𝑢 𝜕𝑡 𝜌 = 𝜌0𝛽0𝑝 = [𝜕𝜌 𝜕𝑝]𝑎𝑑 Eq. 2.2
where u is the particle velocity and the subscript ad indicates an adiabatic transformation (β0 is the adiabatic compressibility).
Combining the three equations described in Eq. 2.2 the wave equation can be derived:
𝜕2𝑝 𝜕𝑥2
−
1 𝑐2 𝜕2𝑝 𝜕𝑡2= (
𝜕 𝜕𝑥log 𝜌
0)
𝜕𝑝 𝜕𝑥Eq. 2.3
13
where c is the speed of sound in the medium. Assuming constant density and compressibility and a homogeneous medium Eq. 2.3 simplifies as follows:
𝛻2𝑝 − 1
𝑐2
𝜕2𝑝
𝜕𝑡2 = 0 Eq. 2.4
In the case of harmonic wave it is possible to express all the variables using complex notation (A=Aω-eiωt) where ω=2πf is the angular frequency at the frequency f in a time-independent expression:
𝛻2𝑝𝜔+𝜔2
𝑐2𝑝𝜔 = 0 Eq. 2.5
A travelling acoustic wave transports energy, which can be calculated by the scalar product of the momentum equation and the particle velocity. Using Eq. 2.4 it is possible to obtain the relation:
𝛻(𝑝𝑢) = − (1 2 𝜕𝑢2 𝜕𝑡 + 𝑝 𝜌0𝑐2 𝜕𝑝 𝜕𝑡) Eq. 2.6
Eq. 2.6 implies that the flux of energy density is equal to the variation of the kinetic energy and the potential energy (first and second term on the right hand side of the equation respectively). The time variation can be eliminated by performing a time average, thus introducing the Intensity I(t), a very important parameter for medical US and their effect on tissue.
𝐼(𝑡) = 1
𝜏∫ (𝑝(𝑡)𝑢(𝑡))𝑑𝑡 𝜏
0 Eq. 2.7
Assuming linear wave approximation, Eq 2.7 simplifies as follows:
𝐼 =
𝑝2𝜌0𝑐 Eq. 2.8
By using the local maximum pressure value, the corresponding intensity is called spatial peak temporal-peak intensity (ISPTP). Combination of spatial and time averages provides further definitions. Some examples are the spatial-average time-average intensity (ISATA) and spatial-peak time-average intensity (ISPTA). When referring to
14
pulsed waves, average values are also introduced, namely the spatial-peak pulse-average intensity (ISPPA) and the spatial-average pulse-average intensity (ISAPA).
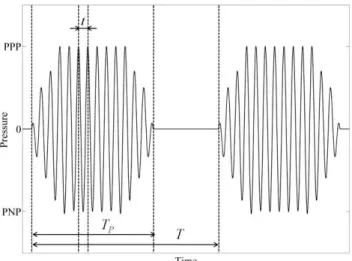
PPP and PNP respectively denote the Peaks of Positive and Negative Pressure in Figure
2.1. 1/t is the US wave frequency (f), TP is the pulse length and T is the pulse repetition period; its reciprocal 1/T is known as Pulse Repetition Frequency (PRF). Duty cycle (DC) is defined as TP/T.
Figure 2.1. Typical shape of an ultrasonic wave with some parameters highlighted.
2.1.1 Transmission/reflection between different interfaces
The acoustic impedance (Z) is another important acoustic parameter that needs to be introduced. The concept of impedance is particularly valuable in characterizing wave propagation in the presence of boundaries between media with differing acoustical properties. The simplest case is that of the propagation of a plane wave in an inviscid fluid medium, where the acoustic impedance can be simply expressed as:
𝑍 = 𝜌𝑐 Eq. 2.9
Whenever an ultrasonic wave front of energy E hits a boundary between two media characterized by different acoustic impedances (Z1 andZ2) only a part of the wave is transmitted through to the second medium, while a fraction is reflected.
15
Figure 2.2. Typical transmission and reflection phenomena at the interface between two materials with
different acoustic impedance.
The reflection coefficient γr is given by the following equation:
𝛾
𝑟= (
𝑍1−𝑍2𝑍1+𝑍2
)
2
Eq. 2.10
while the transmission coefficient γt can be expressed as follows:
𝛾
𝑡=
4𝑍1𝑍2(𝑍1+𝑍2)2
Eq. 2.11
It is therefore clear that if acoustic impedances at one interface are equal, the transmitted intensity is equal to the incident intensity and there is no echo. If instead there is a large difference between them, there will be nearly total reflection, for example at the air-soft tissue interface. Typical reflection percentage intensities at the interface between some tissues are reported in Table 2.1.
Boundary % Reflection
Muscle / Fat 0,5 Kidney / Fat 0,6 Soft tissue / Water 0,2 Bone / Muscle 41 Bone / Fat 49 Soft tissue / Air 99,9
Kidney / Fat 1
Table 2.1. Percentage reflection of US at boundaries
2.1.2 Attenuation
Attenuation is another important parameter to be considered when studying the propagation of US waves through tissues. When a pressure wave passes through a medium, particles are forced to move with respect to each other. The medium viscosity opposes this motion and part of the wave energy is converted into heat. The
16
conversion in turn causes the intensity and the pressure of the wave to decay, with the following exponential relation:
𝐼 = 𝐼0𝑒−𝜇𝑥 𝑝 = 𝑝0𝑒−𝛼𝑥 Eq. 2.12
where μ is the attenuation coefficient and in the linear approximation it is related to α by a factor 2. Attenuation coefficient is the sum of the absorption coefficient and the scattering coefficient. The total loss of acoustic energy due to the wave travelling inside a tissue is therefore given by different factors: refraction, reflection, scattering and absorption. For a first approximation, however, absorption is the highest contribution and it is common to consider that all the energy loss is absorbed by the medium.
Figure 2.3. Example of the effect of attenuation on US intensity in relation to the depth in the body. I0 is the original intensity.
Furthermore it is worth mentioning that the attenuation is related to frequency, expressed by the equation, where the exponent b is commonly between 1 and 2.
𝜇 = 𝑎𝑓𝑏 Eq. 2.13
2.1.3 Main acoustic properties of natural tissues
In Table 2.2 the main acoustic (and mechanical) properties of some human tissues are reported. The knowledge of these properties is extremely important to predict, by using the before-mentioned equations, the propagation of US inside the body and therefore precisely control the dose at the target site. This knowledge, as will be
17
explained in Chapter 3, is also important in the development of US phantoms which show analogue echogenicity of real tissues.
Tissue Young’s Modulus [kPa] Density [kg/m3] Speed of Sound [m/s] Acoustic Impedance [MRayl] Attenuation Coefficient [dB/(cm MHz)] Blood / 1060 1584 1.68 0.2 Brain 1-4 1040 1560 1.62 0.6 Breast 1-3 1020 1510 1.54 0.75 Cardiac 10-15 1060 1576 1.67 0.52 Fat 0.5-3 950 1478 1.40 0.48 Liver 8-12 1060 1595 1.69 0.50 Diseased Liver 6-25 1050 1527 1.60 0.58 Marrow 0.5-1.5 / 1435 / 0.5 Muscle 10-20 1050 1547 1.62 1.09 Tendon 1300-1700 1670 1750 1.84 4.7 Air / 1.2 330 0.0004 / Water / 1000 1480 1.48 0.0022
Table 2.2. Acoustic and mechanical properties of some human tissues.
2.2 Physical effects, biological effects and clinical indications of therapeutic ultrasound
When an US wave interacts with biological tissues, there are mainly two different physical effects as a result: thermal and mechanical effects. These effects depend on the nature of the tissue (attenuation coefficient, percentage of gas, etc.) and the US parameters (intensity, therapy duration, duty cycle, etc.). If correctly tuned, this interaction can produce certain desired biological effects that can be exploited in many clinical indication.
Figure 2.4. US-tissue interaction. The direct application of US can cause mainly two different physical
effects within the tissues: thermal and mechanical ones. If correctly tuned, these mechanisms produce multiple biological effects that enable the potential use of US in many clinical indications.
18
As reported in a recent FUS Foundation's white paper [8], focused US is capable of inducing 17 different biological effects that highlights the potential use of US for treating different pathologies.
APPLICATION RATE OF ENERGY DEPOSITION
ENERGY INTENSITY
MECHANISM BIOLOGICAL EFFECT
Thermal ablation Continuous High Hyperthermia (high) Coagulative necrosis
Physiotherapy Pulsed/Continous Low Cavitation (stable) /
Hyperthermia (low) Tissue repair enhancement
Histotripsy Pulsed High Cavitation (inertial) Destruction of cell
membrane
Clot lysis Pulsed High Cavitation (inertial) Disruption of the fibrin
matrix
Sonodynamic
therapy Pulsed High Cavitation (inertial)
Formation of ROS (reactive oxygen species)
Radiosensitization Continuous Low Hyperthermia (low) Prevents DNA repair
Neuromodulation Pulsed Low Mechanical Neurons excitation or
inhibition
Blood-brain barrier
opening Pulsed Low Cavitation (stable)
Disruption of tight junctions Immunomodulation Continuous or pulsed High Mechanical or thermal (low) Presentation of tumor-specific antigens and
cytokine secretion
Enhanced drug
uptake Pulsed Low Cavitation (stable) Sonoporation
Drug delivery from
vehicles Pulsed or Continous Low
Cavitation or
hyperthermia Drug delivery from vectors
Table 2.3. Main therapeutic applications of US.
Cancer treatment, in particular, has become a major area of interest [9], but clinical applications of therapeutic US includes other procedures such as lithotripsy, thrombolysis, targeted US drug delivery, transdermal US drug delivery, and US hemostasis [10].
19
2.2.1 Thermal and mechanical effects on tissues induced by US
The thermal and mechanical effects of US are detailed in this section.
Thermal effects.
Thermal effects are associated with a absorption of part of the energy carried by the US wave in the tissue. As anticipated by Eq. 2.12, while US wave travels in a viscous medium, it loses part of its energy. In the absence of heat losses by conduction, convection or radiation, it is possible to relate the heat deposition rate per unit volume to the US intensity and the temperature variation as follows:
𝑄̇ = 𝜇𝐼 = 𝜌𝐶𝜕𝑇
𝜕𝑡 Eq. 2.14
where C is the heat capacity of the medium. In practical cases, at least diffusion and cooling must be considered. The well-known Pennes’ bio-heat equation takes into account the conduction heat transfer and the cooling from blood vessels which act as heat exchanger [11]:
𝜌𝐶𝜕𝑇
𝜕𝑡 = ∇(𝑘 ∇𝑇) − 𝑚𝑏𝐶𝑏(𝑇 − 𝑇𝑏) + 𝜇𝐼 Eq. 2.15
where k is the thermal diffusivity, subscript b indicates blood and m is the blood mass in the considered region. The thermal tissue damage caused by US depends on a number of factors, related to acoustic tissue properties and acoustic parameters of the stimulation. The overall thermal effect is mainly dependent on a combination of temperature increment and duration of heating. Sapareto and Dewey [12] proposed the cumulative equivalent minutes at 43°C (CEM43) as a model to calculate the thermal dose from the knowledge of temperature history:
𝐶𝐸𝑀43= ∫ 𝑅𝑡𝑓 (43−𝑇)𝜕𝑡
𝑡0 Eq. 2.16
where R = 0.25 for T ≤ 43°C and R = 0.5 for T > 43°C. The commonly accepted threshold for tissue thermal ablation (thermal ablation) is 240 CEM43, although there is
20
some variation based on the tissue type. Figure 2.5 shows different levels of thermal dose and their biological effects.
Figure 2.5. Correlation between thermal dose and biological effects in tissues [4]. Thermal effects are
mainly dependent on a combination of temperature elevation and duration of heating. Below the thermal dose threshold, no tissue damage occurs; beyond the threshold tissue experiences thermal
necrosis. Tissue boiling occurs over 100°C regardless the exposure time.
The Thermal Index (ThI), which is defined as the ratio between the transducer output power (Wp) and the power required to raise the tissue temperature by 1 °C (Wdeg), provides a simplified way to estimate the temperature rise in tissue during exposure.
𝑇ℎ𝐼 = 𝑊𝑝
𝑊𝑑𝑒𝑔 Eq. 2.17
Mechanical effects
Among mechanical effects induced by US on tissues, the most common effects relate due to radiation force, acoustic streaming and acoustic cavitation. This last phenomenon involves the formation, oscillation, growth, and possible collapse of gas bubbles within the tissues.
The dynamics of a single spherical bubble in a free liquid field can be described by a simplified model (Rayleigh-Plesset equation [13]) as follows:
𝑅𝑅̈ +3 2𝑅̇ 2 = 1 𝜌[𝑃𝑔 − 𝑃0− 𝑃(𝑡) − 4𝑘 𝑅̇ 𝑅− 2𝜏 𝑅] Eq. 2.18
21
where R is the radius of the bubble, Pg is the gas pressure inside the bubble, P0 is the static pressure in the liquid just outside the bubble wall, P(t) the applied driving pressure, 𝜏 is the surface tension and k the kinematic viscosity.
Two different cavitation regimes can be identified, bringing about different bubble dynamics [7]:
stable (non-inertial) cavitation, which is characterized by small and harmonic oscillation of the bubble radius around its equilibrium position, in response to a relatively low intensity pressure field;
transient (inertial) cavitation, which is characterized by strongly nonlinear oscillations leading to collapse in response to higher intensities. The violent collapse of bubbles can generate a local pressure of about 500 atm, a local temperature as high as 5000 K and a very strong shock wave and microstreaming [14].
Figure 2.6. Mechanism of acoustic cavitation: A) Stable caviation regime and B) Inertial cavitation
regime. Figure readapted from Fix et al. [15].
The Mechanical Index (MI), although represents a relative indicator of the likelihood of mechanical bioeffects, gives an indication of mechanical damage of tissue due to inertial cavitation. The mechanical index is defined as the ratio between the maximum value of peak negative pressure (Pneg) and the square root of the nominal frequency (f) of the acoustic beam.
𝑀𝐼 =
𝑚𝑎𝑥{𝑃𝑛𝑒𝑔}22
Although there are several limitations to the use of the MI in certain applications, this number has been generally adopted as a safety index for medical US systems. It is now accepted that with MI < 0.3 the probability that mechanical bioeffects occur is very low [16], while for MI > 0.7 the risk of inertial cavitation events is very high [17].
2.2.2 A possible classification of therapeutic ultrasound
From an engineering viewpoint, a possible classification can be made by distinguishing applications in which US are used alone (direct effect on tissues) or in combination with US responsive agents (mediated effects on tissue). Considering destructive and non-destructive applications as well, four different categories can be therefore highlighted:
1. Stand-alone US for tissue destruction: High Intensity Focused Ultrasound (HIFU) concentrates a large amount of energy in a small target volume deep in the body without harming the surrounding healthy tissue. A significant temperature rise (thermal ablation) and/or mechanical phenomena (inertial cavitation) can therefore cause tissue necrosis only in the focus area (protein
denaturation [18] and histotripsy [19], respectively). This principle is mainly
applied for treating malignancies such as breast, prostate, liver, kidney and bone tumors [9] or uterine fibroids [20], but it is recently gaining acceptance also for thrombolysis [21], brain tumours [22] and other neurological diseases [23].
Also aesthetic applications in which inertial cavitation is exploited to selectively disrupt fat cells (lysis) play a major role in the therapeutic US market [24].
2. Stand-alone US for tissue modification: non lethal temperatures increase (39 to 42°C) in the range of moderate hyperthermia, far below the ablative threshold, can be induced by US to speed up the healing processes in physiotherapy applications [25] and for enhancing the efficacy of drug delivery
23
and uptake in targeted area. This is due to an increase of the blood flow and drug absorption in the target region [26].
Also non lethal mechanical effects can be exploited for physiotherapic and aesthetic applications (e.g. facial wrinkles treatment) [27] or to increase localized uptake of drugs in the body. Stable cavitation can modify the permeability of cell membranes, thus enhancing the absorption of drug molecules through the mechanism known as sonoporation [28] and increasing the vascular permeability at the target area [29].
Low intensity US can also be used for vasodilation and vasoconstriction in the vessels [30], stimulation or suppression of neural activity in US-induced neuromodulation applications [31], and enhancing sensitization to radiotherapy or chemotherapy [32] minimizing the treatment's adverse effects.
3. US in combination with US responsive materials for tissue destruction:
specific vectors can be used in combination with US stimulation as HIFU enhancement tools for lethal thermal or mechanical effects. For example, the use of intravenously injected contranst agents (e.g. microbubbles (MB)) reduces the threshold level of inertial cavitation that results in mechanical tissue ablation, thus enhancing treatment efficiency and reducing the total time duration of cancer treatment [33]. Another example worth mentioning is sonothrombolysis, where the use of MB in combination with focused US is established to enhance the lysis of clots that occlude blood vessels [34].
4. US in combination with US responsive materials for tissue modification: US contrast agents can be used in combination with US to enhance some non lethal biological phenomena. For example, the interaction between US and oscillating MB is widely investigated to overcome the natural barriers for a targeted drug delivery [35]. A particular attention in this field is dedicated to MB-assisted US for drug delivery in the brain, described in Chapter 6, that was
24
demonstrated to be an effective and safe method to momentarily open the blood brain barrier.
US can be used also as a trigger for the lethal or non-lethal drug release from specific micro/nano materials (e.g. MB, liposomes, polimeric micelles and nanobubbles) responsive to a certain ultrasonic regime [36]. Even if there are few examples of thermosensitive vectors designed to release drugs (e.g. thermo-sensitive micelles and temperature-sensitive liposomes), the main physical mechanisms used to trigger drug release from US-sensitive carriers are mechanical [37].
In addition, as will be explained in Section 3.4, it has been recently shown that piezoelectric nanomaterials stimulated by US can provide beneficial stimuli for the differentiation/regeneration of cells and tissues [38].
2.3 Controlled ultrasound exposure and the problem of reporting exposure conditions
In any study that attempts to show a quantitative relationship between US exposure and the observed effect, the authors should measure or correctly estimate the exposure level in situ where the effects are observed and report it in a correct manner. In fact, a wrong reporting of the exposure conditions causes a considerable slowing down in the advancement of the understanding of the phenomena and its application to the clinical scenario. One of the main problems in the therapeutic US field to reproduce is in fact comparing and analysing data sets from different groups [39]. Moreover it is worth mentioning that the most common indices available in clinical devices, namely the Thermal Index (TI) and Mechanical Index (MI) described in Eq. 2.17 and Eq. 2.19, suffer from strong limitations. In 2011 Prof. ter Haar wrote a guideline for encouraging a best practice approach among researchers in the field of US for studying and reporting exposure conditions used in their studies [6]. The main recommendation is the following:
25
"Any study that attempts to demonstrate a correlation or lack of correlation between exposure to ultrasound and an observed or postulated physical or biological effect must include acoustic output data for each ultrasound field based on the maximum values in the field (Level 2) or, preferably, the acoustic pressure and intensity distributions (Level 3). Ideally, each field used should be measured but it is acceptable to measure a subset of the fields and determine the data for other fields by interpolation or, exceptionally, by extrapolation provided that the method is described. The need to make these measurements should be considered in the early planning stages of the study."
However, this is neither straightforward nor common in many studies. In fact, there is a huge variability in the devices and parameters used, in terms of temporal, spatial and intensity distribution that are often not properly considered. Both diagnostic and therapeutic US field often have a very high degree of spatial non uniformity thus requiring very difficult measurements for complete characterization. Furthermore, most off-the-shelf devices do not possess accurate description of their acoustic field since it is not an important information for the usual medical instrument. Of course this consideration is no longer valid if the same device is used as a research tool. Even if there are a lot of instances in literature of studies seeking to correlate the observed effect in some way to the nature of US exposure, a good reporting practice is still not widespread in literature, bringing incomplete information, wrong assumptions and lack of reproducibility between different groups.
Another important issue is the design of the experimental system used for US experiments. As described more extensively in Chapter 3, inappropriate set-ups generate uncertainty in the exposure that for in vitro cell stimulation can exceed 700% [5]. For example, a vast majority of current systems used in this field use non-transparent materials (e.g. plastic Petri dishes) along the path of the US beam that reflect part of the energy and may produce some hardly predictable effects, such as standing wave formation.
All the activities described in this work, dealing with different applications of therapeutic US, were conducted taking into account these points. In particular,
well-26
characterized and reproducible systems for US studies were developed following the following steps:
1. Characterization of the US sources: All the transducers used were characterized, for all frequencies under investigation, in terms of pressure field maps and intensity calibration, in free field conditions.
2. Design of the US stimulation set-up: The experimental set-ups were designed and built up trying to minimize the typical exposure errors that normally affect the vast majority of current systems used for US stimulation and to achieve an exposure as much as possible similar to the one measured in free field conditions. For this purpose, particular attention has been devoted to the knowledge of the acoustic properties of materials that interact with US waves in the stimulation path.
3. Report of the exposure conditions: The characteristics of the US sources, the experimental set-up features and the stimulation parameters (frequency, intensity, therapy duration, and duty cycle) have been carefully reported.
This aforementioned approach was applied to all the activities presented in this work based on the author’s strong belief that an improvement in the knowledge of the biological effects of US, together with a smart experimental design and an appropriate reporting of the data, is fundamental for a wider diffusion of US therapies.
27
3 Acoustic characterization of materials
The knowledge of acoustic properties of materials such as speed of sound, acoustic impedance and attenuation coefficient is of great importance for any applications in which materials interact with acoustic or ultrasonic waves.
In particular an accurate knowledge of combination of acoustic and mechanical properties of materials is of great interest for both the development of tissue-mimicking phantoms for US tests and for the development of smart scaffolds for US mediated tissue engineering and regenerative medicine.
Regarding US phantoms, this knowledge can be used to build tissue-mimicking phantoms which show similar echogenicity to real tissues for US-based medical procedures and that can be used different purposes.
Furthermore, a proper knowledge of acoustic properties of materials allows to estimate the real US dose delivered to the target (i.e. cells exposed to US during in
vitro experiments). As an example, in the field of therapeutic US for tissue engineering,
scaffolds are commonly used to support cells during US stimulation experiments, both
in vitro and in vivo. Therefore, whenever an acoustic wave interacts with materials
positioned within the propagation path, the material acoustic properties deeply influence the US propagation due to attenuation or reflection and thus the US dose actually delivered to the target.
In Section 3.1 the relevance to develop materials with tuned acoustic - and mechanical - properties, with a focus on agarose (AG), polyacrylamide (PAA) and polydimethylsiloxane (PDMS), is reported.
The experimental system used to measure acoustic properties of materials is detailed and the results of acoustic and mechanical characterization of AG, PAA and PDMS at different concentrations and doped with different concentrations of nanoparticles (i.e. barium titanate nanoparticles) are reported in Section 3.2. These data were used to develop custom tissue-mimicking phantoms (Section 3.3) and to fabricate smart materials for stimulating cells with a highly controlled US dose (Section 3.4).
28
3.1 Tuned materials for ultrasound applications: agarose, polyacrylamide and polydimethylsiloxane
Tuning material physical properties is an effective way to engineer artificial or bioartificial systems for a wide range of biomedical applications. Materials with finely tuned features can indeed play a key role as synthetic replacements for biological tissues, substrates for tissue engineering, components of medical/surgical devices, drug delivery systems, diagnostic and array technologies and tissue-mimicking systems [40, 41]. In particular, material properties play a key role in two specific and rather distinct application domains, namely the development of tissue-mimicking phantoms for ultrasound (US) tests and the development of scaffolds for tissue engineering and regenerative medicine.
Tissue-mimicking phantoms are an important tool for performance testing and optimization of medical US systems and photoacoustic devices, as well as for medical training [42]. US phantoms must closely reflect the typical acoustic properties, such as speed of sound (c), acoustic impedance (Z) and attenuation coefficient (α) of natural tissues in order to reproduce US images similar to those obtained in vivo conditions. US stimulation of cells and cell-seeded scaffolds has recently emerged as an intriguing tool to enhance certain cell responses in tissue engineering and regenerative medicine fields, by exploiting either direct mechanical effects [43, 44] or smart materials-based mediated ones [45, 46]. In this context, smart substrates can be defined as materials that are able to produce different types of stimuli (electrical, mechanical, thermal, chemical, etc.) and convey them to cells, once they are invested by a US wave.
Whenever an acoustic wave is used in combination with materials, their acoustic properties deeply influence the US attenuation or reflection and thus the US dose actually delivered to cells. Therefore, an accurate knowledge of the acoustic properties (such as c, Z and α) of different materials is extremely useful both for the development of tissue-mimicking US phantoms and for the estimation of the effective dose to cells in US mediated tissue engineering applications.
In this work the attention was focused on three polymers: agarose (AG), polyacrylamide (PAA) and polydimethylsiloxane (PDMS). These materials have been
29
extensively used in both tissue-mimicking phantoms and tissue engineering/regenerative medicine fields, but a systematic acoustic characterization has been not performed yet. The selected materials were characterized in terms of acoustic properties (c, Z and α measurements) at different concentrations or cross-linking levels and doped with different concentrations of barium titanate ceramic nanoparticles (BaTiO3).
In the field of tissue-mimicking phantoms, several materials were designed and characterized to be used as tissue-mimicking materials (TMMs) with the aim to tailor acoustic properties of tissues for specific applications in US-related medical fields [41]. The use of PDMS in this domain implies several advantages including stability, long-term duration and the possibility to mimic elastic properties of different tissues, making this material a valid solution for US phantoms in general and for elastography in particular. PDMS phantoms can be useful for surgical training, to simulate procedures such as biopsies and needle insertions and also for the development of new diagnostic strategies. However, silicone-like materials are usually discarded as TMMs for US phantoms, due to their high α (usually >2 dB/cm), low c (around 1000 m/s) and low Z (around 1 MRayl) [47] that make them rather different from natural soft tissues [48]. For the RT601 silicone, Zell et al. found a longitudinal c of 1030 m/s, a
Z of 1.10 MRayl and an α of 14 dB/cm (at 7MHz) [42]. In a study focused on the
estimation of ultrasonic shear rate in vascular applications, Tsou et al. [49] reported the longitudinal c and the α of PDMS at different formulations. It was found that PDMS acoustic properties are very different from biological tissues, but they can be adjusted by changing the monomer/curing agent ratio (e.g. by changing the ratio from 1:10 to 1:5, the c increased from 1076,5 up to 1119.5 m/s and the α decreased from 21.30 down to 14.86 dB/cm, at 5 MHz).
PAA shows very good acoustic properties and an acceptable stability over time, thus making it a good solution for US phantoms. A 10% PAA gel was used by Zell et al. [42]. The measured c (1580 m/s), Z (1.7 MRayl) were within a suitable range for mimicking soft tissues, while α (0.7 dB/cm at 5 MHz) resulted lower with respect to values shown by natural tissues. Prokop et al. proposed PAA gels at different concentrations as
30
coupling media for FUS therapy [50]. Here, it was shown that acoustic properties varied linearly with acrylamyde concentration from 10% to 20% w/v: c ranged from 1546 to 1595 m/s, Z from 1.58 to 1.68 MRayl and α from 0.08 to 0.14 dB/cm, at 1 MHz. PAA is also widely used for the fabrication of thermal phantoms, exploited, e.g., in the evaluation of high intensity focused ultrasound (HIFU) procedures [51, 52]. In these studies, PAA is commonly mixed with a thermosensitive material, such as bovine serum albumin (BSA) or egg-white, in order to become optically opaque when denatured [53, 54].
As reported by Culjat et al., AG-based materials are widely used for US phantoms, due to the ease of fabrication, good acoustic (and mechanical) properties and the possibility to easily incorporate additional ingredients [41]. Therefore, AG-based materials have been rather well characterized in the previous literature [55].
The main AG acoustic properties, which are anyhow strongly influenced by material formulation and manufacturing techniques, are the following: c in the range 1498– 1600 m/s, α in the range 0.04–1.40 dB/cm and Z in the range 1.52–1.76 MRayls [56]. Cannon et al. developed AG-based materials for the production of a heterogeneous breast phantom, mimicking different anatomical structures of the breast (glandular tissue, subcutaneous fat, pectoral muscle, areola, malignant and benign lesions) under US [57]. In this study, the authors kept a constant concentration of AG (3% w/v) and modified the concentrations of different dopant agents (glycerol, silicon carbide and aluminum oxide) in order to slightly change the acoustic properties.
In addition to formulation, preparation conditions may play also an important role in determining the final properties of AG gels: Browne et al. found that AG c increases with increasing temperature by a rate of approximately 1.5 m s-1 °C-1, while changes in α are negligible [58]; Ross and colleagues found that mixing conditions also strongly
influence mechanical and acoustic properties of agar gels [59].
In the field of tissue engineering and regenerative medicine, PDMS, PAA and AG materials have been also extensively used, especially for mechanobiological studies. Substrate mechanical and (in some cases) surface chemical properties regulate in fact important cells behaviors such as adhesion, proliferation and differentiation [60-65].
31
Scaffolds are commonly used to support cells also during US stimulation experiments, both in vitro and in vivo. However, a proper knowledge of their acoustic properties is almost always lacking. This hampers to estimate the actual US dose delivered to the target and, as a consequence, makes US exposure poorly repeatable: it has been demonstrated that the uncertainty on US exposure, during in vitro experiments, can be up to 700% [5].
No insights on acoustic properties of PDMS, PAA and AG materials intended for the development of cells substrates were reported.
A systematic analysis of acoustic characterization of PDMS, AG, PAA at different concentrations and cross-linking extents and doped with different concentrations of barium titanate (BaTiO3) nanoparticles, has been not performed yet. Ceramic BaTiO3
nanoparticles were selected as filler because their presence in the matrix can modify the mechanical properties of the composite [66, 67]. In addition, although no specific data are available in the literature, they were expected to affect also the acoustic properties of the matrix, similarly to other ceramic materials [47, 56]. Finally, it is known that BaTiO3 exhibits piezoelectric properties [68]. Therefore, when stimulated
by US waves (mechanical inputs), they are able to generate local electrical charges that demonstrated to provide beneficial stimuli, thus enhancing cell adhesion, proliferation or differentiation [38]. A precise measurement of such properties enables the development of tissue-mimicking phantoms and a highly controlled US exposure of living cells, thus overcoming the uncertainties connected with US wave attenuation and reflection, due to the scaffold on which cells are seeded.
32
Figure 3.1. Schematic representation of acoustic/mechanical properties of different tissue mimicking
materials analyzed in this study. These results can be used to build tissue-mimicking phantoms, useful for many US-based medical procedures, and to fabricate smart materials for stimulating cells with a highly
controlled US dose.
3.2 Material characterization Material preparation
Agarose (AG) samples were prepared by dissolving agarose powder (Sigma-Aldrich) in deionized and degassed water (dd-H2O) at 6 different concentrations (2, 3, 4, 5.5, 6.5, 7.5 % w/v). Solutions were kept at 90° C for 1 h under continuous stirring and then cooled down at room temperature to allow material reticulation.
Polyacrylamide (PAA) gels were produced at 6 different concentrations by varying the percentages of acrylamide (A) and Bis-acrylamide (B-A) (Sigma-Aldrich) in dd-H2O as follows: PAA5% (5%A, 0.1%B-A w/v), PAA7% (7%A, 0.2%B-A w/v), PAA9% (9%A, 0.3%B-A w/v), P0.3%B-A0.3%B-A11% (11%0.3%B-A, 0.4%B-0.3%B-A w/v), P0.3%B-A0.3%B-A13% (13%0.3%B-A, 0.5%B-0.3%B-A w/v) and P0.3%B-A0.3%B-A15% (15%A, 0.6%B-A w/v). All samples were supplemented with 1/200 v/v of 10% ammonium persulfate (Sigma-Aldrich) and 0.15% v/v of N,N,N',N'-tetramethylethylenediamine (TEMED, Sigma-Aldrich) to promote crosslinking reactions.
PDMS samples (Sylgard 184, Dow Corning) were prepared in 6 different monomer/curing agent ratios (60:1, 50:1, 40:1, 30:1, 20:1, 10:1 w/w); the mixture was degassed under vacuum for 30 min, poured into proper molds and then thermally treated at 65°C, overnight.
33
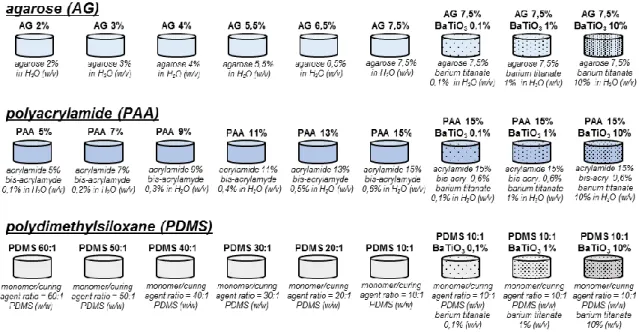
Three additional formulations for each class of material were produced by doping the stiffest formulation (AG 7,5%, PAA 13% and PDMS 10:1) with barium titanate nanoparticles (BaTiO3, 99.9% barium titanate, 100 nm of nominal size, Nanostructured & Amorphous Materials, Inc). BaTiO3 nanoparticles were added in solution at 3 different concentrations (0.1, 1 and 10% w/v) before the reticulation process completed, to obtain homogeneous nanocomposites.
To overcome the issue of a rather poor nanoparticle dispersibility in aqueous solutions (for PAA and AG gels), they were first mixed with a 0.1% w/v glycol chitosan (Sigma-Aldrich) solution and sonicated overnight (2510, Bransonic sonicator). This treatment guaranteed a polymer wrapping around nanoparticles, which enhanced their dispersibility and long-term stability [69]. Then, the glycol chitosan-wrapped nanoparticles were used to prepare the composite samples. Figure 3.2 summarizes the different sample types prepared and tested in this study.
All material types were obtained through properly designed Teflon molds. Cylindrical specimens of diameter (d) = 30 mm and height (h) = 20 mm were used for acoustic tests.
Figure 3.2. Schematic representation of material formulations used for preparing the different sample
34
3.2.1 Acoustic characterization
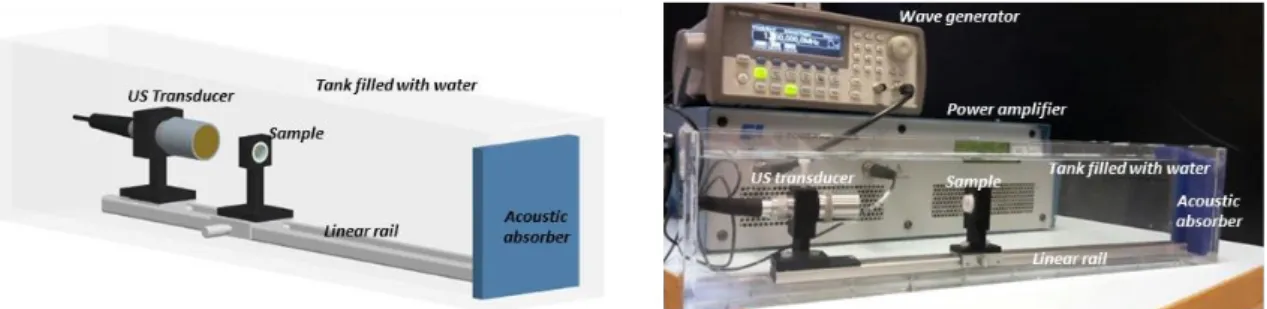
Material speed of sound (c) and attenuation coefficient (α) were measured by using an insertion technique (also referred as through-transmission technique), in which the unknown acoustic properties of the material under investigation were obtained from comparison with the properties of a reference material (i.e. water) [70]. The used experimental set-up is depicted in Figure 3.3-a. The sample was positioned between a US transducer used as transmitter (WS75-2 or WS75-5, Ultran Group) and a needle hydrophone (0.2 mm, Precision Acoustics Ltd) used as receiver. dd-H2O was used as
coupling medium and reference material. Sample and hydrophone were aligned along the main axis of the US transducer in order to maximize the acquired signal.
The US transducer was driven by a wave generator (33220A, Agilent Technologies), connected in series with a 50 dB power amplifier (240L, Electronics & Innovation). A dedicated LabVIEW graphic user interface allowed the remote control of the wave generator and its synchronization with an oscilloscope (7034B, InfiniiVision, Agilent Technologies), from which the hydrophone signal was acquired at a 40 MHz sampling frequency. For all measurements, signals were mediated 10 times in order to significantly reduce noise. At least 3 independent samples for each formulation were tested.
Material c was calculated according to Equation 6.1, where h is the sample thickness,
Δt is the delay between the time of flight measured in presence of the sample and the
time of flight measured in absence of the sample. c in water (cw) was calculated as a function of temperature, by using the polynomial interpolation proposed by Marzak [71]. For a simple evaluation of the time of flight, the US transducer (WS75-2) was driven with a pulse signal (250 ns width and 5 ns edge time) and the maximum peak of the acquired signal was considered for time of flight estimation. An example of the acquired signals for c measurements in presence and in absence of the sample is shown in Figure 3.3-b.
𝑐 =
ℎ𝛥𝑡+ℎ
𝑐𝑤
35
Acoustic Impedance (Z) was calculated by multiplying c by material density (ρ), calculated as the ratio between sample mass and volume (Equation 2.9, Section 2.1.1). Volume was assessed with a water-displacement technique [50], using a measurement sensitivity of 100 μL and using a Hirox microscope (Hi-scope KH-2700), mounted orthogonally to the liquid column in which the sample was immersed, to precisely discriminate volume changes.
α was evaluated at 5 different frequencies (1, 2, 3, 4 and 5 MHz) using Equation 6.2, where Am and Aw are the root mean square of the acquired signal when the US transducer (WS75-2 for frequency f = 1, 2, 3 MHz and WS75-5 for f = 4, 5 MHz) was driven with a sinusoidal tone burst of 40 cycles at frequency f in presence and absence of the sample, respectively, and h is the sample thickness. Representative signals acquired in presence and absence of the sample and used for α estimation are shown in Figure 3.3-c.
𝛼 =
20 ℎ 𝑙𝑜𝑔10(
𝐴𝑚 𝐴𝑤)
Eq. 3.2To validate the system, the c of castor oil (Eur. Pharm. Grade, Acros Organics), featured by well-established properties and commonly used as acoustic reference material [72], was measured. The castor oil c value resulted 1508.8 ± 2.8 m/s at 28.8 °C, while α values were 0.85 ± 0.22, 2.68 ± 0.16, 5.02 ± 0.55, 8.90 ± 0.32 and 12.22 ± 0.79 dB/cm for f=1,2,3,4 and 5 MHz, respectively. These values were in line with those ones reported in previous studies [73, 74], thus confirming the reliability of the described set-up.
The results of c and Z measurements are reported in Table 3.1 (AG), Table 3.2 (PAA) and Table 3.3 (PDMS) and in Figure A.1 in the Appendix C. The average c values were in the range from 1490.0 to 1512.1 m/s for AG, from 1514.2 to 1555.4 m/s for PAA and from 1021.6 to 1054.7 m/s for PDMS.
There was a clear trend of c values, which increased in correspondence to more concentrated solutions or more cross-linked formulations for each class of material. By contrast, the presence of nanoparticles in the matrix generally resulted in a decrease of c values.
36
Figure 3.3. Scheme of the experimental set-up used for speed of sound (c) and attenuation (α)
measurements. Examples of signals acquired for c (b) and α (c) evaluation: reference signals (corresponding to water) and sample signals are represented with black and red lines, respectively.
The average values of Z ranged from 1.490 to 1.643 MRayls for AG, from 1.535 to 1.667 MRayls for PAA and from 1.017 to 1.129 MRayls for PDMS, with greater values in correspondence to more concentrated or more cross-linked formulations, similarly to c results. Doped materials generally showed higher Z values in comparison with non-doped counterparts, with the exception of PAA samples.
Such results confirm previous findings [42, 48] and further expand the knowledge on acoustic properties of these material classes, by analyzing a broader formulation range and BaTiO3 nanoparticle-based composites. The presence of BaTiO3 reduced speed of
sound. This may appear as counterintuitive, but it is confirmed by other studies reporting reduced c values for materials provided with metal or ceramic fillers, in comparison with non-doped controls [47]. A different trend can be observed for Z measurements, probably because the decreased speed of sound was compensated by the higher density values of nanocomposites.
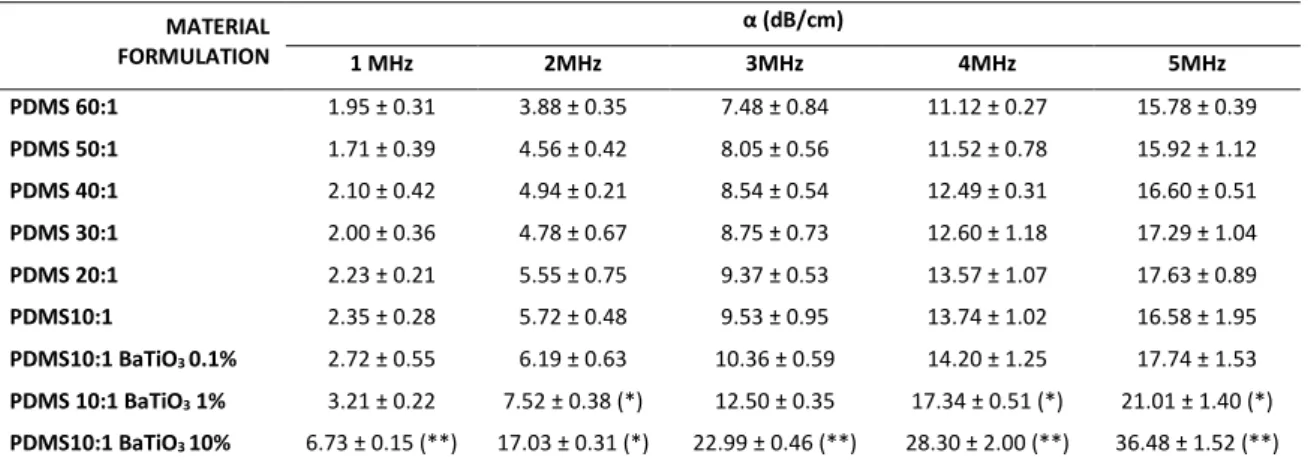
Regarding α measurement, results are reported in Table 3.4 for AG, Table 3.5 for PAA and Table 3.6 for PDMS, for US frequencies ranging from 1 up to 5 MHz.
37
The measured α of non-doped AG and PAA materials are in-line with typical values of hydrogels [50, 56], with values smaller than 1 dB/cm. PDMS samples showed significantly higher α values in comparison with AG and PAA samples, up to 17.63 dB/cm (PDMS 20:1 @ 5MHz) and 36.48 dB/cm (PDMS 10:1 BaTiO3 10%, @5MHz). Although a trend was rather clear (α values increasing with material concentration), no statistically significant differences are always evident between different concentrations of non doped materials. Statistically significant differences were found almost between doped and non-doped materials, at high nanoparticle concentrations, demonstrating that the adjunction of BaTiO3 statistically increases the attenuation
coefficient of AG, PAA and PDMS. Doped materials showed in fact α values up to 10.46 dB/cm for AG (AG 7.5% BaTiO3 10%, @5MHz), 3.13 dB/cm for PAA (PAA 15% BaTiO3
10%, @5MHz) and 36.48 dB/cm (PDMS 10:1 BaTiO3 10%, @5MHz). The variation of
acoustic properties due to BaTiO3 nanoparticles had been never analyzed before.
Figure A.2, Figure A.3, Figure A.4 in Appendix C show graphical representations of α measurements.
38
MATERIAL FORMULATION c (m/s) Z (MRayl)
AG 2% 1490.0 ± 2.0 1.490 ± 0.038 AG 3% 1491.9 ± 1.9 1.538 ± 0.037 AG 4% 1497.2 ± 1.2 (*) 1.567 ± 0.013 AG 5.5% 1503.3 ± 0.9 (**) 1.565 ± 0.028 AG 6.5% 1505.9 ± 0.7 (*) 1.582 ± 0.013 AG 7.5% 1512.1 ± 1.3 (**) 1.590 ± 0.024 AG 7.5% BaTiO3 0.1% 1511.8 ± 1.1 1.563 ± 0.026 AG 7.5% BaTiO3 1% 1511.5 ± 3.2 1.619 ± 0.042 AG 7.5% BaTiO3 10% 1507.8 ± 4.1 1.643 ± 0.040
Table 3.1. Speed of Sound (c) and Acoustic Impedance (Z) (average ± SD) for AG and related
nanocomposites. At least 3 independent samples were tested for each sample type. Statistical comparisons refer to values on each column: each sample is compared with the one reported in the row
immediately above. *=p<0.05, **=p<0.01.
MATERIAL FORMULATION c (m/s) Z (MRayl)
PAA 5% 1514.2 ± 3.1 1.535 ± 0.025 PAA 7% 1520.7 ± 2.5 (*) 1.543 ± 0.016 PAA 9% 1528.7 ± 1.2 (**) 1.596 ± 0.020 (*) PAA 11% 1539.5 ± 2.7 (**) 1.608 ± 0.044 PAA 13% 1548.5 ± 2.9 (*) 1.664 ± 0.035 PAA 15% 1555.4 ± 1.2 (*) 1.667 ± 0.024 PAA 15% BaTiO3 0.1% 1553.8 ± 2.3 1.663 ± 0.030 PAA 15% BaTiO3 1% 1552.8 ± 2.2 1.644 ± 0.027 PAA 15% BaTiO3 10% 1541.5 ± 1.5 (**) 1.633 ± 0.012
Table 3.2. Speed of Sound (c) and Acoustic Impedance (Z) (average ± SD) for PAA and related
nanocomposites. At least 3 independent samples were tested for each sample type. Statistical comparisons refer to values on each column: each sample is compared with the one reported in the row
immediately above. *=p<0.05, **=p<0.01.
MATERIAL FORMULATION c (m/s) Z (MRayl)
PDMS 60:1 1021.6 ± 4.9 1.017 ± 0.005 PDMS 50:1 1023.6 ± 3.6 1.016 ± 0.004 PDMS 40:1 1026.5 ± 3.6 1.045 ± 0.003 (**) PDMS 30:1 1033.6 ± 4.4 1.071 ± 0.005 (**) PDMS 20:1 1040.6 ± 5.5 1.079 ± 0.006 PDMS 10:1 1054.7 ± 5.6 (*) 1.095 ± 0.006 (*) PDMS 10:1 BaTiO3 0.1% 1051.0 ± 9.5 1.087 ± 0.010 PDMS 10:1 BaTiO3 1% 1040.5 ± 4.3 1.076 ± 0.005 PDMS 10:1 BaTiO3 10% 1031.5 ± 4.8 1.129 ± 0.005 (**)
Table 3.3. Speed of Sound (c) and Acoustic Impedance (Z) (average ± SD) for PDMS and related
nanocomposites. At least 3 independent samples were tested for each sample type. Statistical comparisons refer to values on each column: each sample is compared with the one reported in the row
39 MATERIAL FORMULATION α (dB/cm) 1 MHz 2MHz 3MHz 4MHz 5MHz AG 2% 0.18 ± 0.14 0.16 ± 0.12 0.23 ± 0.19 0.27 ± 0.11 0.26 ± 0.14 AG 3% 0.21 ± 0.16 0.22 ± 0.12 0.27 ± 0.11 0.43 ± 0.26 0.33 ± 0.22 AG 4% 0.27 ± 0.23 0.39 ± 0.25 0.35 ± 0.25 0.52 ± 0.30 0.32 ± 0.22 AG 5.5% 0.33 ± 0.22 0.40 ± 0.31 0.39 ± 0.18 0.62 ± 0.14 0.88 ± 0.30 (*) AG 6.5% 0.28 ± 0.16 0.27 ± 0.20 0.33 ± 0.23 0.54 ± 0.20 0.78 ± 0.21 AG 7.5% 0.39 ± 0.19 0.47 ± 0.23 0.41 ± 0.17 0.76 ± 0.23 0.99 ± 0.16 AG 7.5% BaTiO3 0.1% 0.58 ± 0.32 0.55 ± 0.28 0.44 ± 0.32 0.97 ± 0.50 1.40 ± 0.35 AG 7.5% BaTiO3 1% 0.96 ± 0.61 1.48 ± 0.72 (*) 1.11 ± 0.62 1.75 ± 0.55 (*) 2.42 ± 0.93 AG 7.5% BaTiO3 10% 6.97 ± 1.03 (**) 6.76 ± 1.86 (**) 8.28 ± 2.15 (**) 9.38 ± 1.47 (**) 10.46 ± 1.22 (**)
Table 3.4. Attenuation Coefficient α (average ± SD) for AG and related nanocomposites. At least 3
independent samples were tested for each sample type. Statistical comparisons refer to values on each column: each sample is compared with the one reported in the row immediately above. *=p<0.05,
**=p<0.01. MATERIAL FORMULATION α (dB/cm) 1 MHz 2MHz 3MHz 4MHz 5MHz PAA 5% 0.17 ± 0.15 0.32 ± 0.26 0.26 ± 0.17 0.36 ± 0.30 0.39 ± 0.26 PAA 7% 0.17 ± 0.12 0.26 ± 0.21 0.23 ± 0.17 0.25 ± 0.16 0.47 ± 0.35 PAA 9% 0.13 ± 0.08 0.19 ± 0.13 0.24 ± 0.18 0.35 ± 0.24 0.53 ± 0.41 PAA 11% 0.19 ± 0.10 0.28 ± 0.19 0.18 ± 0.11 0.26 ± 0.22 0.65 ± 0.47 PAA 13% 0.21 ± 0.12 0.23 ± 0.17 0.30 ± 0.16 0.43 ±0.30 0.42 ± 0.22 PAA 15% 0.25 ± 0.17 0.25 ± 0.20 0.24 ± 0.16 0.36 ± 0.22 0.61 ± 0.36 PAA 15% BaTiO3 0.1% 0.47 ± 0.17 0.49 ± 0.20 0.55 ± 0.41 0.97 ±0.55 (*) 1.65 ± 0.58 (*) PAA 15% BaTiO3 1% 0.64 ± 0.26 0.53 ± 0.24 0.91 ± 0.51 1.15 ± 0.55 2.16 ± 0.57 PAA 15% BaTiO3 10% 0.70 ± 0.30 0.85 ± 0.40 1.81 ± 0.61 1.78 ± 0.59 3.13 ± 0.62
Table 3.5. Attenuation Coefficient α (average ± SD) for PAA and related nanocomposites. At least 3
independent samples were tested for each sample type. Statistical comparisons refer to values on each column: each sample is compared with the one reported in the row immediately above. *=p<0.05.
MATERIAL FORMULATION α (dB/cm) 1 MHz 2MHz 3MHz 4MHz 5MHz PDMS 60:1 1.95 ± 0.31 3.88 ± 0.35 7.48 ± 0.84 11.12 ± 0.27 15.78 ± 0.39 PDMS 50:1 1.71 ± 0.39 4.56 ± 0.42 8.05 ± 0.56 11.52 ± 0.78 15.92 ± 1.12 PDMS 40:1 2.10 ± 0.42 4.94 ± 0.21 8.54 ± 0.54 12.49 ± 0.31 16.60 ± 0.51 PDMS 30:1 2.00 ± 0.36 4.78 ± 0.67 8.75 ± 0.73 12.60 ± 1.18 17.29 ± 1.04 PDMS 20:1 2.23 ± 0.21 5.55 ± 0.75 9.37 ± 0.53 13.57 ± 1.07 17.63 ± 0.89 PDMS10:1 2.35 ± 0.28 5.72 ± 0.48 9.53 ± 0.95 13.74 ± 1.02 16.58 ± 1.95 PDMS10:1 BaTiO3 0.1% 2.72 ± 0.55 6.19 ± 0.63 10.36 ± 0.59 14.20 ± 1.25 17.74 ± 1.53 PDMS 10:1 BaTiO3 1% 3.21 ± 0.22 7.52 ± 0.38 (*) 12.50 ± 0.35 17.34 ± 0.51 (*) 21.01 ± 1.40 (*) PDMS10:1 BaTiO3 10% 6.73 ± 0.15 (**) 17.03 ± 0.31 (*) 22.99 ± 0.46 (**) 28.30 ± 2.00 (**) 36.48 ± 1.52 (**)
Table 3.6. Attenuation Coefficient α (average ± SD) for PDMS and related nanocomposites. At least 3
independent samples were tested for each sample type. Statistical comparisons refer to values on each column: each sample is compared with the one reported in the row immediately above. *=p<0.05,