Alma Mater Studiorum – Università di Bologna
DOTTORATO DI RICERCA IN
Scienze Mediche Specialistiche
Ciclo XXVII
Settore Concorsuale di afferenza: 06/D1
Settore Scientifico disciplinare: MED 11
TITOLO TESI
A simple voltage/mass index increases the suspicion of
amyloidotic cardiomyopathy: an electrocardiographic and
echocardiographic study of 767 patients with increased
left ventricular wall thickness due to different causes.
Presentata da:
Dott.ssa CANDIDA CRISTINA QUARTA
Coordinatore Dottorato
Relatore
Prof. Roberto Di Bartolomeo
Prof. Claudio Rapezzi
2
Index
Introduction
.………...3Aims
.………..…....…5Methods
.………..………..…...6- Clinical setting and study design.………..….6
- Diagnostic definitions.……….……8
- Amyloidosis and amyloidotic cardiomyopathy (AC) .……….….……..8
- Hypertrophic cardiomyopathy (HCM) .……….…….……8
- Hypertensive heart disease (HHD)…….……….…….……8
- Instrumental definitions……….…….……9
- ECG……….…....9
- Echocardiography……….…….9
- Statistical analysis.……….……..9
Results
.……….……….……..11- Study population and instrumental findings.………..…11
- Diagnostic performance of ECG for the identification of cardiac amyloidosis……..….12
Discussion
……….……….…14 - Limitations……….………...…….….…16Conclusions
……….………..16References
……….………...……17Figure
legends
……….………..………21Tables
……….……….…………22Figures
……….………...…373
Introduction
The term amyloidosis describes a large group of hereditary or acquired rare conditions caused by the extracellular deposition of insoluble amyloid fibrils composed of misfolded
proteins, which leads to a loss of the normal architecture and function of the involved tissues and organs.1 These disorders can be due to many proteins,1 but the fibrillary deposits share distinctive structural and tinctorial properties: namely, an amorphous eosinophilic appearance under light microscopy using routine histological stains; an “apple-green” birefringence after Congo-red staining under a polarized light microscope (Figure 1); presence of rigid nonbranching fibrils 7.5–10 nm in diameter on electron microscopy; and a predominantly antiparallel β-sheet secondary structure visible under infrared and X-ray diffraction.1 Amyloidoses are classified according to the protein composition of the fibrils and by the clinical features of the disease.
The most common types of systemic amyloidosis associated with a clinically relevant cardiac involvement include AL amyloidosis and the transthyretin (TTR)-related forms. AL (where A stands for amyloidosis and L for light-chains) is due clonal plasma cells in the bone marrow producing an abnormal amount of circulating immunoglobulin free light chains, which are responsible of the fibrillary deposits.2 The incidence of AL is uncertain, but is thought to be 6 to 10 new cases/year per million population in the United Kingdom and United States. This type of amyloidosis is a rapidly progressive disease that affects multiple organs, including the heart in 50% of patients. The prognosis of patients with AL amyloidosis is poor when heart failure is present, with a median survival of 5 months from diagnosis. Transthyretin is a protein mainly produced by the liver, which transports thyroxin and retinol binding protein, and can lead to two distinct forms of amyloidosis. The hereditary, TTR-related form (ATTRm) can be caused by over 100 point-mutations of TTR. The clinical spectrum of ATTRm varies widely from an exclusively neurologic involvement to a predominantly cardiac presentation. This heterogeneity is linked to several factors including specific TTR variants, patient and transmitting parent gender, geographic distribution and endemic vs. non-endemic aggregation type.3 On the contrary, wild-type TTR-related amyloidosis (ATTRwt, also known as systemic “senile” amyloidosis or SSA), in which the TTR amino acid sequence is normal, almost exclusively affects the hearts of elderly men.2,3 In all these main etiologic subtypes of the disease, the presence of cardiac involvement is a well-known negative prognostic factor.2
4
Intramyocardial amyloid infiltration leads to a progressive increase of ventricular wall thickness and stiffness of the heart.1,2
Echocardiography is the most widely used non-invasive test in patients with heart failure or abnormal cardiac findings on examination. Patients with amyloidosis may have significant cardiac abnormalities, several of which are highly suggestive of the disease.2,3
Echocardiographically, amyloidotic cardiomyopathy (AC) is defined by left ventricular (LV) wall thickness > 12 mm in the absence of any other plausible causes of LV hypertrophy. Figure 2a shows representative echocardiographic findings in AC, including biventricular wall
thickening, an increased thickness of the interatrial septum and of the valve leaflets, mild pericardial effusion.
The diagnosis of cardiac amyloidosis is challenging and relies on a high degree of clinical suspicion. When AC is an isolated disorder or when the cardiac manifestations of a multi-organ involvement predominate, the correct recognition of the disease can be difficult since it can mimic other more common causes of true LV hypertrophy, including hypertrophic
5
Aims
Although a definite diagnosis of AC is largely based on imaging modalities ―in
particular cardiac magnetic resonance and echocardiography― and tissue biopsy, ECG remains a first-line diagnostic test essential in prompting the diagnostic suspicion. Characteristic
electrocardiography tracing from patients with AC (Figure 2b) show low QRS voltage in the limb leads, ‘pseudo-infarction’ patterns, and T-wave abnormalities that resemble ischemia. However, even if the importance of the ECG at this level has been pointed out for a long time, the suggested ECG diagnostic signs rely on a few studies, each including a limited number of patients mainly with AL amyloidosis.6,7 without any gender distinction and validated cut off. TTR-related AC, which can mimic other cardiomyopathies more frequently than AL, has been much less focused on.4 Furthermore, the control groups in these studies mainly included patients with secondary LV hypertrophy or even without LV hypertrophy.8-10
We aimed to assess and validate the diagnostic value of ECG for non-invasive identification of AC in a clinical setting of patients with increased LV wall thickness due to a large spectrum of conditions, including AL and TTR-related amyloidosis, HCM and HHD.
6
Methods
Clinical setting and study design
We conducted a multicenter retrospective study based on data pooled from two large Italian referral Centers for the diagnosis and management of systemic amyloidosis (Bologna and Pavia) and hypertrophic cardiomyopathy (Bologna). Since 1990 these Centers provide
coordinated amyloidosis networks involving neurology, cardiology, haematology and nephrology services, genetic research groups, and liver/heart transplantation programs.
All consecutive patients with echocardiographically defined AC and genetically/biopsy proven amyloidosis due to AL, ATTRm or ATTRwt evaluated at our Centres between 1990 and December 2012 were enrolled. Exclusion criteria included: coexistent, more than mild, pericardial effusion and clinical history of coronary artery disease.
For comparison, we included patients with genetically proven (or familial) HCM (defined below) from the cardiomyopathies clinic at Bologna Center and patients with HHD (defined below) included in the database of our Echocardiographic Labs in the same period.
Exclusion criteria for the control groups were: coexistent, more than mild, pericardial effusion; clinical history of coronary artery disease; concomitant hematologic diseases including the monoclonal gammopathy of undetermined significance; apical HCM; end-stage evolution of HCM.11
We reviewed the clinical, electrocardiographic and echocardiographic data of the three groups at the time of their first evaluation at either Center.
To assess the diagnostic performance of all proposed indices, a first analysis was conducted in the first 469 consecutive patients, who presented at our centers and who were diagnosed with either AC of the different etiologies, or HHD or HCM. We analyzed and compared the
diagnostic performance of different indexes for the identification of AC, separately for females and males. We included in the analysis low QRS voltage as a pure ECG marker of cardiac amyloidosis, as well as the presence of symmetric LV hypertrophy as an isolated
echocardiographic marker of an infiltrative phenotype. In addition to these indices, we evaluated the diagnostic performance of previously described and new indexes combining electrical (electrocardiographic) and anatomical (echocardiographic) mass:
1. Low QRS voltage (QRS amplitude ≤0.5 mV in all limb leads or ≤ 1 mV in all precordial leads);
7
2. Presence of symmetric LV hypertrophy, defined as a ratio between the end-diastolic thickness of the interventricular septum and of the LV posterior wall was less than 1.3. 3. Sokolow index (sum of S wave in lead V1 and R wave in lead V5 or V6) divided by the
cross-sectional area (CSA) of the LV wall, where CSA was calculated according to Carroll JD et al: CSA = (π()*((LV end-diastolic diameter/20)+mean LV wall thickness/10)^2-π()*(LV end-diastolic diameter/20)^2)/body surface area, (mm/cm2
/m2);8
4. Low QRS voltage in combination with interventricular septal thickness >1.98 cm, according to Rahman et al;9
5. Sokolow index divided by LV mass indexed to body surface area (LVMI), (mm/(g/m2)); 6. Sokolow index divided by LV wall thickness
7. Sokolow divided by LV wall thickness indexed to height^2.7 (mm/m2.7)
8. Peripheral QRS score (sum of QRS voltages in the limb leads) divided by LVMI (mV/(g/m2));
9. Peripheral QRS score divided by LV wall thickness (mV/mm);
10. Peripheral QRS score divided by LV wall thickness indexed to height2.7, (mV/(mm/m2.7)), 11. Total QRS score (sum of QRS voltages in the limb and precordial leads) divided by LVMI
(mV/(g/m2));
12. Total QRS score divided by LV wall thickness (mV/mm);
13. Total QRS score divided by LV wall thickness indexed to height2.7 (mV/(mm/m2.7));
We tested these indexes in the following settings, which represent the most common scenarios in the clinical practice:
- Identification of AC due to AL, ATTRm or ATTRwt vs. other causes of LV hypertrophy (HCM and HHD);
- Identification of AC due to AL, ATTRm or ATTRwt vs. HCM;
- Identification of AL-related AC vs. other causes of LV hypertrophy (HCM and HHD); - Identification of AL-related AC vs. HCM;
- Identification of TTR-related AC (either ATTRm or ATTRwt) vs. other causes of LV hypertrophy (HCM and HHD);
8
For the continuous indices we generated separated cut-off values for males and females of for the identification of AC in the different settings. Indexes associated with the best diagnostic
performances were then tested in a second group of 298 consecutive patients with either AC, HHD or HCM.
At presentation, all patients provided informed consent for anonymous publication of scientific data. In our country, formal ethical approval was not applicable for this observational retrospective study involving only routinely performed procedures performed during the diagnostic work-up.
Diagnostic definitions
Amyloidosis and amyloidotic cardiomyopathy (AC). Diagnosis of amyloidosis was
defined by histological documentation of Congo-red staining and apple-green birefringence under cross-polarized light in at least one involved organ.12 AC was echocardiographically defined as end-diastolic thickness of the interventricular septum >1.2 cm in the absence of any other plausible causes of ventricular hypertrophy.2,13
Clear-cut distinction between TTR-related and AL amyloidosis was based on genotyping and/or immunohistochemistry.2,14 Diagnosis of ATTRm was defined by a documented
transthyretin mutation at DNA analysis following procedures described elsewhere;15 ATTRwt by positive immunohistochemistry for TTR (at endomyocardial biopsy (EMB)) in the absence of TTR mutation at DNA analysis;16 AL by presence of monoclonal plasma cells at bone marrow biopsy, in absence of both immunostaining for TTR and TTR mutation at DNA analysis.17,18
Hypertrophic cardiomyopathy (HCM). Diagnosis of HCM was based on an
echocardiographic maximal LV wall thickness >13 mm in any myocardial segment, or a septal/posterior wall thickness ratio >1.3 in normotensive patients, or a septal/posterior wall thickness ratio >1.5 in hypertensive patients,19,20 after an accurate and extensive work-up including molecular genetics, pedigree construction, cardiac magnetic resonance, 99mTC-DPD scintigraphy,21 and EMB in selected cases. Only patients with genetically proven sarcomeric HCM or with a clear family history of HCM were included in the study.
Hypertensive heart disease (HHD). Clinical diagnosis of HHD was based on the
presence of LV hypertrophy at echocardiography (mean LV wall thickness >11 mm) in patients with long-standing history of arterial hypertension on antihypertensive therapy, in the absence of
9
other plausible causes of LV hypertrophy after an accurate and extensive work-up including molecular genetics, pedigree construction, cardiac magnetic resonance, 99mTC-DPD scintigraphy, and EMB in selected cases.
Instrumental definitions.
ECG and echocardiographic measurements were based on the standard definitions.22,23
ECG. Abnormal ECG was defined as presenting of one or more of the following features:
conduction disturbances (atrioventricular block, right bundle branch block, left bundle branch block, left anterior or posterior hemiblock), low QRS voltages (QRS amplitude ≤0.5 mV in all limb leads or ≤1 mV in all precordial leads), ST and T wave abnormalities and ‘pseudo-infarction’ pattern (pathological Q waves, in absence of coronary artery disease).
Echocardiography. Echocardiograms were analyzed for the following characteristics:
interventricular septal thickness, posterior wall thickness, LVMI, LV end-diastolic diameter, atrial size, overall LV ejection fraction (calculated with the Simpson method).23,24 LV mass was calculated according to the Devereux method and classified as ‘increased’ when >130g/m2 in men and >110 g/m2 in women.25
Statistical analysis.
Summary statistics were expressed as median [interquartile range] or numbers (percentages). Independence of categorical variables was tested using Fisher's exact test or Pearson's chi-square test. Independence of continuous variables was tested using Mann-Whitney U test or Kruskal-Wallis test. For multiple comparisons we calculated Bonferroni-adjusted p values. Spearman’s rank correlation coefficient (rho) was used to study the possible correlation between total QRS score and LVMI.
Receiver operator characteristic (ROC) curves were constructed to determine separate cut-off values for males and females of the different ECG/echocardiographic derived indexes for the identification of cardiac amyloidosis in the different subsets derived from a population of 469 consecutive patients. Sensitivity, specificity, positive (LR+) and negative (LR-) likelihood ratios were calculated. The indices associated with the best diagnostic performance were then tested in a second group of 298 consecutive patients. Finally, we performed a cumulative analysis
10
including the whole cohort of 767 consecutive patients. Analyses were conducted using STATA 11.2 SE. P values <0.05 were considered significant.
11
Results
Study population and instrumental findings.
The main analysis included 469 patients: 262 patients with AC (AL, n=161; ATTRm, n=71; ATTRwt, n=30), and 106 with HCM and 101 with HHD, respectively, as control group. The validation group included 298 patients: 62 with AC (AL, n=30; ATTRm, n=17; ATTRwt, n=15), 67 with HCM, and 169 with HHD.
Amyloidosis was histologically documented in each case with AL (abdominal fat biopsy in 237 cases, EMB in 72 cases, other biopsies in the remaining 20 cases) or ATTRwt (EMB in all 45 cases). Among the 88 patients with ATTRm, EMB was performed in 63. In the remaining 25 cases the diagnosis was based on molecular genetics and on the typical echocardiographic pattern in absence of other plausible causes of LV “hypertrophy” after an extensive work up including cardiac magnetic resonance and 99mTc-DPD scintigraphy in selected cases.
Among the 173 patients with HCM, sarcomere gene mutations were searched for in 117 patients and found in 80: MYBPC3 in 52 cases, TNNT2 in 5, MYH7 in 7, TNNI3 in 2. Double mutations were found in 14 patients (MYBPC3-MYH7 in 8 cases, MYBPC3-TNNT2 in 2, MYBPC3-TNNI3 in 2, MYBPC3-TPM1 in 2). All the other gene negative cases included in the study had a clear family history of HCM. EMB was performed, for clinical reasons, in 10 patients (without sarcomeric mutations) to exclude infiltrative or storage diseases. We excluded 70 HCM patients evaluated during the same period with end-stage (n=38) or apical (n=20) forms, or with associated coronary artery disease or equivocal diagnosis (n=12).
EMB was performed in 13 of the 270 patients with a final diagnosis of HHD and ruled out infiltrative/storage diseases in all cases. We excluded 20 patients evaluated during the same period due to an associated coronary artery disease or absence of the clinical / laboratory information needed for ruling out infiltrative/storage diseases.
Table 1 summarizes the main clinical and echocardiographic characteristics of the consecutive 469 patients included in the main analysis, according to the etiological subgroups. As expected, hypertensive patients were the oldest; male gender was predominant in all three subgroups, with 90% prevalence in ATTRwt. AC patients showed more frequently a severe heart failure (NYHA class III/IV) at presentation. On echocardiogram, LV wall thickness was greater
12
in patients with HCM and with AC. LV “hypertrophy” was generally more asymmetric in HCM and concentric in the other groups. LV ejection fraction was around the lower normal limits in AC, normal in HHD and “supernormal” in HCM. Left atrium was, on average, larger in AC and in HCM than in HHD.
Table 2 summarizes the main ECG findings and the combined ECG/echocardiographic (ECG/ECHO) indexes in the three groups of patients. Patients with AC and HCM more
frequently showed abnormal ECGs. A low voltage pattern was more frequent in AC than in the other groups (with the highest prevalence in AL-related amyloidosis). Pseudo-infarct pattern was more frequent in AC than in HCM, whereas abnormally negative T waves were predominant in HCM. All the ECG/ECHO indexes were significantly higher in HCM patients than in HHD and AC (p<0.001).
Diagnostic performance of ECG for the identification of cardiac amyloidosis.
In order to assess the diagnostic performance of the ECG/ECHO indexes for the identification of AC among patients with increased LV wall thickness, ROC curves were
constructed to identify the best cut-off values for each combined ECG/ECHO index in males and females (figure 3a and 3b).
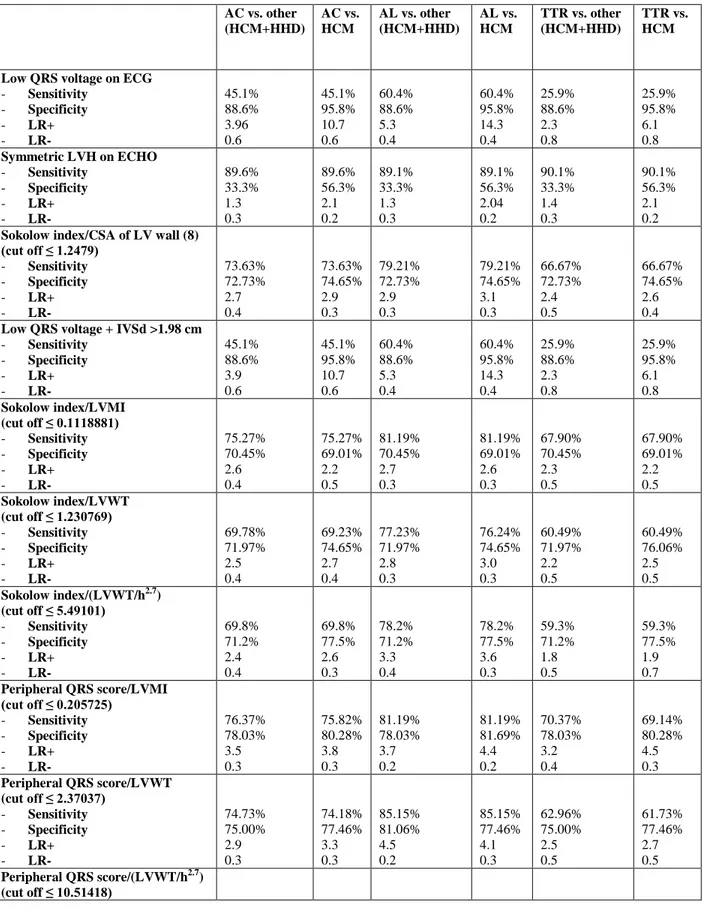
Table 3 summarizes the diagnostic performance (sensitivity, specificity, positive and negative likelihood ratios) associated with the analyzed ECG, ECHO and combined ECG/ECHO indices for the identification of AC in the overall population and in selected subcategories, among males (3a) and females (3b).
As expected, both among males and females, low QRS voltage on ECG showed high specificity and low sensitivity in all clinical contexts. On the contrary, a symmetric LV hypertrophy showed a good sensitivity but poor specificity, which increased when comparing AC and HCM. Compared to the isolated indices, all those combining ECG/ECHO indices showed a higher diagnostic performance for the identification of AC.
Among males, the combined ECG/ECHO index previously proposed by Rahman et al9 was associated with a lower diagnostic performance than expected, while the one by Carrol et al8 was characterized by an average diagnostic performance, comparable to Sokolow index/LVMI ratio, but however lower than other combined indices (including peripheral QRS score/LVMI, peripheral QRS score/LV wall thickness, total QRS score/LVMI, total QRS score/LV wall
13
thickness and total QRS score/LV wall thickness indexed to height2.7). Total QRS score divided by LV wall thickness indexed to height^2.7 provided the best overall diagnostic performance in the overall cohort and in the different subgroups, with an AUC (figure 2a) significantly higher than that of Sokolow index divided by CSA of LV wall (p=0.006),8 but not significantly higher than that of peripheral QRS score divided by LVMI (p=0.25).
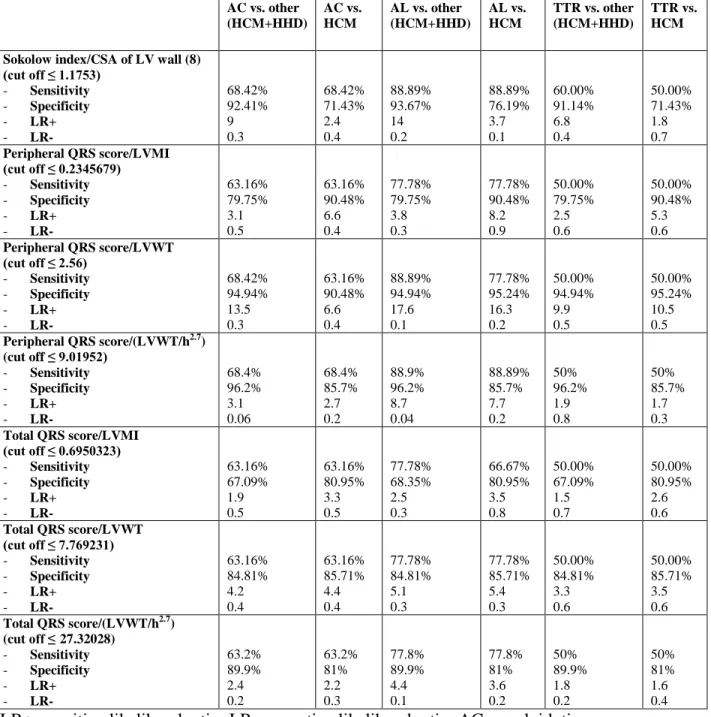
Among females, we observed a lower diagnostic performance for all the indices, likely due to a smaller sample size. However, the index proposed by Rahman9 resulted particularly specific in differentiating AC from other causes of LVH, even when considering only TTR patients. The best diagnostic performance was reached by peripheral QRS score/LVMI,
peripheral QRS score/LV wall thickness indexed to height2.7, total QRS score/LVMI, total QRS score/LV wall thickness and total QRS score/LV wall thickness indexed to height^2.7, which did not result significantly different when considering the AUC associated to the different indices in the ROC curves (figure 2b).
We tested the indices associated with the best diagnostic performance in 200 males (21 AL, 12 ATTRm, 10 ATTRwt, 46 HCM, 111 HHD) and 98 females (9 AL, 5 ATTRm, 5 ATTRwt, 21 HCM, 58 HHD). Table 4 summarizes the diagnostic performance (sensitivity, specificity, positive and negative likelihood ratios) associated with the selected indices in males (4a) and females (4b), finding similar results as described in the main analysis of 469 patients.
We therefore performed a cumulative analysis including the whole cohort of consecutive 767 patients and generated diagnostic performances associated with the different indices
analyzed, which can be found in table 5a and 5b, according to the gender.
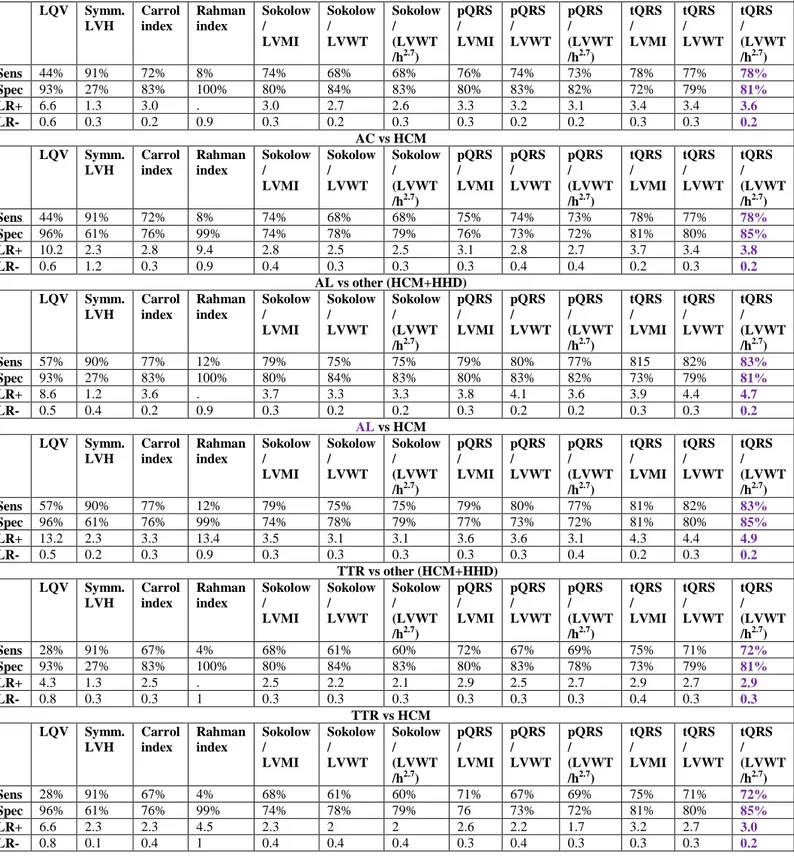
Overall, among males, total QRS score divided by LV wall thickness indexed to
heaight^2.7 turned out to be the one associated with the best diagnostic performance (table 5a). Among females, the best diagnostic performance was associated with total QRS score/ LV wall thickness and total QRS score divided by LV wall thickness indexed to height^2.7, although with no statistical significance with respect to the other combined indices, likely due to a lack of power.
14
Discussion
Our study ─which included the largest series so far of patients with biopsy/genetically-proven AC─ shows that simple indices combining ECG and echocardiographic variables (such as total QRS divided by LVMI or LVWT) can help in identifying AC within a population with increased LV wall thickness due to different etiologies, including AL and TTR-related
amyloidoses, HCM and HHD.
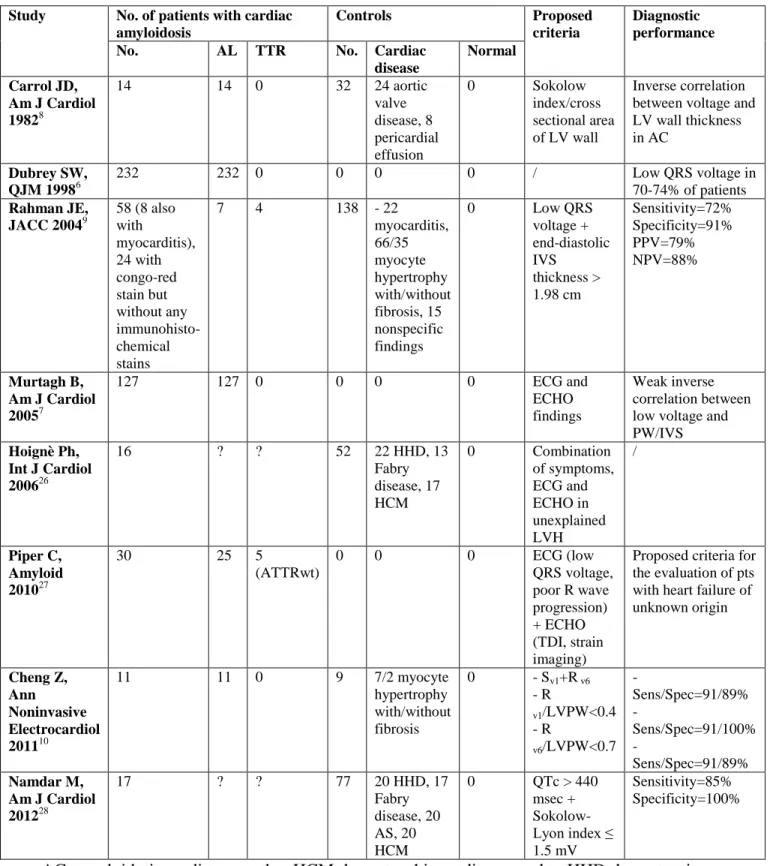
Despite the great development that imaging modalities have achieved in the past years for the non-invasive diagnosis of cardiac amyloidosis, the role of ECG remains fundamental, mainly in the first steps of the diagnostic work-up (table 5).6-10,26-28 Indeed, in order to submit patients to second and third level investigations (including magnetic resonance and EMB) a high
preliminary suspicion is necessary and can only be prompted by a widely available (and inexpensive) tool, such as ECG.
Since the late-sixties low QRS voltage has been considered the mainstay for ECG diagnosis of cardiac amyloidosis.29,30 Prevalence of low QRS voltage was 46% among 127 patients with biopsy-proven AL-related cardiac amyloidosis studied by Murtagh et al.7 A similar prevalence (45%) was recently reported by Cheng et al in a small series of 11 patients with AL amyloidosis10 and by Hoignè et al (40%) in a group of 15 cases with non-etiologically defined cardiac amyloidosis.26 The low QRS prevalence was higher (70-74%) in a larger series with AL cardiac amyloidosis studied by Dubrey et al6 and in a group of 58 patients with cardiac
amyloidosis of different etiologies studied by Rahman et al (56%).9A recent study from our groups questioned the diagnostic role of low QRS voltage by itself, highlighting the effect of the etiology of amyloidosis in the heterogeneity of electrocardiographic manifestations.31 Indeed, in this large cohort of 233 patients with biopsy-proven cardiac amyloidosis including 33% with mutant or wild-type TTR-related disease, we found low QRS voltage in 60% of AL patients as compared with only 25% and 40% in the ATTRm and ATTRwt subgroups, respectively (p<0.001).31 The present study confirms, in a larger population, the elusive role of low QRS voltage by itself for the diagnosis of AC, and the high reliance of this variable on the etiology of amyloidosis. In fact, low QRS voltage was present in 62% of AL patients but only in 24% and 27% of ATTRm and ATTRwt patients respectively (p=<0.001). Interestingly, low QRS voltage was also present in 20% of our control group with hypertensive heart disease, probably due to extensive myocardial fibrosis in a longstanding condition. Consequently, both specificity and
15
sensitivity of this finding for the diagnosis of AC resulted suboptimal, especially when patients with non-AL related AC were considered (Tables 3-5).
In recent years, two seminal albeit small studies8,10 shifted the focus from low QRS voltage by itself to the relation between QRS voltage and LV wall thickness and showed that in AL amyloidosis this relationship appears to be peculiar and distinctive. We tried to overcome the limitations of the previous studies, extending the analyses to a large series of patients with biopsy-proven amyloidosis due to different etiologies. We also selected our control groups very carefully, including patients with HCM and genetically-proven diagnosis or family history of HCM, and patients with systemic hypertension, all of whom displaying HHD.
In our AC population the relation between QRS voltage and LV mass appears quite distinctive regardless of the amyloidosis subtype. The practical consequence of this type of relationship is the possibility of using a simple index combining ECG and echocardiographic variables as a non-invasive first-line diagnostic tool. This index (total QRS score divided by LV wall thickness) consists of a simple ratio between the arithmetic ─not algebraic─ sum of the QRS complexes in peripheral and precordial leads and the LV wall thickness measured on
two-dimensional echocardiogram. Both sensitivity and specificity of this index are high in both males and females, and superior to the previously proposed tests (Sokolow index divided by the cross-sectional area of the LV wall8 and low QRS voltage in combination with interventricular septal thickness >1.98 cm (Tables 3-5 and Figure 3).9 Notably, our index allows an accurate
identification, not only of AL-related cardiomyopathy, but also of hereditary TTR amyloidosis and ATTRwt.
Alongside low QRS voltage and voltage/mass relationship, our study highlights the high frequency of electrocardiographic findings mimicking coronary artery disease (pseudo-infarction and abnormal ST-T waves) regardless of AC etiology and the relatively high frequency of left bundle branch block in ATTRwt (Table 2).
Although our study was not aimed to investigate the electro-genetic mechanisms of ECG abnormalities in cardiac amyloidosis, some insights can stem from our data. Both low QRS voltages and pseudo-infarction patterns have been traditionally interpreted as secondary to the interstitial amyloid deposition leading to electrical “attenuation”. This phenomenon, however, cannot explain all our findings by itself. Indeed, the inverse correlation between voltage and
16
mass in AC is decidedly weak. Other mechanisms, including direct cellular toxic damage and loss or atrophy of myocardial cells could therefore be involved.
Limitations
Our results derive from a retrospective analysis of patients with a high prevalence of AC. Although both sensitivity and specificity of our combined indices are particularly high (the highest among all previously proposed tests), their predictive value in a real world population with unexplained LV hypertrophy is not known. For instance, given the +LR and –LR (Tables 5) associated with total QRS divided by LV wall thickness (indexed or not to height^2.7 depending on gender), the positive and negative predictive value of this test in our setting (where the overall prevalence of AC was 44% among males and 39% among females) are 76% and 82% among males, and 72% and 84%, respectively. If we assume a disease prevalence around 1%, the post-test probability of AC in a male patient with a total QRS score divided by LV wall thickness indexed to height^2.7 < 36.4 would be more than tripled, but around 4%. On the other hand, the post-test probability in a male patient with total QRS score divided by LV wall thickness indexed to height^2.7 > 36.4 would be < 0.3%. This observation underlines the importance of a global approach to the diagnostic work-up of AC, which should not consider the ECG alone but organically, along with the other tools including the clinical evaluation, echocardiography, magnetic resonance and scintigraphy.
Designing this study we intentionally considered only patients with definite cardiomyopathies or overt LV hypertrophy. Thus, our results could not be generalized to cases with initial forms of cardiac amyloidosis or mild HHD, for which dedicated studies should be conducted.
Conclusions.
In cardiac amyloidosis the peculiar relationship between QRS voltages and LV mass is a hallmark of the disease. In patients with increased LV wall thickness, AC can be accurately suspected by a single non-invasive index combining ECG and echocardiographic findings. Total QRS score/LV wall thickness provides the best diagnostic performance across a wide range of disease subtypes including different etiologies of AC, HCM and HHD.
17
References
1. Merlini G, Bellotti V. Molecular mechanisms of amyloidosis. N Engl J Med. 2003;349:583– 96.
2. Falk RH, Dubrey S.W. Amyloid Heart disease. Prog Cardiovasc Dis. 2010;52:347–361. 3. Rapezzi C, Quarta CC, Obici L, Perfetto F, Longhi S, Salvi F, Biagini E, Lorenzini M,
Grigioni F, Leone O, Cappelli F, Palladini G, Rimessi P, Ferlini A, Arpesella G, Pinna AD, Merlini G, Perlini S. Disease profile and differential diagnosis of hereditary transthyretin-relatedamyloidosis with exclusively cardiac phenotype: an Italian perspective. Eur Heart J. 2012 [Epub ahead of print] doi:10.1093/eurheartj/ehs123.
4. Zeldenrust SR, Cooper LT. Getting to the heart of the matter: cardiac involvement in transthyretin-relatedamyloidosis. Eur Heart J. 2012 Aug 26. [Epub ahead of print] doi:10.1093/eurheartj/ehs238
5. Seward JB, Casaclang-Verzosa G. Infiltrative cardiovascular diseases: cardiomyopathies that look alike. J Am Coll Cardiol. 2010;55:1769–1779.
6. Dubrey SW, Cha K, Anderson J, Chamarthi B, Reisinger J, Skinner M, Falk RH. The clinical features of immunoglobulin light-chain (AL) amyloidosis with heart involvement. QJM. 1998;91:141–57.
7. Murtagh B, Hammill SC, Gertz MA, Kyle RA, Tajik AJ, Grogan M. Electrocardiographic findings in primary systemic amyloidosis and biopsy-proven cardiac involvement. Am J Cardiol. 2005;95:535–7.
8. Carroll JD, Gaasch WH, McAdam KP. Amyloid cardiomyopathy: characterization by a distinctive voltage/mass relation. Am J Cardiol. 1982;49:9–13.
9. Rahman JE, Helou EF, Gelzer-Bell R, Thompson RE, Kuo C, Rodriguez ER, Hare JM, Baughman KL, Kasper EK. Noninvasive diagnosis of biopsy-proven cardiac amyloidosis. J Am Coll Cardiol. 2004;43:410–5.
10. Cheng Z, Kang L, Tian Z, Chen W, Guo W, Xu J, Chen T, Fang L, Zeng Y, Cheng K, Fang Q. Utility of combined indexes of electrocardiography and echocardiography in the diagnosis of biopsy proven primary cardiac amyloidosis. Ann Noninvasive Electrocardiol. 2011;16:25– 9.
18
12. Benson MD, Breall J, Cummings OW, Liepnieks JJ.Surawicz B, Knilans TK. Biochemical characterisation of amyloid by endomyocardial biopsy. Amyloid. 2009;16:9–14.
13. Gertz MA, Comenzo R, Falk RH, Fermand JP, Hazenberg BP, Hawkins PN, Merlini G, Moreau P, Ronco P, Sanchorawala V, Sezer O, Solomon A, Grateau G. Definition of organ involvement and treatment response in immunoglobulin light chain amyloidosis (AL): a consensus opinion from the 10th international symposium on amyloid and amyloidosis. Am J Hematol. 2005;79:319–328.
14. Lachmann HJ, Booth DR, Booth SE, Bybee A, Gilbertson JA, Gillmore JD, Pepys MB, Hawkins PN. Misdiagnosis of hereditary amyloidosis as AL (primary) amyloidosis. N Engl J Med. 2002;6;346:1786–91.
15. Ferlini A, Fini S, Salvi F, Patrosso MC, Vezzoni P, Forabosco A. Molecular strategies in genetic diagnosis of transthyretin-related hereditary amyloidosis. FASEB J. 1992;6:2864–66. 16. Westermark P, sletten K, Johansson B, Cornwell GG. Fibril in senile systemic amyloidosis is
derived from normal transthyretin. Proc Natl Acad Sci USA. 1990;87:843–845.
17. Palladini G, Perfetti V, Merlini G. Therapy and management of systemic AL (primary) amyloidosis. Swiss Med Wkly. 2006;136:715–720.
18. Ng B, Connors LH, Davidoff R, Skinner M, Falk RH. Senile systemic amyloidosis presenting with heart failure: a comparison with light chain-associated amyloidosis. Arch Intern Med. 2005;165:1425–9.
19. Gersh BJ, Maron BJ, Bonow RO, Dearani JA, Fifer MA, Link MS, Naidu SS, Nishimura RA, Ommen SR, Rakowski H, Seidman CE, Towbin JA, Udelson JE, Yancy CW; American College of Cardiology Foundation/American Heart Association Task Force on Practice Guidelines; American Association for Thoracic Surgery; American Society of
Echocardiography; American Society of Nuclear Cardiology; Heart Failure Society of America; Heart Rhythm Society; Society for Cardiovascular Angiography and Interventions; Society of Thoracic Surgeons. 2011 ACCF/AHA guideline for the diagnosis and treatment of hypertrophic cardiomyopathy: executive summary: a report of the American College of Cardiology Foundation/American Heart Association Task Force on Practice Guidelines. Circulation. 2011;124:2761-–96.
20. Williams LK, Frenneaux MP, Steeds RP. Echocardiography in hypertrophic cardiomyopathy diagnosis, prognosis, and role in management. Eur J Echocardiogr. 2009;10:iii9–14.
19
21. Rapezzi C, Quarta CC, Guidalotti PL, Longhi S, Pettinato C, Leone O, Ferlini A, Salvi F, Gallo P, Gagliardi C, Branzi A. Usefulness and limitations of 99mTc-3,3-diphosphono-1,2-propanodicarboxylic acid scintigraphy in the aetiological diagnosis of amyloidotic
cardiomyopathy. Eur J Nucl Med Mol Imaging. 2011;38:470–8.
22. Surawicz B, Knilans TK. Chou’s electrocardiography in clinical practice. Fifth edition 2001. 23. American College of Cardiology/American Heart Association Task Force on Practice
Guidelines (ACC/AHA/ASE Committee to Update the 1997 Guidelines for the Clinical Application of Echocardiography). Guidelines update for the clinical application of echocardiography. Circulation. 2003;108:1146–1162.
24. Lang RM, Bierig M, Devereux RB, Flachskampf FA, Foster E, Pellikka PA, Picard MH, Roman MJ, Seward J, Shanewise JS, Solomon SD, Spencer KT, Sutton MS, Stewart WJ; Chamber Quantification Writing Group; American Society of Echocardiography's Guidelines and Standards Committee; European Association of Echocardiography. Recommendations for chamber quantification: a report from the American Society of Echocardiography's Guidelines and Standards Committee and the Chamber Quantification Writing Group, developed in conjunction with the European Association of Echocardiography, a branch of the European Society of Cardiology. J Am Soc Echocardiogr. 2005;18:1440–1463.
25. Devereux RB, Alonso DR, Lutas EM, Gottlieb GJ, Campo E, Sachs I, Reichek N. Echocardiographic assessment of left ventricular hypertrophy: comparison to necropsy findings. Am J Cardiol. 1986;57:450–458.
26. Hoigné P, Attenhofer Jost CH, Duru F, Oechslin EN, Seifert B, Widmer U, Frischknecht B, Jenni R. Simple criteria for differentiation of Fabry disease from amyloid heart disease and other causes of left ventricular hypertrophy. Int J Cardiol. 2006;111:413–22.
27. Piper C, Butz T, Farr M, Faber L, Oldenburg O, Horstkotte D. How to diagnose cardiac amyloidosis early: impact of ECG, tissue Doppler echocardiography, and myocardial biopsy. Amyloid. 2010 Mar;17(1):1–9.
28. Namdar M, Steffel J, Jetzer S, Schmied C, Hürlimann D, Camici GG, Bayrak F, Ricciardi D, Rao JY, de Asmundis C, Chierchia GB, Sarkozy A, Lüscher TF, Jenni R, Duru F, Brugada P. Value of electrocardiogram in the differentiation of hypertensive heart disease, hypertrophic cardiomyopathy, aortic stenosis, amyloidosis, and Fabry disease. Am J Cardiol.
20
29. Eliot RS, Mcgee HJ, Blount S G. Cardiac Amyloidosis. Circulation. 1961, 23:613–622. 30. Buja LM, Khoi NB, Roberts WC. Clinically significant cardiac amyloidosis.
Clinicopathologic findings in 15 patients. Am J Cardiol. 1970;26:394–405.
31. Rapezzi C, Merlini G, Quarta CC, Riva L, Longhi S, Leone O, Salvi F, Ciliberti P, Pastorelli F, Biagini E, Coccolo F, Cooke RM, Bacchi-Reggiani L, Sangiorgi D, Ferlini A, Cavo M, Zamagni E, Fonte ML, Palladini G, Salinaro F, Musca F, Obici L, Branzi A, Perlini S. Systemic cardiac amyloidoses: disease profiles and clinical courses of the 3 main types. Circulation. 2009;120:1203–1212.
21
Figure legends
Figure 1. Histological findings from an endomyocardial biopsy of a heart infiltrated by amyloid:
in the left panel the amyloid deposits (in pale pink after staining with hematoxylin-eosin) appear as an amorphous/homogeneous substance that diffusely infiltrates the myocardium, leading to an anatomical and functional isolation of single cells or groups of myocytes. The typical “apple-green” birefringence (in the right panel) can be appreciated after Congo-red staining under a polarized light microscope.
Figure 2. Characteristic echocardiographic (a) and electrocardiographic (b) findings from a
patient with amyloidotic cardiomyopathy (AC) owing to hereditary transthyretin amyloidosis. Echocardiographically, a diffuse thickening is apparent in the interventricular septum, posterior left ventricular wall, anterior right ventricular wall and interatrial septum, associated with a sparkle appearance of the ventricular myocardium. In the apical view (bottom left) mitral valve leaflet leaflets look thickened as well. The small, coexisting pericardial effusion is typical. The typical electrocardiographic pattern include low QRS voltages, ‘pseudo-infarction’ pattern, and diffuse T-wave abnormalities that might resemble ischemia.
Figure 3. ROC curves of the ECG/echocardiographic derived indexes for the diagnosis of
amyloidotic cardiomyopathy vs. other causes of left ventricular (LV) hypertrophy (hypertrophic cardiomyopathy and hypertensive heart disease), in the main analysis including 460 consecutive patients. The area under the curve (AUC) for each index is reported for each index. Among males (3a), the AUC of total QRS score divided by LV wall thickness indexed to height^2.7 (Total QRS/(LVWT/h2.7)) was significantly higher than that of Sokolow index divided by the CSA of LV wall (Carrol index in the figure, p=0.006) but not higher than that of the peripheral QRS score divided by LVMI (Peripheral QRS/LVMI in the figure, p=0.25). Among females (3b), the AUC of peripheral QRS score divided by LV wall thickness indexed to height^2.7 (peripheral QRS/(LVWT/h2.7)) and total QRS score divided by LV wall thickness indexed to height^2.7 (Total QRS/(LVWT/h2.7)) were the highest, but not significantly higher than that of peripheral QRS score divided by LVMI (Peripheral QRS/LVMI in the figure, p=0.42 and 0.63, respectively) or of the Sokolow index divided by the CSA of LV wall (Carrol index in the figure, p=0.17 and 0.14, respectively).
22
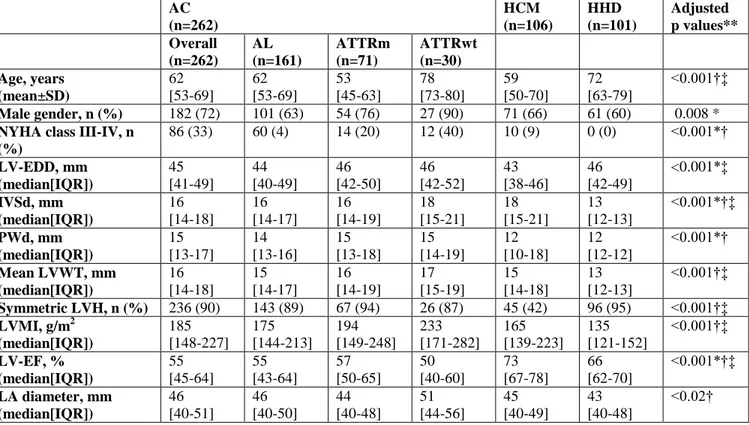
Table 1. Main clinical and echocardiographic characteristics of the different subgroups of
patients. AC (n=262) HCM (n=106) HHD (n=101) Adjusted p values** Overall (n=262) AL (n=161) ATTRm (n=71) ATTRwt (n=30) Age, years (mean±SD) 62 [53-69] 62 [53-69] 53 [45-63] 78 [73-80] 59 [50-70] 72 [63-79] <0.001†‡ Male gender, n (%) 182 (72) 101 (63) 54 (76) 27 (90) 71 (66) 61 (60) 0.008 *
NYHA class III-IV, n (%) 86 (33) 60 (4) 14 (20) 12 (40) 10 (9) 0 (0) <0.001*† LV-EDD, mm (median[IQR]) 45 [41-49] 44 [40-49] 46 [42-50] 46 [42-52] 43 [38-46] 46 [42-49] <0.001*‡ IVSd, mm (median[IQR]) 16 [14-18] 16 [14-17] 16 [14-19] 18 [15-21] 18 [15-21] 13 [12-13] <0.001*†‡ PWd, mm (median[IQR]) 15 [13-17] 14 [13-16] 15 [13-18] 15 [14-19] 12 [10-18] 12 [12-12] <0.001*† Mean LVWT, mm (median[IQR]) 16 [14-18] 15 [14-17] 16 [14-19] 17 [15-19] 15 [14-18] 13 [12-13] <0.001†‡ Symmetric LVH, n (%) 236 (90) 143 (89) 67 (94) 26 (87) 45 (42) 96 (95) <0.001†‡ LVMI, g/m2 (median[IQR]) 185 [148-227] 175 [144-213] 194 [149-248] 233 [171-282] 165 [139-223] 135 [121-152] <0.001†‡ LV-EF, % (median[IQR]) 55 [45-64] 55 [43-64] 57 [50-65] 50 [40-60] 73 [67-78] 66 [62-70] <0.001*†‡ LA diameter, mm (median[IQR]) 46 [40-51] 46 [40-50] 44 [40-48] 51 [44-56] 45 [40-49] 43 [40-48] <0.02†
**p values were adjusted according to Bonferroni method and refer to the comparison between AC (overall population), HCM and HHD.
p <0.05 at post-hoc analysis: *AC vs HCM; † AC vs HHD; ‡ HCM vs HHD.
AC=amyloidotic cardiomyopathy; AL=light-chains-related amyloidosis; ATTRm=hereditary transthyretin-related amyloidosis; ATTRwt=wild-type transthyretin-related amyloidosis; HCM=hypertrophic cardiomyopathy; HHD=hypertensive heart disease; LV=left ventricular; IQR=interquartile range; LV-EDD=LV end diastolic diameter; IVSd=interventricular septum in diastole; PWd=LV posterior wall in diastole; LVWT=LV wall thickness; LVH=LV hypertrophy; LVMI=body surface area indexed LV mass; LV-EF=LV ejection fraction; LA=left atrium.
23
Table 2. ECG findings and combined ECG/echocardiographic indexes in the different subgroups
of patients. AC (n=262) HCM (n=106) HHD (n=101) P** Overall (n=262) AL (n=161) ATTRm (n=71) ATTRwt (n=30) Normal ECG, n (%) 14 (5) 6 (4) 7 (10) 1 (3) 5 (5) 42 (42) <0.001†‡ AF, n (%) 30 (11) 19 (12) 3 (4) 8 (27) 8 (8) 20 (20) 0,022 ‡ Low QRS voltage, n (%) 125 (48) 100 (62) 17 (24) 8 (27) 6 (6) 21 (21) <0.001*†‡ LVH (Sokolow index ≥ 35 mm), n (%) 9 (3) 4 (2) 3 (4) 2 (7) 30 (30) 5 (5) <0.001*‡ Peripheral QRS score, mV (median [IQR]) 27 [19-38] 24 [17-33] 37 [28-49] 33 [23-36] 58 [42-80] 39 [30-49] <0.001*†‡ Total QRS score, mV (median [IQR]) 94 [74-124] 85 [68-104] 114 [90-136] 118 [94-152] 186 [147-228] 116 [101-134] <0.001*†‡ LBBB, n (%) 21 (8) 6 (4) 6 (8) 9 (30) 7(7) 4 (4) 0.388 I degree AV block, n (%) 61/253 (24) 34/152 (22) 19 (27) 8 (27) 8 (8) 7 (7) <0.001*† Pseudoinfarct pattern, % 147 (56) 86 (53) 39 (55) 20 (67) 40 (40) 5 (5) <0.001*†‡ “Ischemic abnormalities” (negative T waves), n (%) 134 (51) 83 (52) 35 (49) 16 (53) 81 (80) 23 (23) <0.001*†‡ Sokolow index/CSA of the LV wall (8), median [IQR] 0.9 [0.6−1.2] 0.8 [0.5−1.2] 1.1 [0.8−1.4] 1 [0.7−1.4] 1.7 [1.2−2.6] 1.4 [1.1−2] <0.001*†‡ Low QRS voltage+IVSd >1.98 cm;9 18 (7) 14 (9) 2 (3) 2 (7) 0 (0) 0 (0) n.a. Sokolow index/LVMI, median [IQR] 0.08 [0.05−0.1] 0.09 [0.06−0.1] 0.09 [0.06−0.1] 0.08 [0.05−0.1] 0.15 [0.1−0.2] 0.13 [0.1−0.2] <0.001*† Sokolow index/LVWT, median [IQR] 0.97 [0.6-1.3] 0.8 [0.6-1.2] 1.15 [0.8-1.6] 1.15 [0.8-1.5] 1.78 [1.2-2.7] 1.5 [1.04-2.1] <0.001*†‡ Sokolow index/LVWT/h2.7, median [IQR] 3.94 [2.4-5.5] 3.3 [2.3-4.8] 4.45 [3.2-6.6] 5.25 [3.1-6.0] 7.73 [4.8-10.9] 5.56 [4.3-8.1] <0.001*†‡ Peripheral QRS score/LVMI, median [IQR] 0.14 [0.1−0.2] 0.13 [0.09−0.18] 0.19 [0.12−0.2] 0.13 [0.1−0.2] 0.32 [0.2−0.5] 0.28 [0.2−0.4] <0.001*†‡ Peripheral QRS score/LVWT, median [IQR] 1.77 [1.2-2.5] 1.6 [1.1-2.2] 2.32 [1.5-3.1] 1.81 [1.3-2.4] 3.82 [2.6-5.9] 3.17 [2.3-4.1] <0.001*†‡ Peripheral QRS score/ LVWT/h2.7, median [IQR] 7.33 [4.8-10.3] 6.28 [4.2-8.7] 9.28 [6.9-12.8] 7.5 [6.5-10.4] 15.53 [11.3-22.3] 12.38 [9.4-16.1] <0.001*†‡ Total QRS score/LVMI, median [IQR] 0.5 [0.4−0.7] 0.5 [0.4−0.6] 0.6 [0.4−0.8] 0.5 [0.4−0.6] 1.0 [0.8−1.4] 0.8 [0.7−1] <0.001*†‡ Total QRS score/LVWT, median 6.2 [4.6-7.9] 5.7 [4.3-7.04] 7.08 [5.7-8.8] 7.11 [5.5-8.4] 12.1 [9.1-16.7] 9.21 [7.8-10.5] <0.001*†‡
24 [IQR] Total QRS score/LVWT/h2.7, median [IQR] 25.6 [18.2-32.6] 22.44 [16.6-29.3] 29.26 [23.4-37.0] 28.57 [23.3-33.8] 49.75 [37.8-68-9] 37.12 [30.0-44.5] <0.001*†‡
**p values were adjusted according to Bonferroni method and refer to the comparison between AC (overall population), HCM and HHD.
p <0.05 at post-hoc analysis: *AC vs HCM; † AC vs HHD; ‡ HCM vs HHD.
AC=amyloidotic cardiomyopathy; AL=light-chains-related amyloidosis; ATTRm=hereditary transthyretin-related amyloidosis; ATTRwt=wild-type transthyretin-related amyloidosis;
HCM=hypertrophic cardiomyopathy; HHD=hypertensive heart disease; IQR=interquartile range; AF=atrial fibrillation; LV=left ventricular; LVH=left ventricular hypertrophy; LBBB=left bundle branch block; AV=atrioventricular; CSA=cross sectional area; LVMI=body surface area indexed LV mass; n.a.=not applicable; IVSd=interventricual septum during diastole; LVWT=left
25
Table 3a. Diagnostic performance of the different indices for the identification of AC in the
overall population and in selected clinical scenarios among males (n=314).
AC vs. other (HCM+HHD) AC vs. HCM AL vs. other (HCM+HHD) AL vs. HCM TTR vs. other (HCM+HHD) TTR vs. HCM
Low QRS voltage on ECG
- Sensitivity - Specificity - LR+ - LR- 45.1% 88.6% 3.96 0.6 45.1% 95.8% 10.7 0.6 60.4% 88.6% 5.3 0.4 60.4% 95.8% 14.3 0.4 25.9% 88.6% 2.3 0.8 25.9% 95.8% 6.1 0.8 Symmetric LVH on ECHO - Sensitivity - Specificity - LR+ - LR- 89.6% 33.3% 1.3 0.3 89.6% 56.3% 2.1 0.2 89.1% 33.3% 1.3 0.3 89.1% 56.3% 2.04 0.2 90.1% 33.3% 1.4 0.3 90.1% 56.3% 2.1 0.2
Sokolow index/CSA of LV wall (8) (cut off ≤ 1.2479) - Sensitivity - Specificity - LR+ - LR- 73.63% 72.73% 2.7 0.4 73.63% 74.65% 2.9 0.3 79.21% 72.73% 2.9 0.3 79.21% 74.65% 3.1 0.3 66.67% 72.73% 2.4 0.5 66.67% 74.65% 2.6 0.4
Low QRS voltage + IVSd >1.98 cm
- Sensitivity - Specificity - LR+ - LR- 45.1% 88.6% 3.9 0.6 45.1% 95.8% 10.7 0.6 60.4% 88.6% 5.3 0.4 60.4% 95.8% 14.3 0.4 25.9% 88.6% 2.3 0.8 25.9% 95.8% 6.1 0.8 Sokolow index/LVMI (cut off ≤ 0.1118881) - Sensitivity - Specificity - LR+ - LR- 75.27% 70.45% 2.6 0.4 75.27% 69.01% 2.2 0.5 81.19% 70.45% 2.7 0.3 81.19% 69.01% 2.6 0.3 67.90% 70.45% 2.3 0.5 67.90% 69.01% 2.2 0.5 Sokolow index/LVWT (cut off ≤ 1.230769) - Sensitivity - Specificity - LR+ - LR- 69.78% 71.97% 2.5 0.4 69.23% 74.65% 2.7 0.4 77.23% 71.97% 2.8 0.3 76.24% 74.65% 3.0 0.3 60.49% 71.97% 2.2 0.5 60.49% 76.06% 2.5 0.5 Sokolow index/(LVWT/h2.7) (cut off ≤ 5.49101) - Sensitivity - Specificity - LR+ - LR- 69.8% 71.2% 2.4 0.4 69.8% 77.5% 2.6 0.3 78.2% 71.2% 3.3 0.4 78.2% 77.5% 3.6 0.3 59.3% 71.2% 1.8 0.5 59.3% 77.5% 1.9 0.7 Peripheral QRS score/LVMI (cut off ≤ 0.205725) - Sensitivity - Specificity - LR+ - LR- 76.37% 78.03% 3.5 0.3 75.82% 80.28% 3.8 0.3 81.19% 78.03% 3.7 0.2 81.19% 81.69% 4.4 0.2 70.37% 78.03% 3.2 0.4 69.14% 80.28% 4.5 0.3 Peripheral QRS score/LVWT (cut off ≤ 2.37037) - Sensitivity - Specificity - LR+ - LR- 74.73% 75.00% 2.9 0.3 74.18% 77.46% 3.3 0.3 85.15% 81.06% 4.5 0.2 85.15% 77.46% 4.1 0.3 62.96% 75.00% 2.5 0.5 61.73% 77.46% 2.7 0.5 Peripheral QRS score/(LVWT/h2.7) (cut off ≤ 10.51418)
26 - Sensitivity - Specificity - LR+ - LR- 74.2% 76.5% 2.9 0.3 74.2% 78.9% 3.05 0.3 81.2% 76.5% 4.1 0.3 81.2% 78.9% 4.2 0.3 65.4% 76.5% 2.2 0.4 65.4% 78.9% 2.3 0.7 Total QRS score/LVMI (cut off ≤ 0.7174721) - Sensitivity - Specificity - LR+ - LR- 80.22% 81.06% 4.2 0.2 80.22% 83.10% 4.7 0.2 85.15% 81.06% 4.5 0.2 85.15% 83.10% 5.0 0.2 74.07% 81.06% 3.9 0.3 74.07% 83.10% 4.4 0.3 Total QRS score/LVWT (cut off ≤ 8.357142) - Sensitivity - Specificity - LR+ - LR- 78.57% 78.03% 3.6 0.3 78.57% 81.69% 4.3 0.3 84.16% 78.03% 3.8 0.2 84.16% 83.10% 4.9 0.2 71.60% 78.03% 3.3 0.4 71.60% 83.10% 4.2 0.3 Total QRS score/(LVWT/h2.7) (cut off ≤36.40046) - Sensitivity - Specificity - LR+ - LR- 78.6% 81.1% 3.8 0.2 78.6% 88.7% 4.1 0.1 85.1% 81.1% 5.5 0.2 85.1% 88.7% 6 0.1 70.4% 81.1% 2.7 0.3 70.4% 88.7% 3 0.2
LR+ =positive likelihood ratio; LR- =negative likelihood ratio; AC=amyloidotic
cardiomyopathy; HCM=hypertrophic cardiomyopathy; HHD=hypertensive heart disease; AL=light chain-related amyloidosis; CSA=cross sectional area; ED-IVS=end diastolic
interventricular septum; LV=left ventricular; LVH=LV hypertrophy; LVMI=body surface area indexed LV mass; LVWT=LV wall thickness; h=height.
27
Table 3b. Diagnostic performance of the different indices for the identification of AC in the
overall population and in selected clinical scenarios among females (n=155).
AC vs. other (HCM+HHD) AC vs. HCM AL vs. other (HCM+HHD) AL vs. HCM TTR vs. other (HCM+HHD) TTR vs. HCM Low QRS voltage on ECG
- Sensitivity - Specificity - LR+ - LR- 53.8% 85.3% 3.7 0.5 53.8% 91.4% 6.3 0.5 65% 85.3% 4.4 0.4 65% 91.4% 7.6 0.4 20% 85.3% 1.4 0.9 20% 91.4% 2.3 0.9 Symmetric LVH - Sensitivity - Specificity - LR+ - LR- 91.3% 29.3% 1.3 0.3 91.3% 60% 2.3 0.15 88.3% 29.3% 1.3 0.4 88.3% 60% 2.2 0.2 100% 29.3% 1.4 0 100% 60% 2.5 0
Sokolow index/CSA of LV wall (8) (cut off ≤ 1.1753) - Sensitivity - Specificity - LR+ - LR- 68.75% 69.33% 2.3 0.5 67.50% 71.43% 2.4 0.5 75.00% 69.33% 2.4 0.4 73.33% 71.43% 2.6 0.4 50.00% 69.33% 1.6 0.7 45.00% 71.43% 1.6 0.8
Low QRS voltage + IVSd >1.98 cm
- Sensitivity - Specificity - LR+ - LR- 53.8% 85.3% 3.7 0.5 53.8% 91.4% 6.3 0.5 65% 85.3% 4.4 0.4 65% 91.4% 7.6 0.4 20% 85.3% 1.4 0.9 20% 91.4% 2.3 0.9 Sokolow index/LVMI (cut off ≤ 0.1055705) - Sensitivity - Specificity - LR+ - LR- 68.75% 68.00% 2.1 0.5 67.50% 71.43% 2.2 0.4 78.33% 68.00% 2.5 0.3 76.67% 71.43% 2.7 0.3 40.00% 68.00% 1.3 0.9 40.00% 74.29% 1.6 0.8 Sokolow index/LVWT (cut off ≤ 1.230769) - Sensitivity - Specificity - LR+ - LR- 65.00% 64.00% 1.8 0.5 65.00% 71.43% 2.7 0.4 73.33% 64.00% 2.0 0.4 73.33% 71.43% 2.6 0.4 40.00% 64.00% 1.1 0.9 35.00% 71.43% 1.2 0.9 Sokolow index/(LVWT/h2.7) (cut off ≤ 4.300502) - Sensitivity - Specificity - LR+ - LR- 67.5% 68% 2.1 0.5 67.5% 71.4% 2.2 0.4 78.3% 68% 3.1 0.4 78.3% 71.4% 3.3 0.4 35% 68% 1.1 0.9 35% 71.4% 1.1 0.8 Peripheral QRS score/LVMI (cut off ≤ 0.2345679) - Sensitivity - Specificity - LR+ - LR- 73.75% 73.33% 2.8 0.4 73.75% 80.00% 3.7 0.3 83.33% 73.33% 3.1 0.2 83.33% 80.00% 4.2 0.2 45.00% 73.33% 1.7 0.8 45.00% 80.00% 2.3 0.7
Peripheral QRS score/LVWT (cut off ≤ 2.56) - Sensitivity - Specificity - LR+ - LR- 72.50% 72.00% 2.6 0.4 72.50% 77.14% 3.2 0.4 80.00% 72.00% 3.6 0.4 81.67% 77.14% 3.6 0.2 45.00% 72.00% 1.6 0.8 45.00% 80.00% 2.3 0.7 Peripheral QRS score/(LVWT/h2.7) (cut off ≤ 9.01952) - Sensitivity 76.3% 76.3% 86.7% 86.7% 45% 45%
28 - Specificity - LR+ - LR- 76% 3.2 0.3 82.9% 3.5 0.2 76 % 5.7 0.3 82.9% 6.2 0.2 76% 1.4 0.5 82.9% 1.5 0.4 Total QRS score/LVMI (cut off ≤ 0.6950323) - Sensitivity - Specificity - LR+ - LR- 76.25% 72.00% 2.7 0.3 75.00% 80.00% 3.8 0.3 81.67% 72.00% 2.9 0.3 80.00% 80.00% 4.0 0.3 60.00% 72.00% 2.1 0.6 55.00% 80.00% 2.8 0.6 Total QRS score/LVWT (cut off ≤ 7.769231) - Sensitivity - Specificity - LR+ - LR- 78.75% 78.77% 3.7 0.3 77.50% 88.57% 6.8 0.3 85.00% 78.77% 4.0 0.2 83.33% 88.57% 7.3 0.2 60.00% 78.67% 2.8 0.5 50.00% 88.57% 4.4 0.6 Total QRS score/(LVWT/h2.7) (cut off ≤ 27.32028) - Sensitivity - Specificity - LR+ - LR- 76.3% 74.7% 3.1 0.3 76.3% 85.7% 3.6 0.2 85% 74.7% 5 0.3 85% 85.7% 5.7 0.2 50% 74.7% 1.5 0.5 50% 85.7% 1.7 0.3
LR+ =positive likelihood ratio; LR- =negative likelihood ratio; AC=amyloidotic
cardiomyopathy; HCM=hypertrophic cardiomyopathy; HHD=hypertensive heart disease; AL=light chain-related amyloidosis; CSA=cross sectional area; ED-IVS=end diastolic
interventricular septum; LV=left ventricular; LVH=LV hypertrophy; LVMI=body surface area indexed LV mass; LVWT=LV wall thickness; h=height.
29
Table 4a. Diagnostic performance of the different indices for the identification of AC in a
population of 200 consecutive male patients with increased LV wall thickness due to either AC, HCM or HHD. AC vs. other (HCM+HHD) AC vs. HCM AL vs. other (HCM+HHD) AL vs. HCM TTR vs. other (HCM+HHD) TTR vs. HCM Sokolow index/CSA of LV wall
(8) (cut off ≤ 1.2479) - Sensitivity - Specificity - LR+ - LR- 65.12% 92.36% 8.5 0.4 65.12% 80.43% 3.3 0.4 61.90% 92.36% 8.1 0.4 61.90% 80.43% 3.9 0.5 68.18% 92.99% 9.7 0.3 68.18% 82.61% 3.9 0.4 Peripheral QRS score/LVMI (cut off ≤0.205725) - Sensitivity - Specificity - LR+ - LR- 72.09% 82.80% 4.2 0.3 72.09% 71.74% 2.6 0.4 66.67% 82.80% 3.9 0.4 66.67% 71.74% 2.4 0.5 77.27% 82.80% 4.5 0.3 77.27% 71.74% 2.7 0.3 Peripheral QRS score/LVWT (cut off ≤ 2.37037) - Sensitivity - Specificity - LR+ - LR- 69.77% 90.45% 7.3 0.3 69.77% 69.57% 2.3 0.4 57.14% 90.45% 5.9 0.5 57.14% 69.57% 1.9 0.6 81.82% 90.45% 8.6 0.2 81.82% 69.57% 2.7 0.3 Total QRS score/LVMI (cut off ≤ 0.7174721) - Sensitivity - Specificity - LR+ - LR- 69.77% 67.52% 2.1 0.5 67.44% 78.26% 3.1 0.4 61.90% 67.52% 1.9 0.6 57.14% 78.26% 2.6 0.5 77.27% 67.52% 2.4 0.3 77.27% 80.43% 3.9 0.3 Total QRS score/LVWT (cut off ≤ 8.357142) - Sensitivity - Specificity - LR+ - LR- 69.77% 80.89% 3.7 0.4 69.77% 76.09% 2.9 0.4 71.43% 80.89% 3.7 0.4 71.43% 76.09% 3.7 0.4 68.18% 80.89% 3.6 0.4 68.18% 76.09% 2.8 0.4 Total QRS score/(LVWT/h2.7) (cut off ≤36.40046) - Sensitivity - Specificity - LR+ - LR- 74.4% 80.9% 3.2 0.3 74.4% 78.3% 3.1 0.3 71.4% 80.9% 2.8 0.3 71.4% 78.3% 2.7 0.3 77.3% 80.9% 3.6 0.2 77.3% 78.3% 3.4 0.3
LR+ =positive likelihood ratio; LR- =negative likelihood ratio; AC=amyloidotic
cardiomyopathy; HCM=hypertrophic cardiomyopathy; HHD=hypertensive heart disease; AL=light chain-related amyloidosis; CSA=cross sectional area; ED-IVS=end diastolic interventricular septum; LV=left ventricular; LVMI=body surface area indexed LV mass; LVWT=LV wall thickness; h=height.
30
Table 4b. Diagnostic performance of the different indices for the identification of AC in a
population of 98 consecutive female patients with increased LV wall thickness due to either AC, HCM or HHD. AC vs. other (HCM+HHD) AC vs. HCM AL vs. other (HCM+HHD) AL vs. HCM TTR vs. other (HCM+HHD) TTR vs. HCM Sokolow index/CSA of LV wall (8)
(cut off ≤ 1.1753) - Sensitivity - Specificity - LR+ - LR- 68.42% 92.41% 9 0.3 68.42% 71.43% 2.4 0.4 88.89% 93.67% 14 0.2 88.89% 76.19% 3.7 0.1 60.00% 91.14% 6.8 0.4 50.00% 71.43% 1.8 0.7 Peripheral QRS score/LVMI (cut off ≤ 0.2345679) - Sensitivity - Specificity - LR+ - LR- 63.16% 79.75% 3.1 0.5 63.16% 90.48% 6.6 0.4 77.78% 79.75% 3.8 0.3 77.78% 90.48% 8.2 0.9 50.00% 79.75% 2.5 0.6 50.00% 90.48% 5.3 0.6 Peripheral QRS score/LVWT (cut off ≤ 2.56) - Sensitivity - Specificity - LR+ - LR- 68.42% 94.94% 13.5 0.3 63.16% 90.48% 6.6 0.4 88.89% 94.94% 17.6 0.1 77.78% 95.24% 16.3 0.2 50.00% 94.94% 9.9 0.5 50.00% 95.24% 10.5 0.5 Peripheral QRS score/(LVWT/h2.7) (cut off ≤ 9.01952) - Sensitivity - Specificity - LR+ - LR- 68.4% 96.2% 3.1 0.06 68.4% 85.7% 2.7 0.2 88.9% 96.2% 8.7 0.04 88.89% 85.7% 7.7 0.2 50% 96.2% 1.9 0.8 50% 85.7% 1.7 0.3 Total QRS score/LVMI (cut off ≤ 0.6950323) - Sensitivity - Specificity - LR+ - LR- 63.16% 67.09% 1.9 0.5 63.16% 80.95% 3.3 0.5 77.78% 68.35% 2.5 0.3 66.67% 80.95% 3.5 0.8 50.00% 67.09% 1.5 0.7 50.00% 80.95% 2.6 0.6 Total QRS score/LVWT (cut off ≤ 7.769231) - Sensitivity - Specificity - LR+ - LR- 63.16% 84.81% 4.2 0.4 63.16% 85.71% 4.4 0.4 77.78% 84.81% 5.1 0.3 77.78% 85.71% 5.4 0.3 50.00% 84.81% 3.3 0.6 50.00% 85.71% 3.5 0.6 Total QRS score/(LVWT/h2.7) (cut off ≤27.32028) - Sensitivity - Specificity - LR+ - LR- 63.2% 89.9% 2.4 0.2 63.2% 81% 2.2 0.3 77.8% 89.9% 4.4 0.1 77.8% 81% 3.6 0.2 50% 89.9% 1.8 0.2 50% 81% 1.6 0.4
LR+ =positive likelihood ratio; LR- =negative likelihood ratio; AC=amyloidotic
cardiomyopathy; HCM=hypertrophic cardiomyopathy; HHD=hypertensive heart disease; AL=light chain-related amyloidosis; CSA=cross sectional area; ED-IVS=end diastolic interventricular septum; LV=left ventricular; LVMI=body surface area indexed LV mass; LVWT=LV wall thickness; h=height.
31
Table 5a. Diagnostic performance of the different indices for the identification of AC for the
entire population of male patients with different causes of increased LV wall thickness (n=514) in the different clinical settings.
AC vs other (HCM+HHD) LQV Symm. LVH Carrol index Rahman index Sokolow / LVMI Sokolow / LVWT Sokolow / (LVWT /h2.7) pQRS / LVMI pQRS / LVWT pQRS / (LVWT /h2.7) tQRS / LVMI tQRS / LVWT tQRS / (LVWT /h2.7) Sens 44% 91% 72% 8% 74% 68% 68% 76% 74% 73% 78% 77% 78% Spec 93% 27% 83% 100% 80% 84% 83% 80% 83% 82% 72% 79% 81% LR+ 6.6 1.3 3.0 . 3.0 2.7 2.6 3.3 3.2 3.1 3.4 3.4 3.6 LR- 0.6 0.3 0.2 0.9 0.3 0.2 0.3 0.3 0.2 0.2 0.3 0.3 0.2 AC vs HCM LQV Symm. LVH Carrol index Rahman index Sokolow / LVMI Sokolow / LVWT Sokolow / (LVWT /h2.7) pQRS / LVMI pQRS / LVWT pQRS / (LVWT /h2.7) tQRS / LVMI tQRS / LVWT tQRS / (LVWT /h2.7) Sens 44% 91% 72% 8% 74% 68% 68% 75% 74% 73% 78% 77% 78% Spec 96% 61% 76% 99% 74% 78% 79% 76% 73% 72% 81% 80% 85% LR+ 10.2 2.3 2.8 9.4 2.8 2.5 2.5 3.1 2.8 2.7 3.7 3.4 3.8 LR- 0.6 1.2 0.3 0.9 0.4 0.3 0.3 0.3 0.4 0.4 0.2 0.3 0.2 AL vs other (HCM+HHD) LQV Symm. LVH Carrol index Rahman index Sokolow / LVMI Sokolow / LVWT Sokolow / (LVWT /h2.7) pQRS / LVMI pQRS / LVWT pQRS / (LVWT /h2.7) tQRS / LVMI tQRS / LVWT tQRS / (LVWT /h2.7) Sens 57% 90% 77% 12% 79% 75% 75% 79% 80% 77% 815 82% 83% Spec 93% 27% 83% 100% 80% 84% 83% 80% 83% 82% 73% 79% 81% LR+ 8.6 1.2 3.6 . 3.7 3.3 3.3 3.8 4.1 3.6 3.9 4.4 4.7 LR- 0.5 0.4 0.2 0.9 0.3 0.2 0.2 0.3 0.2 0.2 0.3 0.3 0.2 AL vs HCM LQV Symm. LVH Carrol index Rahman index Sokolow / LVMI Sokolow / LVWT Sokolow / (LVWT /h2.7) pQRS / LVMI pQRS / LVWT pQRS / (LVWT /h2.7) tQRS / LVMI tQRS / LVWT tQRS / (LVWT /h2.7) Sens 57% 90% 77% 12% 79% 75% 75% 79% 80% 77% 81% 82% 83% Spec 96% 61% 76% 99% 74% 78% 79% 77% 73% 72% 81% 80% 85% LR+ 13.2 2.3 3.3 13.4 3.5 3.1 3.1 3.6 3.6 3.1 4.3 4.4 4.9 LR- 0.5 0.2 0.3 0.9 0.3 0.3 0.3 0.3 0.3 0.4 0.2 0.3 0.2 TTR vs other (HCM+HHD) LQV Symm. LVH Carrol index Rahman index Sokolow / LVMI Sokolow / LVWT Sokolow / (LVWT /h2.7) pQRS / LVMI pQRS / LVWT pQRS / (LVWT /h2.7) tQRS / LVMI tQRS / LVWT tQRS / (LVWT /h2.7) Sens 28% 91% 67% 4% 68% 61% 60% 72% 67% 69% 75% 71% 72% Spec 93% 27% 83% 100% 80% 84% 83% 80% 83% 78% 73% 79% 81% LR+ 4.3 1.3 2.5 . 2.5 2.2 2.1 2.9 2.5 2.7 2.9 2.7 2.9 LR- 0.8 0.3 0.3 1 0.3 0.3 0.3 0.3 0.3 0.3 0.4 0.3 0.3 TTR vs HCM LQV Symm. LVH Carrol index Rahman index Sokolow / LVMI Sokolow / LVWT Sokolow / (LVWT /h2.7) pQRS / LVMI pQRS / LVWT pQRS / (LVWT /h2.7) tQRS / LVMI tQRS / LVWT tQRS / (LVWT /h2.7) Sens 28% 91% 67% 4% 68% 61% 60% 71% 67% 69% 75% 71% 72% Spec 96% 61% 76% 99% 74% 78% 79% 76 73% 72% 81% 80% 85% LR+ 6.6 2.3 2.3 4.5 2.3 2 2 2.6 2.2 1.7 3.2 2.7 3.0 LR- 0.8 0.1 0.4 1 0.4 0.4 0.4 0.3 0.4 0.3 0.3 0.3 0.2
32
LQV=low QRS voltage; Symm. LVH=symmetric left ventricular hypertrophy; Sens.=sensitivity; Spec.=specificity; LR+ =positive likelihood ratio; LR- =negative likelihood ratio;
AC=amyloidotic cardiomyopathy; HCM=hypertrophic cardiomyopathy; HHD=hypertensive heart disease; AL=light chain-related amyloidosis; LVMI=body surface area indexed left ventricular mass; LVWT= left ventricular wall thickness, pQRS=peripheral QRS score; tQRS=total QRS score.
33
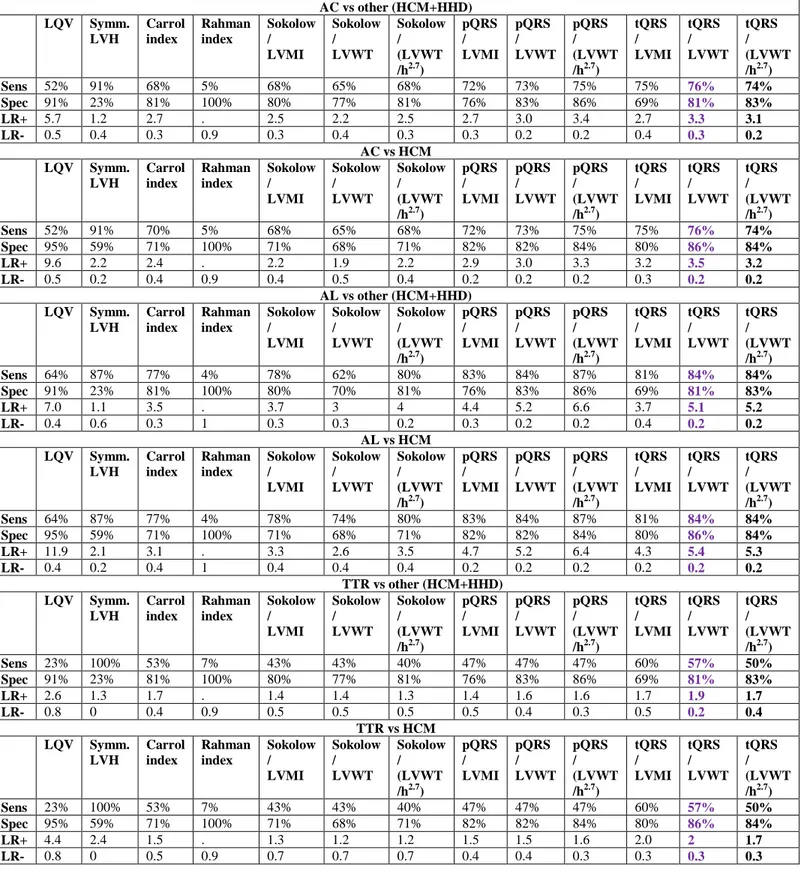
Table 5b. Diagnostic performance of the different indices for the identification of AC for the
entire population of female patients with different causes of increased LV wall thickness (n=253) in the different clinical settings.
AC vs other (HCM+HHD) LQV Symm. LVH Carrol index Rahman index Sokolow / LVMI Sokolow / LVWT Sokolow / (LVWT /h2.7) pQRS / LVMI pQRS / LVWT pQRS / (LVWT /h2.7) tQRS / LVMI tQRS / LVWT tQRS / (LVWT /h2.7) Sens 52% 91% 68% 5% 68% 65% 68% 72% 73% 75% 75% 76% 74% Spec 91% 23% 81% 100% 80% 77% 81% 76% 83% 86% 69% 81% 83% LR+ 5.7 1.2 2.7 . 2.5 2.2 2.5 2.7 3.0 3.4 2.7 3.3 3.1 LR- 0.5 0.4 0.3 0.9 0.3 0.4 0.3 0.3 0.2 0.2 0.4 0.3 0.2 AC vs HCM LQV Symm. LVH Carrol index Rahman index Sokolow / LVMI Sokolow / LVWT Sokolow / (LVWT /h2.7) pQRS / LVMI pQRS / LVWT pQRS / (LVWT /h2.7) tQRS / LVMI tQRS / LVWT tQRS / (LVWT /h2.7) Sens 52% 91% 70% 5% 68% 65% 68% 72% 73% 75% 75% 76% 74% Spec 95% 59% 71% 100% 71% 68% 71% 82% 82% 84% 80% 86% 84% LR+ 9.6 2.2 2.4 . 2.2 1.9 2.2 2.9 3.0 3.3 3.2 3.5 3.2 LR- 0.5 0.2 0.4 0.9 0.4 0.5 0.4 0.2 0.2 0.2 0.3 0.2 0.2 AL vs other (HCM+HHD) LQV Symm. LVH Carrol index Rahman index Sokolow / LVMI Sokolow / LVWT Sokolow / (LVWT /h2.7) pQRS / LVMI pQRS / LVWT pQRS / (LVWT /h2.7) tQRS / LVMI tQRS / LVWT tQRS / (LVWT /h2.7) Sens 64% 87% 77% 4% 78% 62% 80% 83% 84% 87% 81% 84% 84% Spec 91% 23% 81% 100% 80% 70% 81% 76% 83% 86% 69% 81% 83% LR+ 7.0 1.1 3.5 . 3.7 3 4 4.4 5.2 6.6 3.7 5.1 5.2 LR- 0.4 0.6 0.3 1 0.3 0.3 0.2 0.3 0.2 0.2 0.4 0.2 0.2 AL vs HCM LQV Symm. LVH Carrol index Rahman index Sokolow / LVMI Sokolow / LVWT Sokolow / (LVWT /h2.7) pQRS / LVMI pQRS / LVWT pQRS / (LVWT /h2.7) tQRS / LVMI tQRS / LVWT tQRS / (LVWT /h2.7) Sens 64% 87% 77% 4% 78% 74% 80% 83% 84% 87% 81% 84% 84% Spec 95% 59% 71% 100% 71% 68% 71% 82% 82% 84% 80% 86% 84% LR+ 11.9 2.1 3.1 . 3.3 2.6 3.5 4.7 5.2 6.4 4.3 5.4 5.3 LR- 0.4 0.2 0.4 1 0.4 0.4 0.4 0.2 0.2 0.2 0.2 0.2 0.2 TTR vs other (HCM+HHD) LQV Symm. LVH Carrol index Rahman index Sokolow / LVMI Sokolow / LVWT Sokolow / (LVWT /h2.7) pQRS / LVMI pQRS / LVWT pQRS / (LVWT /h2.7) tQRS / LVMI tQRS / LVWT tQRS / (LVWT /h2.7) Sens 23% 100% 53% 7% 43% 43% 40% 47% 47% 47% 60% 57% 50% Spec 91% 23% 81% 100% 80% 77% 81% 76% 83% 86% 69% 81% 83% LR+ 2.6 1.3 1.7 . 1.4 1.4 1.3 1.4 1.6 1.6 1.7 1.9 1.7 LR- 0.8 0 0.4 0.9 0.5 0.5 0.5 0.5 0.4 0.3 0.5 0.2 0.4 TTR vs HCM LQV Symm. LVH Carrol index Rahman index Sokolow / LVMI Sokolow / LVWT Sokolow / (LVWT /h2.7) pQRS / LVMI pQRS / LVWT pQRS / (LVWT /h2.7) tQRS / LVMI tQRS / LVWT tQRS / (LVWT /h2.7) Sens 23% 100% 53% 7% 43% 43% 40% 47% 47% 47% 60% 57% 50% Spec 95% 59% 71% 100% 71% 68% 71% 82% 82% 84% 80% 86% 84% LR+ 4.4 2.4 1.5 . 1.3 1.2 1.2 1.5 1.5 1.6 2.0 2 1.7 LR- 0.8 0 0.5 0.9 0.7 0.7 0.7 0.4 0.4 0.3 0.3 0.3 0.3
34
LQV=low QRS voltage; Symm. LVH=symmetric left ventricular hypertrophy; Sens.=sensitivity; Spec.=specificity; LR+ =positive likelihood ratio; LR- =negative likelihood ratio;
AC=amyloidotic cardiomyopathy; HCM=hypertrophic cardiomyopathy; HHD=hypertensive heart disease; AL=light chain-related amyloidosis; LVMI=body surface area indexed left ventricular mass; LVWT= left ventricular wall thickness, pQRS=peripheral QRS score; tQRS=total QRS score; h=height.