Institute for production technology and machine tools, Prof. Dr.-Ing. B. Denkena,
Institute of Production Engineering and Machine Tools
Prof. Dr.-Ing. B. Denkena
Master thesis
„Simulation-based evaluation of production technologies and factory
concepts for the optimization of rotor blade production“
Author: Angelo Dondarini Student ID: 414354
Supervisor:
M. Sc. Wirtsch.-Ing. Florian Winter
Abstract
Title: Simulation-based evaluation of production technologies
and factory concepts for the optimization of rotor blade production
Author: Angelo Dondarini
Student ID 414354
Release date: 11.04.2014
Supervisor: M. Sc. Florian Winter
Prof. Gino Dini
Within the project wind power roadmapping the combination of product, technology and factory planning through an integrated approach can lead to improvements in planning results and times due to synergies between these planning fields. The high costs due to the current manual labor intensive production can be replied by the in-troduction of new production technologies and lean factory concepts. In this work is developed and tested a novel methodology for evaluating innovative production technologies and factory concepts in wind turbine industry. The promising innova-tions, derived from a research in the state of art, are implemented in an event-driven simulation model of a rotor blade production site to analyse their effects within the process chain. The simulation results are used in a planning tool to compare the dif-ferent solutions by means of performance indicators as well as other criteria like ma-chine or labor costs in order to find the best solutions. Due to this evaluation roadmaps for production technologies and factory concepts to optimize the produc-tion of rotor blades are created as final result.
Contents
List of figures ... II
List of tables ... III
List of abbreviations ... IV
1 Introduction ... 1
1.1 Problem... 1
1.2 Objective ... 1
1.3 Approach... 1
2 State of the art ... 3
2.1 Product planning of wind turbines ... 3
2.1.1 Market drivers and product requirements ... 3
2.1.2 Product new trends ... 8
2.1.3 Methods and criteria to evaluate products ... 17
2.2 Technology planning for the production of rotor blades ... 20
2.2.1 Technology related to new products ... 20
2.2.2 Other technology trends ... 22
2.2.3 Methods and criteria to evaluate technologies ... 28
2.3 Factory planning for the production of rotor blades ... 36
2.3.1 Current factory situation ... 36
2.3.2 Alternative factory configuration ... 42
2.3.3 Methods and criteria to evaluate factory concepts ... 45
3 Evaluation of identified innovations ... 50
3.1 Evaluation of technologies ... 50
3.1.1 Summary of the presented technologies ... 50
3.1.2 Technology screening ... 51
3.1.3 Technology evaluation ... 55
3.1.4 Technology evaluation results and selection ... 71
3.2 Evaluation of factory concepts ... 73
3.2.3 Factory concept evaluation results and selection ... 94
4 Combined evaluation by simulation ... 97
4.1 Evaluating technologies ... 97
4.1.1 Automatic lay up system... 98
4.1.2 Reaction injection molding ... 99
4.1.3 Smart heating system ... 101
4.1.4 Technologies evaluation results ... 103
4.2 Evaluating technology roadmap ... 105
4.2.1 R.I.M. and smart heating system combined ... 105
4.2.2 R.I.M. and automated lay up system combined ... 106
4.2.3 R.I.M. smart heating system and automate lay up system combined ... 107
4.2.4 Combined technologies results ... 108
4.3 Combined simulation results ... 109
5 Critical appraisal... 113
5.1 General issues ... 113
5.2 Planning tool issues ... 113
5.3 Simulation issues ... 114
6 Summary and outlook ... 116
List of figures
FIGURE 1: WIND ENERGY GLOBAL GROWTH RATE [BERG11] ... 4
FIGURE 2: WIND ENERGY GROWTH RATE PER COUNTRY [BERG11] ... 5
FIGURE 3: EUR M/MW DECREASING RATE PER YEAR [BERG11] ... 5
FIGURE 4: LCOE OF MAIN ENERGY SOURCES [BERG11] ... 6
FIGURE 5: ROTOR BLADE BARRIERS FOR COST EFFECTIVE SCALING... 7
FIGURE 6: TRANSPORT AND €/MW COSTS AND BLADE LENGTH ... 8
FIGURE 7: WIND TURBINE DIAMETER AND POWER OUTPUT GROWTH FROM 1980 [BREN09] . 9 FIGURE 8: EXAMPLE OF ROTOR BLADE PROVIDED WITH ACTIVE FLAPS [USEN11] ... 10
FIGURE 9: LIFT CONTROL CAPABILITY OF A VARIETY OF AERODYNAMIC CONTROL SURFACE CONCEPTS [SHUB12] ... 11
FIGURE 10: DIFFERENT DEVICES FOR ACTIVE CONTROL [SHUB12] ... 12
FIGURE 11: EXAMPLE OF BLADES IN TWO SECTIONS [GAME12]... 13
FIGURE 12:DESCRIPTION OF A MODULAR BLADE JOINT CONCEPT [GAME12] ... 15
FIGURE 13:PHOTO OF A MODULAR BLADE JOINT [GAME12] ... 16
FIGURE 14:ROTOR BLADE INNER COMPOSITION [BAYE14] ... 17
FIGURE 15:DETAILS OF ACTUATORS AND WIRINGS INSIDE A SMART ROTOR BLADE [MAIN05] ... 21
FIGURE 16:A MODULAR BLADE DURING MOUNTING OPERATIONS [WIND11] ... 21
FIGURE 17: DIAGRAM OF A TYPICAL RIM PROCESS [DESI06] ... 22
FIGURE 18: EXAMPLE OF A ROTOR BLADE MOLD [WESU09] ... 23
FIGURE 19: MANUAL LAY-UP OPERATION IN AN OPEN MOLD PROCESS [TECN11] ... 24
FIGURE 20: VARMT PROCESS DIAGRAM [BROU03] ... 25
FIGURE 21: MAG AUTOMATED LAY UP SYSTEM [MAGI09] ... 27
FIGURE 22: AUTOMATED FINISHING SYSTEM [LIEB14] ... 28
FIGURE 23: BCG MATRIX ... 30
FIGURE 24: TECHNOLOGY PORTFOLIO ... 32
FIGURE 25: TCO STRUCTURE ... 33
FIGURE 26: TBO STRUCTURE ... 34
FIGURE 27: TCBO BASIC STRUCTURE ... 35
FIGURE 28: TCBO DIFFERENCE BETWEEN TOTAL BENEFIT AND COSTS IN DIFFERENT TECHNOLOGIES ... 35
FIGURE 31: GRINDING AND DRILLING OPERATIONS ON A ROTOR BLADE FLANGE [WINT13] . 38
FIGURE 32: MANUAL AEROFOIL GRINDING [GAME12] ... 38
FIGURE 33: ROBOTS VARNISHING A ROTOR BLADE [HAND10] ... 39
FIGURE 34: VACUUM LIFTER CRANE [AERO14] ... 39
FIGURE 35: EQUIPMENT SUMMARY ... 40
FIGURE 36:FACTORY ORGANIZATION ... 41
FIGURE 37: OPERATIONS PERFORMED DIVIDED BY DEPARTMENT FROM SIMULATION MODEL 41 FIGURE 38:WORKERS AMOUNT AND DIVISION ... 42
FIGURE 39:EQUIMENTS IMPROVEMENT OPPORTUNITY ... 43
FIGURE 40:MANUFACTURING STRATEGY IMPROVEMENT SUMMARY ... 44
FIGURE 41:WORKFORCE ORGANIZATION IMPROVEMENT SUMMARY ... 45
FIGURE 42: EXAMPLE OF A SANKEY DIAGRAM ... 46
FIGURE 43: GENERAL BREAKDOWN OF A PRODUCTION SHIFT ... 48
FIGURE 44: TECHNOLOGY SELECTION PROCESS ... 50
FIGURE 45: OPERATIONS INVOLVED IN AUTOMATED LAY UP ... 57
FIGURE 46: AUTOMATED LAY UP SYSTEM SIMULATION RESULTS ... 58
FIGURE 47: INVOLVED OPERATIONS IN AUTOMATED AEROFOIL WORKING ... 61
FIGURE 48: AUTOMATED AEROFOIL WORKING SYSTEM SIMULATION RESULTS ... 62
FIGURE 49: OPERATIONS INVOLVED IN SMART HEATING SYSTEM ... 64
FIGURE 50: SMART HEATING SYSTEM SIMULATION RESULTS ... 66
FIGURE 51: OPERATIONS INVOLVED IN R.I.M. ... 68
FIGURE 52: REACTION INJECTION MOLDING SIMULATION RESULTS ... 70
FIGURE 53: NEW TECHNOLOGIES TCBO COMPARISON ... 72
FIGURE 54: TECHNOLOGY ROADMAP ... 73
FIGURE 55: 3 SHIFTS SYSTEM GRAPHICAL REPRESENTATION ... 75
FIGURE 56: PARAMETERS TREND IN 3 SHIFTS SYSTEM ... 76
FIGURE 57:2 SHIFTS SYSTEM GRAPHICAL REPRESENTATION ... 77
FIGURE 58:WORKERS UTILIZATION CHARTS BY DEPARTMENT FROM SIMULATION MODEL .... 79
FIGURE 59:PARAMETERS TREND IN 2 SHIFTS SYSTEM ... 81
FIGURE 60: SELECTIVE 3 SHIFTS SYSTEM GRAPHICAL REPRESENTATION ... 82
FIGURE 61: FINISHING DEPARTMENT WORKERS UTILIZATION CHART IN 2 OR 3 SHIFTS CONFIGURATION ... 83
FIGURE 64: SIMULATION RESULTS TRENDS IN PREF+SHELL PRODUCTION CONFIGURATION . 90
FIGURE 65: SIMULATION RESULTS TRENDS IN 3 MERGED DEPARTMENTS CONFIGURATION .. 92
FIGURE 66: WORKERS ORGANIZATIONS BEST PERFORMANCE AND BEST SAVINGS RESULTS 94 FIGURE 67: POSSIBLE FACTORY ROADMAP ... 96
FIGURE 68: AUTOMATED LAY UP SIMULATION COMBINED RESULTS... 98
FIGURE 69:REACTION INJECTION MOLDING COMBINED SIMULATION RESULTS ... 100
FIGURE 70: SMART HEATING SYSTEM COMBINED SIMULATION RESULTS ... 102
FIGURE 71:TECHNOLOGIES PERFORMANCES COMPARISON ... 104
FIGURE 72:TCBO COMPARISON OF SELECTED TECHNOLOGIES COMBINED WITH NEW WORKERS ORGANIZATION ... 105
FIGURE 73:R.I.M.+S.H.S. COMBINED SIMULATION RESULTS ... 106
FIGURE 74: R.I.M. + AUTOMATED LAY UP COMBINED SIMULATION RESULTS ... 107
FIGURE 75: ALL TECHNOLOGIES COMBINED SIMULATION RESULTS ... 108
FIGURE 76: COMBINED TECHNOLOGIES SIMULATION RESULTS ... 109
FIGURE 77: PERFORMANCE INCREMENTS DUE TO TECHNOLOGY AND FACTORY INNOVATIONS ADDITIONS ... 110
FIGURE 78: PROFIT INCREASES DUE TO TECHNOLOGY AND FACTORY INNOVATIONS ... 111
List of tables
TABLE 1: CHOSEN CRITERIA ... 18
TABLE 2: EVALUATION CRITERIA ... 18
TABLE 3: CONCEPT SCORING ... 19
TABLE 4: SUMMARY OF CONSIDERED TECHNOLOGIES ... 51
TABLE 5: SUMMARY OF USED CRITERIA IN TECHNOLOGY SCREENING ... 52
TABLE 6: TECHNOLOGY SCREENING RESULTS ... 54
TABLE 7: SUMMARY OF THE TECHNOLOGIES POOL AFTER SCREENING ... 55
TABLE 8: AUTOMATED LAY UP CHANGES PER OPERATIONS INVOLVED ... 58
TABLE 9: AUTOMATED LAY UP: TCO AND TBO OVERVIEW FROM PLANNING TOOL ... 59
TABLE 10: AUTOMATED LAY UP: TCBO OVERVIEW ... 60
TABLE 11: AUTOMATED GRINDING CHANGES PER OPERATIONS INVOLVED ... 61
TABLE 12: AUTOMATED AEROFOIL WORKING: TCO AND TBO OVERVIEW FROM PLANNING TOOL ... 63
TABLE 13:AUTOMATED AEROFOIL WORKING:TCBO OVERVIEW FROM PLANNING TOOL ... 63
TABLE 14:SMART HEATING CHANGES PER OPERATIONS INVOLVED ... 65
TABLE 15:SMART HEATING SYSTEM:TCO AND TBO OVERVIEW FROM PLANNING TOOL ... 67
TABLE 16:SMART HEATING SYSTEM:TCBO OVERVIEW FROM PLANNING TOOL... 67
TABLE 17:R.I.M. CHANGES PER OPERATIONS INVOLVED ... 69
TABLE 18: R.I.M. TCO AND TBO OVERVIEW FROM PLANNING TOOL ... 70
TABLE 19: R.I.M. TCBO OVERVIEW FROM PLANNING TOOL ... 71
TABLE 20: TCBO IMPROVEMENTS COMPARISON ... 71
TABLE 21: COMPARISON BETWEEN BASE CONFIGURATION AND BEST CONFIGURATION ON 3 SHIFTS ... 76
TABLE 22: CURRENT WORKFORCE ON TWO SHIFTS SUMMARY OF RESULTS ... 78
TABLE 23: SUMMARY OF RESULTS TWO SHIFTS FIRST ATTEMPT OF OPTIMIZATION ... 80
TABLE 24: SUMMARY OF RESULTS OF TWO SHIFTS CONFIGURATIONS ... 81
TABLE 25: SIMULATION RESULTS OF SELECTIVE 3 SHIFTS CONFIGURATION WITH THE CURRENT AMOUNT OF WORKERS ... 84
TABLE 26: SUMMARY OF SIMULATION RESULTS OF SELECTIVE THREE SHIFTS CONFIGURATIONS ... 86
TABLE 27:SHIFTS EVALUATIONS RESULTS ... 87
TABLE 30: THREE MERGED DEPARTMENTS SIMULATION MAIN RESULTS ... 93 TABLE 31: SELECTIVE 3 SHIFT COMBINED WITH PREFABRICATION+SHELL PRODUCTION
SIMULATION BEST RESULTS ... 95 TABLE 32: AUTOMATED LAY UP SYSTEM TCO AND TBO OVERVIEW FROM PLANNING TOOL 99 TABLE 33: AUTOMATED LAY UP SYSTEM TCBO OVERVIEW FROM PLANNING TOOL ... 99 TABLE 34:R.I.M.TCO AND TBO COMBINED WITH WORKERS NEW ORGANIZATION FROM
PLANNING TOOL ... 101 TABLE 35:R.I.M.TCBO COMBINED WITH WORKERS NEW ORGANIZATION FROM PLANNING
TOOL ... 101 TABLE 36:S.H.S.TCO AND TBO COMBINED WITH WORKERS NEW ORGANIZATION FROM
PLANNING TOOL ... 103 TABLE 37: S.H.S. TCBO COMBINED WITH WORKERS NEW ORGANIZATION FROM PLANNING
1 Introduction
1.1 Problem
Within the project wind power roadmapping, regarding the planning of production ca-pacity through integrative roadmapping, a novel interdisciplinary approach is to de-velop. By combining the product, technology and factory planning through the inte-grated approach synergies can be reached to improve the planning results and times. The production of rotor blades for wind turbine as reference scenario of the project is currently dominated by manual labor and mostly organized as site fabrica-tion. The growing cost pressure can be replied by the introduction of new production technologies and lean factory concepts. However, the transfer of proven technologies and concepts from industries such as the aerospace industry fails due to different product requirements and objectives.
1.2 Objective
The Objective of this thesis is the development and testing of a methodology for evaluating innovative production technologies and factory concepts within the wind turbine industry. For this purpose, promising technologies and factory concepts will be implemented in a simulation model of a rotor blade production to analyse their effects (lead time, output quantity, etc.) within the process chain. These simulation results will be used in a planning tool to compare the different solutions by means of these performance indicators as well as other criteria like machine or labor costs. Due to this evaluation roadmaps for production technologies and factory concepts to optimize the production of rotor blades are created as final result.
1.3 Approach
To achieve this objective literature and references for innovative production technol-ogies and factory concepts (layouts, workforce, shift system, production organization, etc.) to optimize the rotor blade production have to be investigated first (chapter 2). Secondly methods and criteria in the planning tool will be used to select some of the possible solutions (chapter 3). To analyse the performance of the technologies and factory concepts within the process chain they are to implement in the simulation
model. For this reason, different combinations of machines, layouts, workforce, etc. are compared by using the simulation model (chapter 4). Finally the simulation re-sults are used for the further evaluation in the planning tool and to create the roadmaps for production technologies and factory concepts.
2 State of the art
In this chapter the state of art of the industry regarding the rotor blades production in wind energy is analysed. In the first part the wind energy market, its drivers and its future trends are taken in consideration in order to identify and evaluate the most promising emerging product innovations. Afterwards a similar study has been appli-cated to new emerging production technologies and innovative factory concepts. The results of this first analysis are used for select innovations to include in the planning tool. Moreover the selected technologies/factory concepts have been implemented in the simulation model in order to evaluate their actual performances.
2.1 Product planning of wind turbines
This subchapter introduces the basis of the work analysing the market demand and its requirements, then the most attractive new trends in rotor blades design, to face the current and future market challenge, are presented. In the end the new design trends are evaluated on the basis their actual capability to satisfy the market re-quirements.
2.1.1 Market drivers and product requirements
Wind power has established itself as a mainstream electricity generation source, and plays a central role in an increasing number of countries immediate and longer term energy plans. After 15 years of average cumulative growth rates of about 28%, the commercial wind power installations in about 80 countries at the end of 2011 totaled about 240 GW, having increased by more than 40 times over that same period. 22 countries have more than 1,000 MW installed.
Despite the current global economy turbulence that is almost freezing the demand growth for the next two years, by 2020 is expected a global growth rate of 6% (20% for offshore wind industry) fig.1 and fig.2. All the factors which have driven the growth of the wind industry over the past two decades are still there, and will get stronger over time.
Figure 1: Wind energy global growth rate [BERG11] It is possible to recognize these main drivers:
Increases in fossil fuels costs
Governments Policies
Job creation and local economic development
Reducing fresh water consumption and pollution
Reducing air pollution
Figure 2: Wind energy growth rate per country [BERG11]
Wind industry needs to raise its cost competitiveness to ensure sustainability. In oth-er words a substantial reduction of the Levelized Cost of Enoth-ergy (LCoE) measured in EUR ct./KWh by 25-40% is expected in the next 10 years in order to compete with the current main sources of electricity fig.3 and fig.4.
To manage this cost reduction is possible to focus on rotor blades. It is generally as-sumed that blades account for 15 to 20% of the total purchase price of wind turbines and by cutting the cost of this component, is possible to significantly cut the entire production cost of wind turbines.
Blades have very few fundamental barriers identified for the cost effective scaling of the current commercial blade designs and manufacturing methods over the size range of 80 to 120 m diameter fig 5.
Figure 5: Rotor blade barriers for cost effective scaling
The most substantial constraint are transportation costs which rise sharply for lengths above 45 m and become prohibitive for blades above 60 m. In terms of manufactur-ing, it is expected that environmental considerations will prohibit the use of processes with high emissions of volatile gasses, such as open mold wet layup that has been the wind industry norm till today, even if closed molds technology are becoming more and more common. Another manufacturing concern for large blade is bonding com-pounds. As blade sizes increase it is natural for the gaps between fitted and bonded parts to grow as well. However, the bonding materials used for smaller blades do not scale well to increasing gap sizes, and blade tooling and production costs for large blades increase rapidly as dimensional tolerances are decreased. Gravity loading is a design consideration but not an absolute constraint to scaling-up of the current conventional materials and blade designs over the size range considered. Nonethe-less, materials and designs that reduce blade weight may be of benefit for megawatt scale blades, as this would reduce the need for reinforcements in the regions of the trailing edge and blade root transition to accommodate the gravity induced edge wise fatigue loads.
2.1.2 Product new trends
The primary drivers in wind turbine development are power generation and cost. As-suming no changes in design, materials or construction methods, the amount of gen-erated power increases with blade length in proportion to the square of the turbine rotor’s diameter, but blade mass increases in proportion to the cube of its diameter. This means the rate of mass increase exceeds the rate of generated power increase as blades get longer. As a result, longer, exponentially heavier blades vastly increase transportation and installation difficulties and cascade mass and cost increases throughout the turbine/tower system.
Figure 6: Transport and €/MW costs and blade length
During the last two decades the general way to reduce LCoE has been simply in-creasing blades dimension without significant innovation in blade design or in materi-als fig 7. Now this process is near to its limit because is no more cost efficient mainly for three reasons:
Transport costs become prohibitive
Manufacturing operations require more time and spaces
Larger and heavier blades generate extremely high loads ad requires rein-forced hubs and towers
20 30 40 50 60 70 80 Co sts [€ ] Length [m] Power/transport cost Transport €/MW
In order to resolve these conflicts and continue to align Wind Energy LCoE to the most used energy source, researcher are working to find innovative solution in order to obtain rotor blades with the required resistance but lighter and easier to product and transport. Is possible to identify three new interesting trend in the rotor blade in-dustry:
Development of smart rotor blade
Research of new materials
Modular blades
2.1.2.1 Smart rotor blades
Figure 8: Example of rotor blade provided with active flaps [USEN11]
Smart Blades are blades which can modify their aerodynamic properties (angle of attack or lift coefficient) on the base of appropriate sensor inputs, depending on the current wind conditions (active control). The driver behind this research is to de-crease maximum loads and fatigue loads or to inde-crease dynamic energy capture. Fa-tigue loads are a key factor for the design of wind turbine blades. Reducing faFa-tigue loads can result in a significant reduction in cost, affecting required materials, maintenance costs and system reliability.
By definition, a smart structure involves distributed actuators and sensors and one or more microprocessors that analyze the responses from the sensors and use inte-grated control theory to command the actuators to apply localized strains displace-ments to alter system response. The target of this control for wind turbine applica-tions is the reduction of fluctuating loads on the blades in a more detailed way than modern blade pitch control.
Figure 9: Lift control capability of a variety of aerodynamic control surface concepts [SHUB12]
The technologies used for aerodynamic control surfaces includes:
Aileron Style Flaps
Camber Control
Active Twist
Boundary Layer Control
Fig.9 shows a comparison graph of aerodynamic performance (lift control capability) of a variety of aerodynamic control surface based concepts and fig.10 shows differ-ent concept for active surface control.
Figure 10: Different devices for active control [SHUB12]
Traditional actuators don’t meet the requirements for these application because pro-posed concepts of aerodynamic control surfaces (distributed along the blade span) require fast actuation without complex mechanical systems and large energy to weight ratios. Promising solution for this purpose is the use of smart material actuator systems. By definition, smart materials are materials which possess the capability to sense and actuate in a controlled way in response to variable ambient stimuli. Gen-erally known types of smart materials are:
Ferroelectric Materials o Piezoelectric o Electrostrictive o Magnetostrictive
Variable Rheology Materials o Electrorheological o Magnetorheological
Shape Memory Alloys
Piezoelectric materials and shape memory alloys are generally the most famous smart materials used in actuators in various applications.
The potential for load reduction by using smart control concepts for wind turbines has been proven with various approaches. Helicopter and aerospace experience also has shown promising results. On the other hand, the application of such advanced control concepts on wind turbines will have to face great challenges, in order to come from research stage to product stage. More research investigations will have to be made in order to identify design parameters for aerodynamic control devices with full wind turbine simulations and more advanced tools will have to be used. Current reliability and safety of wind turbine blades (and control) should not be compromised and tech-nology should not be too far off manufactures experience. This will probably be the main design driver for such systems. Further research projects are expected to inves-tigate the subject in the future. To sum up, the subject of smart rotor control for wind turbines is an innovative research area, preparing possible solutions for next genera-tion of large wind turbines.
2.1.2.2 Modular blades
Figure 11: Example of blades in two sections [GAME12]
Currently the most attractive research trend for decreasing transportation cost for large turbine blades is the concept of modular blades. By dividing blades in two parts
less space in manufacturing is needed and there are less problem in transportation especially in remote places. To transport a standard 100 m diameter rotor blade are required extremely expensive blade specific trucks and for even larger rotors, most ships, trucks and shipping terminals are unable to handle the blades at all. Instead a 100 m rotor modular blade can be shipped with two standard 27 m flatbed trucks and then assembled on site. The production of a modular blade cost 10% more than a standard one, but the increase is more than offset by transport savings.
Researchers indicated that a wide range of joint positions are possible without dis-turbing the blade’s modal shapes and natural frequencies, but the best way is to lo-cate the joint in almost the middle of the blade in order to minimize the length for transport. When the blade is in operation, it has to look and act as a one-piece blade, with a continuous bend and no flat spot, in order to avoid disrupting the aerodynam-ics and loading.
There are several ways to realize the joint, developed by different company or re-search institutes. As example has been analyzed Gamesa’s system who has launched on the market the first segmented composited blade (INNOBLADE™). INNOBLADE™ utilize channel fittings bond to a pultruded carbon fiber reinforced profile embedded within the spar cap laminates, which widened at the joint to ac-commodate multiple fittings. A simple bolted joint between each set of two fittings connected the two blade segments. There are 15 connections in the upper section of the joint and the same number in the lower section thus, if any inserts fail, the rest must work.
Figure 12: Description of a modular blade joint concept [GAME12]
The inserts are metallic and are bonded into the blade laminate in such a way that they form a double lap-shear joint, long considered by the aerospace industry to be one of the strongest options for adhesively bonded joints in composite structures. The bonded metallic inserts enable the two segments to be bolted together, with all of the loads in the blade transferred through the joint. The metal bolts are equipped with preload sensors that ensure an accuracy within 1 %. The maximum blade as-sembly time is 4 hours. After the bolts are secured, a metallic external fairing covers and protects the joint’s metal components and provides a smooth transition across the joint.
Figure 13: Photo of a modular blade joint [GAME12] 2.1.2.3 New materials
Currently rotor blades are made of dozens of layers of glass or carbon fiber compo-site mats and balsa in the core, which are placed individually in a female mold, bond-ed with an epoxy resin and curbond-ed. Materials that rbond-educe blade weight may be of ben-efit for megawatt-scale blades, as this would reduce fatigue loads.
In several recent studies, the use of carbon fiber in the load bearing spar structure of the blade has been identified as showing substantial promise for cost effective weight reductions and increased stiffness. In particular, new large tow carbon fibers result in improving blade structural properties at a reduced cost relative to an all fiberglass blade. While carbon fibers tend to have excellent stiffness and tensile strength prop-erties, realizing the full benefits from carbon fibers will require fabric architectures that also result in good compressive strength. In opposite the use carbon fiber requires to predispose devices in order to protect the electric components from lightings. Re-garding the price of carbon fiber, it has been speculated that increased demand could result in economies of scale to reduce carbon fiber production costs. However, the carbon fiber industry remains dominated by aerospace applications that can pay a high premium price for materials with low weight and desirable structural and ther-mal properties.
Figure 14: Rotor blade inner composition [BAYE14]
Another innovative use of material in rotor blade industry has been introduced by Bayer. The company developed a special plastic polyurethane (PU) capable to re-place the epoxy resins as bonding material. This new material will lead to rotor blades 10 % lighter and faster to produce even if, due primarily on the cost of the raw materials, for high volumes vacuum injection molding is still more cost effective. Currently using highly viscous epoxy resins the curing process takes up to 24 hours to be completed, while with Bayer’s PU is possible to save up to 7 hours because the new PU resin have significantly better flow characteristics. It spreads more evenly in the mold and flow more quickly through the fiber mats and it cures faster than epoxy resin. Moreover the polyurethane rotor blades are more break proof and lighter than the ones made of epoxy resins. And they have a longer service life. It is also easier with the new material, in the future, to fully automate production using robots.
2.1.3 Methods and criteria to evaluate products
On the basis of the informations collected about the innovative trends in rotor blades design and production some criteria have been identified to evaluate each innovation toward the current design utilising a concept scoring matrix.
2.1.3.1 Chosen criteria
The criteria in tab.1 have been chosen to evaluate each alternative considering costs and output ratios, both area are very important to meet the market requirements.
Moreover the maturity level of the technology has been inserted to consider how far is the innovation from the actual use on the market.
Table 1: Chosen criteria
Further explanations are needed for some criteria:
Manufacturing costs consider the additional costs generated by the special technologies used for that particular innovation.
Indirect costs are linked to the weight of the rotor blade. The more the rotor blade is heavy, the more the other components have to be resistant and hence costly to resist to the inertia forces generated.
All new trends are evaluated for comparison with the actual standard design, utilizing the scoring system illustrated in tab.2. Except for the technology maturity criterion, for that criterion the reference value is 5 (already on the market).
Evaluation
Relative performance Score
Much worse 1
Worse 2
As current (reference) 3
Better 4
Much better 5
Table 2: Evaluation criteria
Manufacturing costs Production time Required space Transport costs Mounting costs Reiabilty costs Maintenance intervals
Indirect costs Other components resistance required Power/lenght ratio
Lenght/weight ratio State of art Technology maturity Production costs
Handling costs
Output ratios Criteria
2.1.3.2 Evaluation and conclusions
To each criterion has been assigned a weigh from 1 to 5 and then these weights have been normalized to 1. The total score of each alternative is given by the sum of its weighed score
𝑆𝑗 = ∑ 𝑟𝑖𝑗𝑤𝑖
𝑛
𝑖=1
(2.1)
Where:
rij = evaluation of the concept j regarding the criterion i
wi = weight of the criterion j
n = number of criteria
Sj = total score of the concept j
The results of the concept scoring analysis are shown in tab.3
M od ula r b lad es S mart rot o r b lad es P las ti c po lyu ret ha ne
Metrics Weights Score weighed
score Score weighed score Score weighed score Manufacturing costs 5 2 0,263 1 0,132 3 0,395 Production time 3 2 0,158 1 0,079 4 0,316 Required space 2 5 0,263 2 0,105 3 0,158 Transport costs 4 5 0,526 2 0,211 3 0,316 Mounting costs 2 2 0,105 1 0,053 3 0,158 Maintenance intervals 4 3 0,316 2 0,211 4 0,421 Other components 4 3 0,316 4 0,421 5 0,526 Power/lenght ratio 5 3 0,395 5 0,658 3 0,395 Lenght/weight ratio 4 2 0,211 4 0,421 4 0,421 Technology maturity 5 4 0,526 2 0,263 3 0,395 Total score 3,08 2,55 3,50
The analysis shows that the most promising innovation is the use of plastic polyure-thane as bonding material, followed by the modular blade design and in the third place the modular blades, penalized by the high production costs and by the immatu-rity of the technology even if the advantages in terms of generated power/length and power/weight ratio are doubtless.
In conclusion to be effective on the market in short/mid terms the best strategy is to adopt as soon as possible the modular blade design, because is effective and the technology is almost mature. Meanwhile continue the research about PU as bonding material and smart rotor blade in order to be able to launch those product before competitors.
2.2 Technology planning for the production of rotor blades
Future trends in rotor blade design have been explained in the previous subchapter. In this subchapter the technologies needed to realize these new design trends. Moreover other interesting production technologies are explained and evaluated, in order to make easier to decide witch technologies worth to adopt.
2.2.1 Technology related to new products
The promising rotor blade design trends identified are:
Smart rotor blades
Modular blades
Polyurethane blades
The technologies needed to realize those concepts are now briefly described. 2.2.1.1 Smart rotor blade
To build a smart rotor blade needs several modifies and investments for a standard rotor blade factory. In first molds have to be modified to include dedicated spaces for moving parts, actuators and wirings. Is also needed to adopt new tools to mount the new components and connect cables. Usually electronic components are bought from third company so also is necessary to find the right suppliers and conclude con-tracts. Lastly even if electronic components are procured from outside, the company has to adopt facilities suitable to control and check the operations of the rotor blade.
Figure 15: Details of actuators and wirings inside a smart rotor blade [MAIN05] 2.2.1.2 Modular blades
In order to construct a modular blade the company has to adopt new molds for each part of the blade and tools in order to manufacture the double lap-shear joint used to link the two parts. However this innovative design is the one that requires the lower investments to be adopted.
2.2.1.3 Polyurethane blades
For use Polyurethane as molding material is necessary to adopt a variant of the standard vacuum injection (see paragraph 2.2.2) called RIM (Reaction Injection Molding) process.
Figure 17: Diagram of a typical RIM process [DESI06]
RIM processes, are processes for the rapid production of complex plastic parts using low viscosity monomers or oligomers. The low viscosity and low pressures of filling translate into lighter weight and more complex molds, and hereby lower costs, it opens up lots of other possibilities and applications. Disadvantages of Reaction In-jection Molding also arise from its low viscosity: It is difficult to seal molds and gas bubbles can become trapped during filling of the mold, due to instability of the flow front. Lastly the raw materials are more costly than epoxy resins.
2.2.2 Other technology trends
Production of rotor blades currently is very labour intensive. It requires a lot of time and large spaces and several operation are full manual. In this chapter are analysed the near future trends that are going to optimize the production through improvement in molds, improvement in resin injection methods and automation introduction.
2.2.2.1 Molds
Figure 18: Example of a rotor blade mold [WESU09]
As blades become longer the molds themselves will become larger and heavier. The molds have to process a larger quantity of materials in an increasingly rapid cycle time. Molds should permit a variety of blades to be produced with the minimum down-time. To achieve these objectives mold makers are working on improvements such as:
• Develop of one-shot manufacturing processes to increase output and eliminate fin-ishing operations by improving the closing systems in order to improve the surface finish of the blade.
• Modular design permitting blade alternatives by only changing parts of the molds in order to produce different variants of rotor blades, e.g. standard rotor blades, modu-lar blade or smart rotor blade of the same size.
• ‘Smart molds’ that are able to self monitor blade processing parameters by using distributed sensors in order to monitor the state of the material inside and decide the best combination of pressure, heat and cooling speed for the current conditions.
2.2.2.2 Resin transfer
Currently due to environmental and safety reasons the rotor blade industry is moving away from open mold technology. In particular in order to eliminate hazardous sty-rene emission not present in a closed mold processes.
Figure 19: Manual lay-up operation in an open mold process [TECN11]
In closed mold techniques fibrous material is impregnated by a resin flow and vacu-um is used to move resin in the mold. This technique leads to decreasing labor cost and increased mechanical properties, compared to the traditional hand lay up pro-cess.
In order to assure a high level of quality and reliability voids in the matrix of the com-posite must be avoided. Another technological challenge is the size of the product. Vacuum bagging makes use of the atmospheric pressure and consequently the pos-sible size of the mold could be infinite. However, the applied resin with its viscosity and curing time restricts the size.
Figure 20: VARMT process diagram [BROU03]
Vacuum assisted resin transfer molding (VARTM) is the most viable technology de-spite is basically very simple: dry reinforcements is placed in a mold, the mold is closed and resin flows into the mold and impregnates the reinforcements. The driving force for the flow of the resin is pressure difference.
𝐹𝑖𝑙𝑙 𝑡𝑖𝑚𝑒 = 𝜑𝑛𝑙
2
2𝑘∆𝑃 (2.2)
With φ porosity of the reinforcements, k permeability of the reinforcements, η viscosity of the resin, l flow distance, ΔP applied pressure difference (constant during the injec-tion). Equation above shows how different parameters influence the fill time and hence the cycle time of a product. The parameters can be split in:
Material properties: resin viscosity; reinforcements porosity permeability
Product properties: size, volume and shape of the structure
Process properties: pressure difference; injection strategy
The quality of fiber composites is governed by process parameters and materials used. One of the most important quality aspects is the void content in the finished part. The mission of the researchers in this field is to find the most effective way to eliminate the void from the manufactured parts.
Concerning void formation, the main causes are generally due to permeability on a filament, outgassing of dissolved gas in the resin and evaporation of volatile compo-nents in the resin.
One way of reducing the void content is to use degassed resin. There are basically two advantages of using degassed resin:
Greatly reduced risk of outgassing from the resin;
Increased capability to dissolve bubbles formed during flow.
The standard procedure to degas resin is to expose the resin to partial vacuum. But standard degassing is highly questionable because if no bubble nucleation sites or bubbles are present there will not be any outgassing.
Two other methods for degassing the resin are more effective: Adding nucleation material
Some reinforcement materials (like Unifilo) exhibit good bubble nucleation properties, and therefore will result in laminates with a higher void content. This material con-tains bubble nuclei as entrapped air in cavities. Bringing the resin in contact with a nucleation material at reduced pressure leads to a much more effective degassing procedure and a better laminate quality. Materials that have been proven to be very effective are Scotch Brite and Unifilo glass mat.
Sparking
A container is filled with resin. The pressure in this container is reduced to a pressure below the injection pressure. Then air is fed into this container. The air is forced through a very fine filter, thus creating many small bubbles. These bubbles rise through the resin. At the reduced pressure, the resin will be over-saturated with air. The difference in gas concentration between the air bubble and the dissolved gas causes gas molecules to diffuse from the resin into the bubble. This process contin-ues until a new equilibrium situation is reached.
If degassed resin is used during the vacuum injection process, and the injection pressure is higher than the degassing pressure, there is no risk of outgassing of the resin.
2.2.2.3 Automation opportunity
There are many opportunity to implement automation in almost every step of rotor blades production.
In layering the most advanced prototypes are CNC controlled system composed by a gantry with multi axis end effectors capable of manipulating spray heads and adhe-sive applicators, as well as tooling for spooling and placing materials.
Figure 21: MAG automated lay up system [MAGI09]
Rapid Material Placement and quick cure molding systems combine to reduce labor content by 2/3 and producing time by 50 %. The most advanced system proposed by MAG is capable to 3 m/sec lay-up speed in materials placement, with laser vision-based wrinkle detection in cross or longitudinal directions. The lay-up system is me-chanically repeatable to ±2 mm, with application tolerance of ±5 mm.
Two of these gantry systems adjacent can each produce a 45 meter blade shell half in less than two hours. The gantry system rides on rails that are flush with the floor. It also carries bulk supply systems for gel-coat and adhesive.
The CNC code is generated offline importing data from CAD files through a proprie-tary software.
Automation can also be implemented in curing and finishing step. In curing research-ers are developing the so called “smart molds” that utilizing sensors can monitor the state of the inner material and optimizing the resin injection parameters and the
cur-ing temperature. In finishcur-ing operations are under development CNC system similar to the ones utilized for lay up operation but with five axis machining heads capable of drilling milling and sawing rotor blade surfaces.
Figure 22: Automated finishing system [LIEB14]
2.2.3 Methods and criteria to evaluate technologies
Once that the new technologies have been analysed is needed a method to evaluate all of them in order to make possible to discriminate technologies on the basis of the grade of the benefits that the company will obtain from adopting a particular technol-ogy. In other words is necessary to assess all the technologies to be able to select the ones that worth to adopt fromthe ones that is better to discharge. To evaluate the various technologies various methods have been used and combined in order to ob-tain more robust results. In the following paragraphs all the methods taken into ac-count are reported.
2.2.3.1 Methods considered
Before arriving at the chosen method of evaluation, the most common instrument used for investment decision making have been assessed and combined in order to
arrive at the most complete and robust analysis possible. In order have been consid-ered the following methods.
2.2.3.2 Portfolio Analysis
The portfolio analysis is born to evaluate business unit and to decide which business is more profitable. In this case has been used to evaluate the available technologies on the basis of the gained benefit of the whole project. One of the most famous in-strument for portfolio analysis in the BCG matrix fig.23 created by Boston Consulting Group in 1970 to help corporations to analyze their business units or their product lines. The matrix analyses the company business units or product lines through 2 market parameters: Relative market share and Market growth rate.
Relative market share
𝑅𝑒𝑙𝑎𝑡𝑖𝑣𝑒 𝑚𝑎𝑟𝑘𝑒𝑡 𝑠ℎ𝑎𝑟𝑒 = 𝐶𝑜𝑚𝑝𝑎𝑛𝑦 𝑚𝑎𝑟𝑘𝑒𝑡 𝑠ℎ𝑎𝑟𝑒
𝐿𝑎𝑟𝑔𝑒𝑠𝑡 𝑐𝑜𝑚𝑝𝑒𝑡𝑖𝑜𝑟 𝑚𝑎𝑟𝑘𝑒𝑡 𝑠ℎ𝑎𝑟𝑒 (2.3) Relative market share on the largest competitor is an indirect parameter utilized to indicate how much cash can generate a business unit. The model assumes that the cash generated by a business unit and its market share are directly proportional. All possible results can be reduced to these three main cases:
1. Company share equal to largest competitor share: Ratio is 1, center of the sheet.
2. Company share > largest competitor share: Ratio is >1, the business unit has a relative strong position and will take place in the right side of the sheet. The business unit will generate a high level of cash.
3. Company share < largest competitor share: Ratio is <1, the business unit has a relative weak position and will take place in the left side of the sheet. The business unit will generate a low level of cash.
The reason for choosing relative market share, rather than just profits, is that it car-ries more information than just cash flow. It shows where the brand is positioned against its main competitors, and indicates where it might be likely to go in the future. It can also show what type of marketing activities might be expected to be effective.
Market growth rate
𝑀𝑎𝑟𝑘𝑒𝑡 𝑔𝑟𝑜𝑤𝑡ℎ 𝑟𝑎𝑡𝑒 =𝑀𝑎𝑟𝑘𝑒𝑡 𝑣𝑜𝑙𝑢𝑚𝑒𝑡1− 𝑀𝑎𝑟𝑘𝑒𝑡 𝑣𝑜𝑙𝑢𝑚𝑒𝑡0
𝑀𝑎𝑟𝑘𝑒𝑡 𝑣𝑜𝑙𝑢𝑚𝑒𝑡0 (2.4)
Market growth rate is an indirect parameter utilized to indicate how many resources are absorbed by a business unit. The theory behind the matrix assumes that a higher growth rate is indicative of a higher demands on investment. The cut-off point is usu-ally chosen as 10 % per year. Above this rate is deemed to be significant the demand of cash of that business unit.
The market growth rate says more about the brand position than just its cash flow. It is a good indicator of market's competitiveness, of its future potential, and also of its attractiveness to future competitors.
M a rk e t g ro w th r a te [ % ] Star Dog Question mark Cow
?
Relative market share
0,0 1,0 2,0
0,0 5,0 10,0
Figure 23: BCG Matrix
On the matrix, the diameter of each business unit represents the value of its sales and on the basis of the two presented parameters the model divides the business units in 4 sectors with the following names and characteristics:
Cash cows: where company has high market share in a slow growing market. These units generate more cash than the amount needed to maintain the business. They have to be "milked" continuously with as little investment as possible, since such investments would be wasted in an industry with low growth rates.
Dogs: units with low market share in a mature, slow-growing industry. These units generate barely enough cash to maintain the business's market share. These units can provide social benefit like providing jobs or synergies with other business units.
Question marks: business operating in a high market growth, but having a low market share. They are a typical starting point for most businesses. Question marks have the potential to gain market share and become stars, and eventu-ally cash cows when market growth slows. If question marks do not succeed in becoming a market leader, then after years of cash consumption, they will de-generate into dogs when market growth declines. Question marks must be analyzed carefully in order to determinate whether the investments required are able to improve the market share.
Stars are units with a high market share in a fast-growing market. They are question marks who managed to reach a good market share. Stars require high funding to fight competition and follow the market growth rate. When in-dustry growth slows, if they have been able to maintain the category leader-ship, stars become cash cows. Else they become dogs due to low relative market share.
The natural cycle of a business units is to start as question marks, then turn into a stars. Then if the market stops growing the business unit becomes a cash cow. At the end of the cycle the cash cow turns into a dog (blue arrows in fig.23).
The overall goal of this ranking is to help corporate analysts to decide which business units to fund and which units to sell. The standard strategy is to use money generat-ed by the cash cows to fund the stars and question marks.
Regarding the evaluation of technologies this method can also be used, but in this case the standard parameters of the BCG matrix are not applicable because it is not possible to evaluate a new technology on the basis of its market share or its market
growth. However it is possible to use more effective parameters such as the total benefits and the total costs that are expected from adopting that technology (fig.24). In this case the sectors detects the technologies that worth to adopt from the ones that is better to discharge. In this matrix diameters and colors of the technologies can represent several characteristic such as purchasing price, technology area or longev-ity of the technology.
Global costs G lo b a l B e n e fi ts Winning technologies Technologies to discard Question mark Low attractivness
Figure 24: Technology portfolio
The next step is to evaluate the two parameters used to discriminate the portfolio: cost and benefits of considered technologies.
2.2.3.3 Global costs evaluation
The tool used for cost evaluation is TCO (Total Costs of Ownership) in order to take into account all the direct and indirect cost related to a particular technology during its whole operative life. The costs have been divided according to VDMA 34160.
Figure 25: TCO structure
2.2.3.4 Global benefit evaluation
To consider every possible benefit derived from the adoption of the new technology and not only the financial aspect the TBO (Total Benefits of Ownership). With this methodology even indirect or potential benefit such as company image or employees motivation are taken into account [EIKÖ11].
Dismissing costs Operating costs Preparatory costs TCO -Purchasing costs -Material costs -Labor costs -Manteinance -Dismantling cost -Recycling costs -Logistic costs
Figure 26: TBO structure
Discounted cash flow based method
The methods based on discounted cash flow are commonly used to evaluate invest-ments. In this study to evaluate technologies have been taken into account PBT and NPV. In capital budgeting the payback time (PBT) refers to the period of time re-quired to recoup the funds expended in an investment, instead the net present value (NPV) of a series of cash flows, is defined as the sum of the present values of the individual cash flows of the same entity, an investment is considered profitable when NPV>0. These two methods are very useful to evaluate quickly the profitability of an investment and secondly its risk, but if used alone can lead to misleading results and moreover not always cash flows are easy to predict. In particular PBT naturally tends to favor short terms investments instead in NPV is difficult to include non monetary benefits of the investment.
Indirect benefit Potential benefit Direct benefits TBO -Output level -Scrap rate -Corporate image -Employees motivation
-Attractiviy for new emploees
-Process optimization -Process reiability
2.2.3.5 The TCBO approach
To consider the effects of the adoption of a new technology from the widest possible point of view has been used the total costs and benefits of ownership (TCBO) ap-proach that combines all the methods showed previously. The basic structure of the TCBO is shown in fig.27.
Figure 27: TCBO basic structure
With this method is possible to consider every effects of the adoption of the technol-ogy, both for costs and benefits, then is possible to evaluate the difference between the total cost and benefits of the alternative technologies and then choose the ones that have the higher residual benefits as shown in fig.28.
Figure 28: TCBO difference between total benefit and costs in different technologies
Main elements of TCBO
TCBO TCO TBO Operating phase Preparatory phase Utilization Indirect benefit Direct
2.3 Factory planning for the production of rotor blades
Figure 29: Inside of a wind rotor blade factory [ASTR11]
This subchapter contains an analysis of the current factory concepts utilized for the production of rotor blades. All the resources involved are presented and also how the workforce is organized and how the production is managed. After have been taken in account different possible ways to improve the current factory concept in order to prove the production efficiency. In the last part of the subchapter the different im-provement concepts have been critically analysed in order to understand which modi-fies are more promising.
2.3.1 Current factory situation
All the elements used during the realization of a rotor blade are analysed in order to highlight in the following paragraph where is possible to improve the production effi-ciency. All the elements have been divided in three categories that will be explained singly.
2.3.1.1 Resources
As resources are considered all the elements needed to properly manufacture the product. It is possible to divide the manufacturing resources needed into the opera-tion in which are used. The manufacturing operaopera-tions are divided in: Layering, infu-sion, tempering, machining, varnishing and transport. Infusion and tempering are considered together.
Figure 30: Rotor blade production workflow Layering
During this operation the various layers of material that compose a rotor blade are positioned on each other inside the mold. The resources utilized in this operation are of course the molds, the equipment necessary to transport the material near the mold and the gear used to lay the material.
Infusion and tempering
This two operations can be linked together. During the infusion operation the bonding material in pumped into the mold by a pressure difference and then a heat source provide to cure the bonding material. The resources involved are again the molds but in addiction have to be considered the equipment necessary to perform the vacuum infusion and the equipment used for generate the heat necessary to cure the materi-als. Lastly have to be considered the equipments necessary for demolding opera-tions.
Machining
Figure 31: Grinding and drilling operations on a rotor blade flange [WINT13]
Machining operations can be divided in flange working and aerofoil grinding. In flange working (fig.31) the flange is manually grinded in order to obtain a plane surface. Then robots provide to drill the flange and to insert the bolts required to fix the blade at the rotor hub.
Figure 32: Manual aerofoil grinding [GAME12]
Aerofoil grinding (fig.32) is executed manually in order to improve the surface finish-ing of the rotor blade that as it is just out of the mold is not acceptable, mainly due to casting flashes.
Varnishing
Figure 33: Robots varnishing a rotor blade [HAND10]
Varnishing operations are needed in order to protect rotor blades materials from weather effects and for visibility reasons. Are performed by automated robots (fig.33). Transport
Inside the factory, transportations devices are used to move the products among the various departments avoiding damages to the workers and to the products them-selves. Currently are used cranes with vacuum lift grippers to demold and move the rotor blades (fig.34).
Fig.35 shows an overview of all the equiments used during the production of a wind rotor blade. -Molds -Transport devices -Laying devices Equipment -Molds -Vacuum infusion devices -Heating devices -Demolding devices Equipment -Cranes with vacuum lifters Equipment -Automated varnishing robots Equipment Layering Infusion/ tempering Flange working Aereofoil
grinding Varnishing Transport -Manual grinding devices Equipment -Manual grinding machines -Automated drilling robots -Automated bolt inserction robots Equipment
Figure 35: Equipment summary 2.3.1.2 Manufacturing strategy
As manufacturing strategy is intended the way in which the manufacturing process is organized. Currently the adopted production type is a construct site production, where different areas of the factory are equipped for the different operations and the pieces are handled from a department to the other. Because of the long time needed to complete some operation and the not sequential positioning of the different de-partment is not possible to call this a flow production even if the sequence of the op-erations are almost always the same (fig.36).
Figure 36: Factory organization
Is possible to describe with a flowchart the operations sequence. The production plant as already shown in fig.36 is divided in three departments called prefabrication, shell production and finishing. In prefabrication the different components of which is composed of the blade are manufactured. In shell production the blade is assembled and cured. In the finishing department the blade is trimmed, polished and varnished. In fig.37 is shown a flowchart of the main operations performed.
Shell Production Shell Form SS Shell Form PS Shell Form SS 2 Shell Form PS 2 Shell merging Shell merging 2 Prefabrication Finishing Trimming Repair Lamination Drilling Lightning
Protection Anti Icing Surface Treatment2 Main Shear
Web Form Trailing Edge Shear Web Form
Main Girder Form Main Girder Form 2 Trailing Edge Girder Form Trailing Edge Girder Form 2 Blade Root Form Blade Root Form 2 Surface Treatment
Figure 37: Operations performed divided by department from simulation model
Regarding the production organization currently is adopted a standard made to stock policy.
2.3.1.3 Workers Organization
Under worker organization are inserted all the policies and the rules used to describe how the company organize the division of work in the various operations and how the shift system is organized in order to achieve the best results. Currently the plants works on 3 shifts and there are 50 workers for shift for a total of 150 workers. The workers are divided in pools, there are 3 pools that take name from the 3 department and other like quality or logistic that works in more than one department, the division of the workers in pools is shown in fig. 38.
50 workers for shift Molds Cleaning Prefabrication Shell production Finishing Quality Logistic Shell merging 5 Workers 10 Workers 12 Workers 10 Workers 2 Workers 4 Workers 6 Workers
Figure 38: Workers amount and division in one shift
Inside a pool, the simulation model for an operation calls the first operator in the pool, if the first is already busy calls the second, and so on. If there aren’t enough operator available the operation has to wait. For the analysis only the 3 main departments of prefabrication, shell production and finishing are taken into account.
2.3.2 Alternative factory configuration
In this paragraph are analysed various opportunity of improvement in factory organi-zation, divided in the category presented before.
2.3.2.1 Resources
Regarding resources the trends lead to increase the level of automation in the opera-tions that are still fully manual. In layering operaopera-tions is possible to identify the possi-bility of implement an automated layering system that will decrease substantially the time required for that operation. In infusion/tempering operations there is the oppor-tunity to adopt smart molds and heating system capable of maintain always the best condition of heat and pressure possible. Regarding machining operations in first there is the opportunity to implement automation in grinding operation and then to combine grinding and drilling operations using the same equipment (e.g. robots with
multi tools head). In fig.39 is shown a summary of the possible improvement in re-sources area. -Molds -Transport devices -Laying devices Equipment Improvement -Automated laying system -Molds -Vacuum infusion devices -Heating devices -Demolding devices Equipment Improvement -Self monitoring molds -Smart tempering system -Cranes with vacuum lifters Equipment -Automated varnishing robots Equipment Layering Infusion/ tempering Flange working Aerofoil
grinding Varnishing Transport -Manual grinding devices Equipment Improvement -Automated aerofoil grinding system -Manual grinding machines -Automated drilling robots -Automated bolt insertion robots Equipment Improvement -Automated grinding machines or robot
Figure 39: Equiments improvement opportunity 2.3.2.2 Manufacturing strategy
In manufacturing strategy there are several improvement possibilities to be evaluat-ed. In first there is the possibility to switch from a construction site production to a flow production with advantages in terms of efficiency and material handling opera-tions saving.
In addition is possible to parallelize operation, especially in the prefabrication phase where the roots laying require more time because there are more layers of material to be laid. In this situation by parallelize the root and the rest of the blade preparation is possible to save time, then the two parts will be put together in the mold before cur-ing.
Another more invasive possibility of improvement is to combine two departments, in particular prefabrication and shell production, in order to save time due to internal transports savings and also workers could be reorganized to serve the new com-bined operations. Lastly is possible to evaluate to substitute the current made to stock policy with a push strategy based on demand forecast or a pull strategy on the basis of costumers’ orders, with the intention to decrease the stock levels. In fig.40 is shown an overview of the presented improvement possibility.
Production control Made to stock Pull strategy Push strategy Production type Costruction site Flow production Layout optimization Separate departments Production optimization Sequential process Process parallelizaion Additional shell mould
Pref. shell prod. and finishing merging Pref. and shell prod. merging
Figure 40: Manufacturing strategy improvement summary
Factory alternatives are going to be evaluated in the next steps of the project. 2.3.2.3 Worker organization
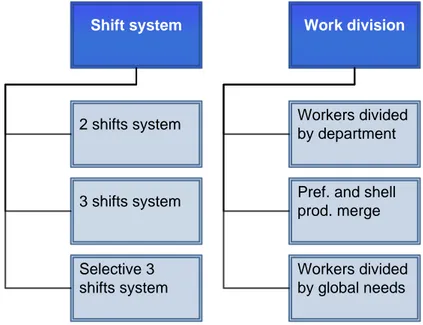
Regarding the worker organization is possible to evaluate the profitability of switching from a two shifts system to a three shifts system. Also could be considered the op-portunity to extend the third shift only in the most time consuming operations, like prefabrication or end production. Otherwise is possible to evaluate the effects derived from a reorganization of the workforce based on global or aggregate needs and not divided by department needs even if this operation will generate further training needs among the workforce. In fig.41 is shown an overview of the improvement pos-sibilities in workforce organization.
Shift system 2 shifts system Selective 3 shifts system 3 shifts system Work division Workers divided by department Workers divided by global needs Pref. and shell prod. merge
Figure 41: Workforce organization improvement summary
2.3.3 Methods and criteria to evaluate factory concepts
In this section are going to be presented several instrument for the evaluation of fac-tory concepts. These instrument will be used to evaluate the effects of the introduc-tion of a new technology or an alterative factory concept. The basic instrument to evaluate alternative factory concepts is the simulation. Using the plant simulation software is possible to recreate the factory plant very precisely at level of material flow, people involved and lead times required. In this way after the creation of a real-istic model is possible to implement quickly each alternative factory concept and evaluate the difference between the modified model and the original. Plant simulation software make available several instruments to evaluate the simulation results, the most important are now going to be presented.
2.3.3.1 Sankey diagram
Sankey diagrams are a specific type of flow diagram, in which the width of the arrows represents to the flow quantity. Are commonly used to visualize energy accounts, costs or material flow accounts in a process. Sankey diagrams put a visual emphasis on the major transfers or flows within a system. They are helpful in locating dominant contributions to an overall flow. Often, Sankey diagrams show conserved quantities within defined system boundaries. An example of Sankey diagram is shown in fig.42.
Figure 42: Example of a Sankey diagram 2.3.3.2 Bottle neck analysis
An activity which delays the performance of a system and reduces overall efficiency of the process is defined as bottleneck. There can be many different types of bottle-neck in manufacturing as people constraints, material constraints, equipment con-straints and process concon-straints.
Bottleneck is one of the main reason for slowdown of the production in a manufac-turing unit. It has to be identified, analysed and needs to be resolved on the basis of facts. Once the bottleneck is identified correctly and efficiently it helps to reduce pro-duction cost increasing overall efficiency of the system. Bottleneck can be identified in a process following several approaches, In particular in this case the bottleneck of the system is identified by simulation. Usually is possible to identify the bottleneck as the operation with the minimum idle time (machine not working and not in break-down). In other words the operation with the highest grade of utilization, which means that a delay in that operation cause a delay in the entire process and usually the lead time of the entire process depends in most part from the lead time of that operation. 2.3.3.3 Work in process analysis
In supply chain management work in process goods (WIP) are defined as the num-ber products worked at the same time in the manufacturing system. Optimal produc-tion management aims to find a factory concept that minimize work in process. Work in process requires storage space, represents bound capital not available for invest-ment and carries an inherent risk of earlier expiration of shelf life of the products. A queue leading to a production step may indicate insufficient capacity to process the output from these preceding steps.
![Figure 2: Wind energy growth rate per country [BERG11]](https://thumb-eu.123doks.com/thumbv2/123dokorg/8020798.121947/14.892.223.663.151.498/figure-wind-energy-growth-rate-country-berg.webp)

![Figure 9: Lift control capability of a variety of aerodynamic control surface concepts [SHUB12]](https://thumb-eu.123doks.com/thumbv2/123dokorg/8020798.121947/20.892.146.795.132.450/figure-control-capability-variety-aerodynamic-control-surface-concepts.webp)
![Figure 12: Description of a modular blade joint concept [GAME12]](https://thumb-eu.123doks.com/thumbv2/123dokorg/8020798.121947/24.892.132.809.137.562/figure-description-of-modular-blade-joint-concept-game.webp)
![Figure 15: Details of actuators and wirings inside a smart rotor blade [MAIN05]](https://thumb-eu.123doks.com/thumbv2/123dokorg/8020798.121947/30.892.216.717.126.470/figure-details-actuators-wirings-inside-smart-rotor-blade.webp)
![Figure 19: Manual lay-up operation in an open mold process [TECN11]](https://thumb-eu.123doks.com/thumbv2/123dokorg/8020798.121947/33.892.190.748.262.549/figure-manual-lay-operation-open-mold-process-tecn.webp)