ARTICLE
A glomerulus-on-a-chip to recapitulate the human
glomerular
filtration barrier
Astgik Petrosyan
1
, Paolo Cravedi
2
, Valentina Villani
1
, Andrea Angeletti
3
, Joaquin Manrique
4
,
Alessandra Renieri
5
, Roger E. De Filippo
1,6
, Laura Perin
1,6,7
& Stefano Da Sacco
1,6,7
In this work we model the glomerular
filtration barrier, the structure responsible for filtering
the blood and preventing the loss of proteins, using human podocytes and glomerular
endothelial cells seeded into microfluidic chips. In long-term cultures, cells maintain their
morphology, form capillary-like structures and express slit diaphragm proteins. This system
recapitulates functions and structure of the glomerulus, including permselectivity. When
exposed to sera from patients with anti-podocyte autoantibodies, the chips show albuminuria
proportional to patients
’ proteinuria, phenomenon not observed with sera from healthy
controls or individuals with primary podocyte defects. We also show its applicability for renal
disease modeling and drug testing. A total of 2000 independent chips were analyzed,
sup-porting high reproducibility and validation of the system for high-throughput screening of
therapeutic compounds. The study of the patho-physiology of the glomerulus and identi
fi-cation of therapeutic targets are also feasible using this chip.
https://doi.org/10.1038/s41467-019-11577-z
OPEN
1GOFARR Laboratory for Organ Regenerative Research and Cell Therapeutics in Urology, Saban Research Institute, Division of Urology, Children’s Hospital Los Angeles, Los Angeles, CA, USA.2Division of Nephrology, Icahn School of Medicine at Mount Sinai, New York, NY, USA.3Department of Experimental, Diagnostic and Specialty Medicine, Nephrology, Dialysis and Renal Transplant Unit, S. Orsola-Malpighi Hospital, University of Bologna, Bologna, Italy.4Nephrology Service, Complejo Hospitalario de Navarra, Pamplona, Spain.5Genetica Medica, Azienda Ospedaliera Universitaria Senese, Siena, Italy.6Department of Urology, Keck School of Medicine, University of Southern California, Los Angeles, CA, USA.7These authors contributed equally: Laura Perin, Stefano Da Sacco. Correspondence and requests for materials should be addressed to L.P. (email:[email protected]) or to S.D.S. (email:[email protected])
123456789
O
ver 10% of adults worldwide are affected by renal
abnormalities and the number of those with end-stage
renal disease (ESRD) receiving replacement therapy with
dialysis or transplant is estimated at >1.4 million, with an annual
growth rate of 8%
1. Major progresses in understanding
envir-onmental and genetic risk factors as well as pathogenic
mechanisms of renal disease progression have been accomplished,
but outcomes of affected individuals have not appreciably
improved over the last two decades
1.
Despite a wide variety of causes including metabolic
abnorm-alities, hypertension, autoimmunity, and genetic background, a
common early pathologic hallmark of chronic kidney disease
(CKD) is decreased glomerular
filtration and loss of functional
glomeruli
2. The main function of the glomeruli is to
filter fluids
and electrolytes from the blood, while retaining plasma proteins
3.
This activity happens at the level of the glomerular
filtration
barrier (GFB) and is coordinated by the interaction of two highly
specialized glomerular cells (the fenestrated endothelium and the
podocytes), which are separated by a thin layer of glomerular
basement membrane (GBM
4).
One of the major roadblocks to the development of successful
therapeutics for CKD depends on the ability to effectively
establish 3D models that can mimic the complex structure and
function of the GFB. Even though some success in generating
kidney structures has been described using conventional 2D or
3D culture systems (including spheroids and extracellular based
gels
5), the results are still inconsistent. The recent discovery of
kidney organoids allows the formation of nephron-like structures
that recapitulate some of the characteristics of the glomerular
environment
6, but they have no or limited
filtration activity and
the deposition of a correct GBM has not been fully demonstrated
yet. Most importantly, the cells used to generate these organoids
are derived from genetically modified cell lines and require
complex nephrogenic induction protocols, which may affect their
morphology and function
7.
Recently, the development of microfluidic platforms (organ on
a chip) that allow co-culture of cells and matrices, combined with
the application of perfusion and spatial control over signaling
gradients
8, have been used for physiological studies and drug
discovery for many complex organs including liver, heart, gut,
lung, and brain
9–15. The chip technology has been used to
replicate renal structures, including proximal tubules
16–19and, in
few instances, the glomerular compartment
20–22. However, in the
majority of the current glomerular chips, podocytes and
glo-merular endothelial cells are separated by a synthetic membrane
usually constituted by polydimethylsiloxane
8,23,24. While these
membranes are equipped with openings (pores) that allow free
exchange of media and growth factors, they do not allow the
proper crosstalk between glomerular cells that is key for GFB
function.
Herein, we describe a glomerulus-on-a-chip (referred to as
GOAC) constituted by human podocytes and human glomerular
endothelial cells (hGEC) seeded on Organoplates
TM(MIME-TAS). Our system is characterized by the absence of an artificial
membrane separating the two monolayers. Cells can be cultured
in these chips for long term, maintaining their phenotype, and
glomerular cells can properly interact to generate layer of
extra-cellular matrix composed by collagen IV trimer and laminin, the
major constituents of the GBM in vivo. Such GFB-like structure
recapitulates function of the GFB, including selective permeability
and response to nephrotoxic compounds. We validated specific
functionality of these chips using serum from individuals affected
by
different
glomerular
diseases,
including
membranous
nephropathy (MN) and evaluated drug response.
We also assessed response of GOAC to glucose-induced
damage and performed studies of disease modeling by
generating GOAC using amniotic
fluid kidney progenitor-derived
podocytes (hAKPC-P
25) from subjects affected by Alport
syn-drome (AS), a hereditary CKD characterized by mutations in the
alpha chains of COL4 genes
26. Chips generated using these AS
podocytes present impaired permselectivity to albumin, due to a
dysfunctional assembly of the GBM, typical of AS.
Results
Characterization of human podocytes and hGEC. In this work,
we used different types of podocytes of human origin: (1) primary
podocytes (hpPOD); obtained from discarded kidneys harvested
from patients with non-nephrological cause of death, thus the
cells were healthy; (2) immortalized podocytes (hiPOD)
con-sidered for many years the gold standard for in vitro cultures
27,28;
and (3) amniotic
fluid-derived podocytes (hAKPC-P): obtained in
our laboratory as published
25. hAKPC-P can be derived with
minimal cell manipulation and, before differentiation, can be
expanded for many passages while maintaining their ability to
differentiate into podocytes with high efficiency.
hpPOD were obtained from human glomeruli and positively
selected for nephrin (Supplementary Figs. 1a, b and 2a) and were
seeded immediately after isolation or after one passage in culture.
hAKPC-P (Supplementary Fig. 2b,) and hiPOD were
differen-tiated in VRADD media on collagen I prior to seeding on the
chip
28. Podocyte morphology is evident in all three lines
(Supplementary Fig. 2c–e) as well as expression of markers
typical of mature podocytes such as WT1 and the slit diaphragm
protein nephrin (Supplementary Fig. 2f–k) (Fig.
1
a–f), while they
were negative for CD31 (endothelial marker) (Fig.
1
g–i;
Supple-mentary Fig. 2l–n) and wheat germ agglutinin (WGA, identifying
the endothelium glycocalyx), overall confirming their podocyte
phenotype (Supplementary Fig. 2o–q).
The glomerular endothelium is characterized by unique
fenestrations that can be considered an analogous of podocyte
filtration slits and contributes to the GFB function. Primary
hGEC, isolated from the same kidneys from which hpPOD were
derived, were negative for podocyte markers (WT1, nephrin) and
positive for CD31 and vascular endothelial growth factor receptor
2 (VEGFR2; this receptor is expressed in vivo by GEC since they
highly respond to the VEGF gradient signaling from podocytes
4)
and WGA (Fig.
1
j–l; Supplementary Fig. 3a, b, e–i). hGEC were
also found to be positive for EH domain containing 3 (EHD3,
Supplementary Fig. 4a, b), a marker specifically expressed by the
human glomerular endothelium in the kidney (Supplementary
Fig. 4c
29). These hGEC are characterized by the presence of
fenestrations (with an average diameter of 60.55 nm ± 3.35 SEM,
compatible
with
measurements
performed
in
previous
studies
30,31(Supplementary Fig. 4d). Positive expression for
major glycocalyx components like Syndecan-1 (Supplementary
Fig. 4e, f), Syndecan-4 (Supplementary Fig. 4g, h), and heparan
sulfate (Supplementary Fig. 4i) was also assessed
32. As negative
controls for podocytes and hGEC, we used human lines of
fibroblasts (hFIB) and human lung endothelial cells (HuLECs),
respectively. Both HuLECs and hFIB were negative for WT1 and
nephrin (Fig.
1
m, n, p, q; Supplementary Fig. 3j, k; o, p); HuLEC
were positive for CD31, VEGFR2, and WGA (Fig.
1
o;
Supple-mentary Fig. 3l–n) while hFIB were negative for all these markers
(Fig.
1
r; Supplementary Fig. 3q–s).
Culturing human podocytes and hGEC on the chip. We
first
investigated whether our system supports the culture of hGEC
and podocytes separately. A schematic representation of the chip
and channel seeding is shown in Fig.
1
s, t. Since collagen I
stratification present in channel E is achieved by meniscus
pin-ning, there is no artificial membrane between the perfusion lane
and the collagen. Therefore, the interaction of the layers of seeded
cells (channel C) and matrix recapitulates the in vivo GFB
oriented from endothelial cells, the GBM, podocytes, and the
urinary space of Bowman’s capsule (channel F). hGEC were
seeded in channel C (Fig.
2
a) and cultured in endothelial
med-ium. We confirmed their ability to form a capillary-like structure
in the chip (Fig.
2
b) and maintain expression of endothelial
marker CD31 (Fig.
2
c). Presence of an endothelial glycocalyx on
the surface was also confirmed by immunofluorescent staining
using WGA (Fig.
2
d). Thickness of the glycocalyx was confirmed
to be ~0.5
μm (Supplementary Fig. 4j), compatible with results
previously reported by other groups on human immortalized
glomerular endothelial cells
33and in vivo
32.
hAKPC-P, hiPOD, or hpPOD were seeded in channel C
(Fig.
2
e) and cultured in VRADD media. Confocal imaging
revealed that hAKPC-P, hpPOD, and hiPOD expressed nephrin
prevalently in primary processes (Fig.
2
f–h, magenta arrows),
which appeared less organized in hiPOD (Fig.
2
g) compared to
x x y z 500 400 300Count 200 Count Count
400 600 1.2K 900 600 300 200 0 0 100 0 500 400 300
Count 200 Count Count
400 600 1.2K 900 600 300 200 0 0 100 500 400 300 Count 200 100 Glomerular endothelium hGEC hGEC hGEC 0.013% 0.52% 0.092% 0.31% 0.91% 0.092% 82% 27.1% 0.13% HuLEC HuLEC HuLEC hFIB hFIB hFIB Control cells 0 2.5K 2.0K 1.5K 1.0K 500 Count Count 0 2.5K 2.0K 1.5K 1.5K 1.0K 1.0K 500 Count Count
Count Count Count
Count Count Count Count 0 500 WT1 NPHS1 CD31 0 1.5K 1.5K 2.0K 1.0K 1.0K 500 0 500 0 1.5K 1.0K 500 0 2.5K 2.0K 1.5K 1.0K 500 0 800 600 400 200 0 800 600 400 200 0 800 1.0K 600 400 200 0 800 1.0K 600 400 200 0 0 0 104 0 104 0 104 105 0 104 105 0 0 104 104 0 104 0 104 0 104 0 104 0 104 F F E E C C Cross section Cross section Vascular space Urinary space 0 104 105 0 104 105 0 104 105 0 104 105 0 104 105 0 104 105 0 104 105 WT1 NPHS1 CD31 hAKPC-P 98.9% 99.8% 99.9% 99.9% 0.69% 0.092% 99.8% 100% hiPOD hpPOD
hAKPC-P hiPOD hpPOD
hAKPC-P hiPOD hpPOD
Podocytes
a
b
c
f
s
t
e
d
g
h
i
p
m
j
k
n
q
r
o
l
1 C E F 2 3 0.22%hAKPC-P (Fig.
2
f) and hpPOD (Fig.
2
h). Taken together, these
results indicate that hGEC and podocytes can be cultured in the
chip maintaining their morphology and phenotype.
Structural characterization of GOAC. We next co-cultured
podocytes and hGEC to generate the GOAC (Fig.
2
i). First, we
filled channel E with collagen I and, after gelification, we seeded
podocytes in channel C. Within 20 min, they started layering on
the side of the collagen wall. After 24 h, all cells
firmly attached to
the wall to form a monolayer to cover the collagen surface. The
addition of hGEC was performed on the top inlet in channel C.
After 24 h, the chip was placed under
flow conditions and hGEC
started forming a continuous capillary-like layer that is evident as
soon as day 5 in co-culture (Supplementary Fig. 5a–i). When
CM-DiI-labeled podocytes (green) and CFSE-labeled hGEC
(magenta) were seeded together, they showed the ability to form
clearly distinguishable layers (Supplementary Fig. 5j).
Impor-tantly, selective expression of nephrin and CD31, respectively,
was confirmed by confocal microscopy (Fig.
2
j–l). Cells can be
co-cultured for at least 4 weeks, maintaining their viability
(Sup-plementary Fig. 5k–m), thus confirming that our seeding strategy
allows long-term maintenance of the cell phenotype in the chip.
Following successful
filling with collagen I our overall successful
rate for establishing the chip evaluated by visual observation was
81% (hAKPC-P
+ hGEC: 81.9% ± 3.7; hiPOD + hGEC: 88.9% ±
7.2; hpPOD
+ hGEC: 78.8% ± 11.1, error expressed as SEM).
Podocytes and endothelial cells alone do not guarantee the
correct function of the
filtration barrier in the absence of a GBM.
The human GBM is characterized by the presence of collagen IV
trimers, COL4α3α4α5 and in lower quantity of COL4α1α1α2
(ref.
34), and laminins (like LAM5α2β1γ)
35. Patients affected by
mutations of these membranous proteins (like AS or Pearson
Syndrome
36) present progressive CKD. Both podocytes and GEC
are necessary for the proper assembly of the GBM
35. Podocytes
are exclusively responsible for the production of COL4α3α4α5
while COL4α1α1α2 and LAM5α2β1γ are produced by both
podocytes and hGEC
37. We confirmed production and deposition
of
α1, α2, and α4 chains of the COL4 as well as α5 chain of LAM
for both hAKPC-P
+ hGEC and hpPOD + hGEC chips (Fig.
2
m);
the hiPOD
+ hGEC chip did show lower expression of these
proteins as confirmed by immunofluorescence (Fig.
2
n–v). We
further confirmed de novo deposition of GBM components
collagen IV (COL4α3) and LAMA5 (Fig.
2
w–y) by western
blotting, thus demonstrating that our chips resemble the
in vivo GFB.
In vivo, glomerular cells are subject to the mechanical stress
(shear stress) generated by the blood
flowing on the apical surface
of the endothelium and by the
filtrate flowing from the vascular
lumen to the Bowman’s space
38. Shear stress affects phenotype,
behavior, and permeability of both podocytes and endothelial
cells and therefore plays a key role in glomerular
hemody-namics
38. In glomerular capillaries, shear stress has been
estimated to range from approximately 1 to about 95 dyn/cm
2(corresponding to 0.1–9.5 Pa)
39. The shear stress within our
three-channel system, calculated based on a previous work
40, is
equal to 0.0117 Pa (or 0.117 dyn/cm
2), a value closer to the
physiological parameter compared to existing
glomerulus-on-a-chip systems established in other labs for which the reported
shear stress ranges from 0.003 (ref.
20) to 0.007 dyn/cm
2(ref.
22)
on the top channel.
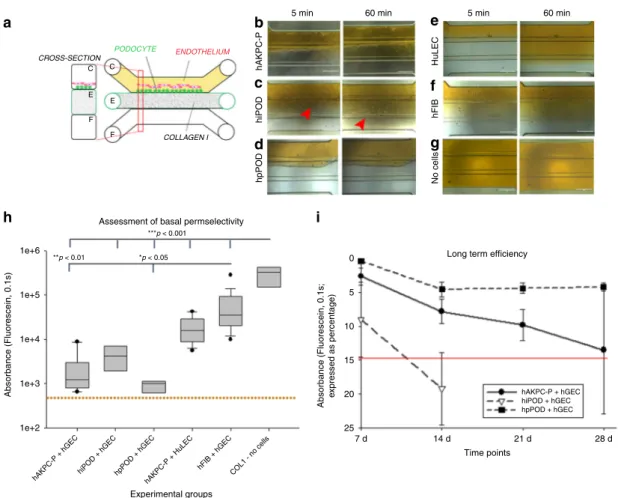
Permselectivity as functional measure of a working GOAC.
One of the most important characteristics of the GFB is
permselectivity, i.e. the capacity to
filter molecules based on their
size
3,41. Albumin is the most abundant protein in human plasma
and under physiological conditions is retained within the
bloodstream. Leakage of albumin in the urine is considered a
sign of kidney dysfunction, and its levels (albuminuria) correlate
with the severity of glomerular injury in mice and humans
3. We
tested chip permselectivity by adding a physiological
con-centration of FITC-conjugated albumin (40 mg/ml
42) to the
media in channel C (Fig.
3
a). hAKPC-P
+ hGEC, hiPOD +
hGEC, and hpPOD
+ hGEC prevented albumin leakage at 5 and
60 min (Fig.
3
b–d). To test the hypothesis that the
permselec-tivity was provided by the two contiguous layers of podocytes
and hGEC, the same experiment was repeated with chips
gen-erated with (1) podocytes
+ HuLEC (as negative control for
hGEC, Fig.
3
e), (2) human
fibroblasts (as negative control for
podocytes)
+ hGEC (Fig.
3
f), or (3) devoid of cells (Fig.
3
g). In
all these conditions, FITC-conjugated albumin easily
filled all
three channels at both 5 and 60 min (Fig.
3
e–g). Notably, the
hAKPC-P
+ HuLECs chip retained albumin selectively more
than
fibroblasts, suggesting that podocytes are possibly the main
players of albumin permselectivity in the chip as already
hypo-thesized in vivo
43. Interestingly, hiPOD chips did not exhibit a
statistically significant difference compared to chips built using
hFIB, further suggesting that the immortalized line is less
sui-table for these assays (Fig.
3
h). The lower efficiency of hiPOD
permselectivity could possibly stem from to the lower expression
of laminin or collagen-binding components like
α3, α1, and β1
integrin chains and CD151 (which associates with cell-matrix
complexes like integrins), integrin chains
β3, α5, αV that instead
mediate
fibronectin binding and are activated in progressive
CKD, as shown in our previous work
25. These alterations do not
Fig. 1 Characterization of cellular lines and description of the microfluidic chip. a–i Flow cytometry for WT1 (PE, red) in hAKPC-P (a), hiPOD (b), and hpPOD (c); for nephrin (NPHS1-FITC, green) in hAKPC-P (d), hiPOD (e), and hpPOD (f) and for CD31 (FITC, green) in hAKPC-P (g), hiPOD (h), and hpPOD (i). All three lines show almost 100% expression of podocyte markers and absence of endothelial marker confirming their podocyte phenotype. j–l Flow cytometry for WT1 (PE, red;j), for nephrin (NPHS1-FITC, green; k), and for CD31 (FITC, green; l) in hGEC show low expression (<1%) of podocyte markers and higher expression of endothelial marker confirming their endothelial phenotype. m–r Flow cytometry for WT1 (PE, red) in HuLEC (m) and hFIB (p), for nephrin (NPHS1-FITC, green) in HuLEC (n) and hFIB (q), and for CD31 (FITC, green) in HuLEC (o) and hFIB (r). HuLEC and hFIB are both negative for podocyte makers, HuLEC are positive for endothelial marker while hFIB are negative. Unstained control is shown in red while stained sample is shown in light blue.s, t The chip is a microfluidic layer sandwiched between two 175 μm glass plates (OrganoPlateTMplatform, courtesy of MIMETASTM, panels). The three-channel version of the OrganoplateTMcomprises 40 networks on one 96-well format plate.t The central section is subdivided into three channels by a system known as PhaseGuide™, a thin 30 μm tall ridge that acts as a pinning barrier for incoming fluids23. Following thefilling of channel E with collagen I, channel C (representing the vascular space) is seeded with cells and thenfilled with growth medium; the channel F (representing the urinary space) is where thefiltrate is collected. Cross-section depicts patterning of cells and collagen within the GOAC. Flow of culture medium is achieved by leveling between the media reservoirs of the lanes C and F. The platform is placed on an interval rocker, with an angle to assure leveling. By changing the angle of the platform (rocker settings: interval= 8 min, angle = 7°), the direction of fluid flow is reversedfavor proper GBM production and attachment to it
44and
pos-sibly affects their ability to assemble a strong barrier to retain
albumin. Long-term analysis of GOAC permselectivity
con-firmed the maintenance of cell viability of the GOAC as well as
efficiency of permselectivity for at least 28 days following the
hGEC seeding in both hAKPC-P
+ hGEC and hpPOD + hGEC
chips. Performance of hiPOD chips markedly decreased at
2 weeks (Fig.
3
i).
To prove GOAC permselectivity, together with the capability of
retaining albumin, we also tested its capacity of
filtering
molecules that are freely
filtered by glomerulus in vivo, such as
inulin
45. As shown in Supplementary Fig. 6a–d, the GOAC can
filter inulin, thus confirming that the GOAC is constituted by a
functional GFB that can accurately perform differential clearance
of albumin and inulin, like the in vivo GFB.
To further support the advantages of our platform in
comparison to other in vitro models and to confirm that our
GOAC replicates in bona
fide the semi-permeability of GFB, we
have generated podocyte-endothelial barriers on 24-well
trans-wells using the same protocol (including cell isolation, media, and
timing) used for our chips. As shown in Supplementary Fig. 6e,
all transwells exhibited a significant albumin leakage thus
CROSS-SECTION CROSS-SECTION CROSS-SECTION CROSS-SECTION COLLAGEN I COLLAGEN I ENDOTHELIUM ENDOTHELIUM PODOCYTE COLLAGEN I PODOCYTE ENDOTHELIUM COLLAGEN I PODOCYTE C C
a
e
i
m
E E F F C C E E F F C C E E F F C C GBM GLOMERULUS-ON-A-CHIP GLOMERULUS-ON-A-CHIP GLOMERULUS-ON-A-CHIP GLOMERULUS-ON-A-CHIP E E F F 200 180 160 140 120 100 Z ( μ m) 80 60 40 20 0 1.0 0.8 0.6 0.4 0.2 0.0 50 μm 50 μm 50 μm 50 μm 25 μm 50 μm 25 μm 50 μm 50 μm 50 μm 50 μm 25 μm 50 μm 25 μm 50 μm 50 μm 50 μm 50 μm 25 μm 50 μm 25 μm 50 μm 50 μm COLLAGEN I CHANNEL Fb
c
d
f
g
h
j
k
l
n
o
p
q
t
u
v
r
s
CHANNEL E CHANNEL C hAKPC-P hiPOD hiPOD hiPOD hiPOD hiPOD hiPOD hiPOD hpPOD hpPOD hpPOD hpPOD hpPOD hpPOD hpPOD hAKPC-P hAKPC-P hAKPC-P hAKPC-P hAKPC-P hAKPC-Pw
Humanx
y
Kidney hAKPC-P+hGEC GOAC 50 kDa 25 kDa 70 kDa 40 kDa 50 kDa COL4A3 LAMA5 Beta actin COL4A3 LAMA5 Beta actin COL4A3 LAMA5 Beta actin 25 kDa 70 kDa 40 kDa 50 kDa 25 kDa 70 kDa 40 kDahiPOD+hGEC GOAC hpPOD+hGEC GOAC
PHASEGUIDE PHASEGUIDE hGEC
WGA CD31 DAPI DAPI NPHS1 DAPI NPHS1 DAPI NPHS1 CD31 CD31 DAPI NPHS1 DAPI COL4A4 DAPI COL4A12 DAPI LAMA5 DAPI NPHS1 DAPI NPHS1 DAPI NPHS1 CD31 CD31 DAPI NPHS1 DAPI COL4A4 DAPI COL4A12 DAPI LAMA5 DAPI NPHS1 DAPI NPHS1 DAPI NPHS1 CD31 CD31 DAPI NPHS1 DAPI COL4A4 DAPI COL4A12 DAPI LAMA5 DAPI Y (nm)
Fig. 2 Seeding of endothelial cells and podocytes in OrganoplatesTMand generation of the GOAC.a Representation of seeded hGEC in OrganoplateTM.b Confocal Z-stack image showing formation of capillary-like structure. PhaseguideTMcomponents (yellow lines) can be easily identified within the panel. Channel E isfilled with collagen I (visible thanks to autofluorescence in the red channel) while channel C confirms formation of a capillary-like structure by a continuous monolayer of hGEC (stained with CD31, Alexa-555, red).c, d confocal image for CD31 (Alexa-555, red, c) and for WGA (Rhodamine, red, d) in hGEC after 28 days of culture.e Representation of seeded podocytes in OrganoplateTM.f–h Confocal image for nephrin (NPHS1-FITC, green) in hAKPC-P (f), in hihAKPC-POD (g), and hphAKPC-POD (h) seeded on the channel C after 28 days of culture. Nephrin expression is present on the level of cell–cell contact (arrow). i Representation of seeded of podocytes and hGEC in OrganoplateTM.j–l Confocal image for nephrin (NPHS1-FITC, green) and CD31 (Alexa-555, magenta) in hAKPC-P+ hGEC chip (j), in hiPOD + hGEC chip (k), and hpPOD + hGEC chip (l) after 28 days of culture. All three podocyte lines form a continuous layer, distinguishable from the hGEC layer.m Representation of a GBM-like structure in OrganoplateTM.n–v Confocal image for COL4A4 (Alexa-555, red), for COL4A12 (Alexa-555, red), and for LAMA5A (Alexa-555, red) in hAKPC-P+ hGEC chip (n–p), in hiPOD + hGEC chip (q–s), and hpPOD + hGEC chip (t–v) after 28 days of culture. hAKPC-P + hGEC chip and hpPOD + hGEC chip show de novo generation of GBM, which is less evident in the hiPOD + hGEC. Nuclei are stained with DAPI (blue). All pictures: scale bar= 50 µm; except bottom panel in f–l with scale bar = 25 µm bar. w–y Western blot analysis for COL4A3 (25 kDA, monomeric form; 50 kDA, dimeric form), LAMA5 (70 kDa), and beta actin (40 kDa) in hAKPC-P+ hGEC (w), hiPOD + hGEC (x), and hpPOD+ hGEC (y) GOAC. Positive control: human whole-kidney lysate. Western blot images were cropped to show the relevant bands and improve clarity. Uncropped and unprocessed scans for western blotting analysis are provided in Supplementary Fig. 11
CROSS-SECTION COLLAGEN I ENDOTHELIUM C C E E F F PODOCYTE 5 min
Assessment of basal permselectivity
Long term efficiency
hAKPC-P + hGEC hiPOD + hGEC hpPOD + hGEC Experimental groups Time points 7 d 14 d 21 d 28 d 25 20 15 10 5 0 ***p < 0.001 *p < 0.05 **p < 0.01 1e+6 1e+5 1e+4 1e+3 1e+2 Absorbance (Fluorescein, 0.1s) Absorbance (Fluorescein, 0.1s; e xpressed as percentage)
hAKPC-P + hGEChiPOD + hGEC hpPOD + hGEChAKPC-P + HuLEC hFIB + hGEC COL1 - no cells hAKPC-P hiPOD hpPOD No cells hFIB HuLEC
60 min 5 min 60 min
a
h
i
d
c
b
e
f
g
Fig. 3 GOAC permselectivity and long-term efficiency. a Representation of GOAC albumin permselectivity assay: albumin-FITC (40 mg/ml) is applied to channel C (yellow) andflow-through collected in channel F. Bright field showing albumin leakage (yellow) after 5 min (left columns) and 60 min (right columns) in hAKPC-P+ hGEC chip (b), in hiPOD + hGEC chip (c), in hpPOD + hGEC (d), in hAKPC-P + HuLEC chip (e); in hFIB + hGEC chip (f) and in chip with no cells but just collagen I in channel E (g). It is evident that albumin is absent only in chips generated by hAKPC-P+ hGEC chip (b), in hiPOD + hGEC chip (c), in hpPOD+ hGEC (d). Some leakage is present in hiPOD + hGEC chip (red arrow) and leakage is evident in chips with no cells (g) and in chips formed by hAKPC-P+ HuLEC (e) and in hFIB + hGEC chip (f). h Box plot graph of fluorescein absorbance (expressed as log) in filtrate after 60 min All conditions with cells were significantly different (p < 0.001) to chips without cells. hAKPC-P + hGEC and hpPOD + hGEC chips (but not hiPOD + hGEC) were statistically significantly different (p < 0.01 and p < 0.05, respectively) from chips generated using hFIB instead of podocyte lines. Number of replicates for chips used inh as follow: hAKPC-P+ hGEC chip: #12; hiPOD + hGEC chip: #6; hpPOD + hGEC chip: #7; hAKPC-P + HuLEC chip: #13; hFIB + hGEC chip: #19; no cell chip: #3. Significant differences were determined by a one-way ANOVA and Holm–Sidak post hoc test, *p < 0.05, **p < 0.01, ***p < 0.001. Box plots show the median, the 25th, and 75th percentiles, whiskers (median ± 1.5 times interquartile range), and outliers (solid circle).i Graph of fluorescein absorbance in filtrate after 60 min at 7, 14, 21, and 28 days. hAKPC-P + hGEC and hpPOD + hGEC chips maintained permselectivity efficiency at 28 days; hiPOD+ hGEC permselectivity was highly reduced at 2 weeks. Red line (corresponding to a 15% loss of efficiency in retaining albumin) represents the threshold chosen as lower acceptable performance by GOAC chips. Number of replicates for chips used ini as follow: hAKPC-P+ hGEC chip: 7d#13, 14d#10, 21d#9, 28d#4; hiPOD+ hGEC chip: 7d#10, 14d#11; hpPOD + hGEC chip: 7d#7, 14d#22, 21d#15, 28d#15
suggesting that, under the same conditions, this platform cannot
perform as efficiently as the GOAC.
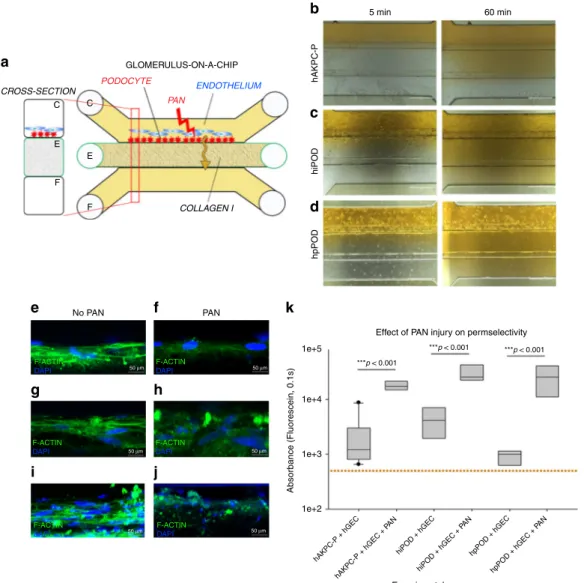
Puromycin aminonucleoside promotes albumin leakage in the
GOAC. To test the hypothesis that our GOAC can model a
kidney injury state, we exposed the GOAC to puromycin
ami-nonucleoside (PAN; Fig.
4
a), a nephrotoxic agent that alters
podocyte morphology and function
25and can induce focal
seg-mental glomerulosclerosis (FSGS) in mice
46. When added to
GOAC, PAN induced podocyte injury as documented by
cytos-keleton rearrangement and loss of permselectivity for albumin at
60 min after stimuli (Fig.
4
b–j). The levels of albumin leakage
were similar across GOAC with hAKPC-P
+ hGEC, hiPOD +
hGEC, or hpPOD
+ hGEC (Fig.
4
k). Together, these results show
that the human GOAC developed in this study mimics function
and injury manifestations of the kidney GFB.
Sera from individuals with MN shows albumin leakage in the
GOAC. To further characterize our system and determine
the capacity of GOAC to react to human samples, we tested the
response of GOAC to sera from individuals affected by MN, a
major cause of nephrotic syndrome (proteinuria with associated
hAKPC-P hiPOD hpPOD 5 min 60 min ***p < 0.001 ***p < 0.001 ***p < 0.001 hAKPC-P + hGEC hAKPC-P + hGEC + P AN hiPOD + hGEC hiPOD + hGEC + P AN hpPOD + hGEC hpPOD + hGEC + P AN Experimental groups
Effect of PAN injury on permselectivity No PAN
a
b
c
d
k
e
g
h
i
j
f
50 μm PAN CROSS-SECTION GLOMERULUS-ON-A-CHIP ENDOTHELIUM PAN COLLAGEN I PODOCYTE C C E E F F 1e+5 1e+4 1e+3 1e+2 Absorbance (Fluorescein, 0.1s) F-ACTIN DAPI 50 μm F-ACTIN DAPI F-ACTIN DAPI F-ACTIN DAPI 50 μm F-ACTIN DAPI 50 μm 50 μm F-ACTINDAPI 50 μmFig. 4 GOAC and puromycin aminonucleoside (PAN) injury. a Representation of GOAC albumin permselectivity assay following PAN injury: PAN (5-day induction, 10 mg/ml) is applied to channel C followed by albumin-FITC (40 mg/ml, yellow) andflow-through collected in channel F. b–d Bright field showing albumin leakage (yellow) after 5 min (left columns) and 60 min (right columns) in hAKPC-P+ hGEC chip (b), in hiPOD + hGEC chip (c), in hpPOD+ hGEC (d) after PAN injury. Marked albumin leakage occurs following podocyte injury. e–j Damage to podocytes was assessed by F-actin staining in hAKPC-P+ hGEC chip before (e) and after PAN damage (f), in hiPOD + hGEC chip before (g) and after PAN damage (h), and in hpPOD + hGEC before (i) and after PAN damage (j) confirming widespread disruption of the cytoskeleton. Nuclei are stained with DAPI (blue); actin filaments stained with phalloidin (green). All pictures: scale bar= 50 µm; k box plot graph of fluorescein absorbance (expressed as log) in filtrate collected after 60 min after 5 days exposure to PAN. For all experimental groups, a marked and statistically significant increase was found in albumin permeability following injury. Number of replicates for chips used ink is as follows: hAKPC-P+ hGEC chip: #12 and #4; hiPOD + hGEC chip: #6 and #4; hpPOD + hGEC chip: #7 and #3. Significant differences were determined by a one-way ANOVA and Holm–Sidak post hoc test, *p < 0.05, **p < 0.01, ***p < 0.001. [To improve clarity, the following significant differences were not drawn in the graph: hiPOD + hGEC + PAN vs. hAKPC-P + hGEC p < 0.001; hiPOD + hGEC + PAN vs. hpPOD + hGEC p < 0.001; hpPOD + hGEC + PAN vs. hAKPC-P + hGEC p < 0.001; hpPOD + hGEC + PAN vs. hiPOD + hGEC p < 0.001; hAKPC-P + hGEC + PAN vs. hpPOD+ hGEC p < 0.001; hAKPC-P + hGEC + PAN vs. hiPOD + hGEC p < 0.05; hiPOD + hGEC + PAN vs. hAKPC-P + hGEC + PAN p < 0.05.] Box plots show the median, the 25th and 75th percentiles, whiskers (median ± 1.5 times interquartile range), and outliers (solid circle)
peripheral edema and lipid abnormalities, among other
abnormalities) in adults
47. MN is initiated by the deposition of
circulating anti-podocyte autoantibodies in the subepithelial
space of the GFB, inducing complement-mediated podocyte
injury and proteinuria
48.
First, we tested the ability of IgG to cross the glomerular
endothelial cell monolayer on which hGEC were allowed to grow
to confluency and form a continuous layer. We confirmed that
FITC-IgG added to the top chamber could be detected on the
lower chamber after approximately 6 h, thus confirming the
ability of hGEC to allow passage of IgG (Supplementary Fig. 7a),
a process also confirmed in vivo
49,50.
After 24 h of exposure to medium containing 0.5% of serum
from MN patients or healthy controls (Fig.
5
a), the chips with
MN serum, but not control sera, showed total IgG
(Supplemen-tary Fig. 7b–g) and IgG4 (Supplemen(Supplemen-tary Fig. 7h–m) deposition
on the podocytes, recapitulating the main features of MN
nephropathy
51. While chips generated from all podocyte types
showed an increase in albumin leakage (Fig.
5
b–j), only hAKPC-P
(Fig.
5
h) and hpPOD (Fig.
5
i) chips confirmed a statistically
CROSS-SECTION ENDOTHELIUM MN SERUM COLLAGEN I PODOCYTE C C E E F F 5 min 60 min hAKPC-P 5 min 60 min hiPOD 5 min 60 min hpPOD Control ser um MN ser um Control ser um MN ser um Control ser um MN ser um 6e+4 5e+4 4e+4 3e+4 2e+4 1e+4 0 Absorbance (Fluorescein, 0.1s) 1e+5 1.2e+5 1.0e+5 8.0e+4 6.0e+4 4.0e+4 2.0e+4 0.0 CTRL1 CTRL2 MN1 MN2 MN3 MN4 MN5 MN6 CTRL1 CTRL2 MN1 MN2 MN3 MN4 MN5 MN6 CTRL1 CTRL2 MN1 MN2 MN3 MN4 MN5 MN6 8e+4 6e+4 4e+4 2e+4 0 Absorbance (Fluorescein, 0.1s) Experimental groups Experimental groups Experimental groups
No statistically significant difference between groups
a
h
i
j
b
c
d
e
f
g
significant loss of permselectivity following exposure to MN
serum while hiPOD (Fig.
5
j) failed to respond properly.
We next measured the relationship between the extent of
albumin leakage (proteinuria) in our chips (measured as
FITC-absorbance in the
filtrate collected in channel F) with proteinuria
measured in the same patients (Fig.
6
) and anti-PLA
2R
(Phospholipase A2 receptor) titer (Supplementary Fig. 7n–p) by
linear regression analysis. We found that proteinuria highly
correlated with the diagnostic results obtained in our chips
generated using hAKPC-P (R
= 0.8901, p < 0.01, Fig.
6
b) and
primary podocytes (R
= 0.7995, p < 0.05, Fig.
6
d) with a
confidence of at least 95%. This correlation was not statistically
significant in the chip generated with hiPOD (R = 0.3155, p = n.s.,
Fig.
6
c). The same results were obtained when performing the
same analysis with anti-PLA
2R antibody titer from MN patients,
confirming high correlation for hAKPC-P and hpPOD chips but
not hiPOD chips (Supplementary Fig. 7n–p).
Modeling mechanism of MN injury in podocyte in the GOAC.
We then tested whether the GOAC could be used to perform
cell-based investigations to delineate mechanisms responsible for
podocyte damage and disruption of the
filtration barrier. PLA
2R
is the major podocyte target antigen in MN patients
52,53along
with less common ones like, for example, THSD7A and NEP1
(refs.
52,53). We confirmed that hAKPC-P, hiPOD, and hpPOD
express PLA
2R both before and after seeding on the chip
(Sup-plementary Fig. 7q–v). However, when western blotting analysis
was performed to quantify PLA
2R expression, we found that
hiPOD exhibit the lowest expression of PLA
2R (significantly
different when compared to hpPOD or hAKPC-P, p < 0.05). A
lower expression of antigen by hiPOD (Supplementary Fig. 7w, x)
might explain their limited response to MN.
In MN, following autoantibody binding, several mechanisms
are triggered in podocytes, like the complement signaling
54that
can lead to delocalization of nephrin with loss of the slit
diaphragm structure and podocyte injury
55. Indeed, following
exposure to MN serum, we confirmed an increase in the
expression of C3d protein in the three podocyte lines that,
although not significant, suggests an activation of the
comple-ment pathway consistent with the in vivo cascade signaling
54,56(Fig.
6
e, f). Complement activation was paralleled by a decrease in
nephrin compared to cells cultured with control (healthy) serum
(Fig.
6
g, h, Supplementary Fig. 8a–f). To further characterize
cellular response to MN serum we evaluated SNAIL expression
and confirmed its increase in the nuclear region following MN
exposure for 24 h (Supplementary Fig. 8g–l). Interestingly,
increase in SNAIL appears to be much more marked in
hAKPC-P compared to hiPOD, and could possibly explain the
lower proteinuria levels detected in the hiPOD chips (Fig.
5
g,
Supplementary Fig. 8i, j). These data, taken together, suggest that
within the chip it is possible to explore disease mechanisms and
cascade signaling. Nonetheless, to fully characterize the disease
mechanism and cascade signaling in MN-mediated injury, further
investigation is needed (including inclusion of different time
points and pathways) and goes beyond the scope of the
current work.
While the podocyte is the initial target of autoantibodies in
MN, endothelial cells in the glomeruli of affected patients also
show signs of injury
57. To test whether the same occurs in GOAC
exposed to MN serum, we measured WGA expression in
endothelial cells and found that the expression declined at 24 h
after exposure, a phenomenon that did not occur in the presence
of control sera (Supplementary Fig. 9). Altogether, these data
validate our system as a feasible model to study MN
pathophysiology in vitro.
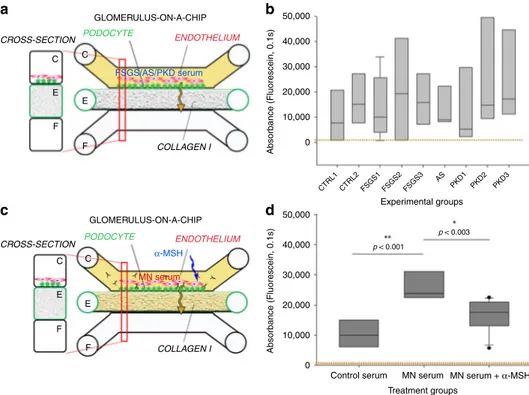
GOAC response speci
ficity to sera from various CKD. To
exclude that albumin leakage induced in GOAC by MN serum
was due to an unselective response to serum from subjects
affected by CKD, we exposed the chip to sera from individuals
with AS, polycystic kidney disease (PKD), or FSGS. Both AS and
PKD are due to a primary renal defect and circulating factors in
the serum are not thought to play a role in disease pathogenesis.
While putative circulating factors have been described in FSGS,
the sera included in the experiments were obtained from
indivi-duals with diseases remission; therefore, these factors (if present)
were not enough to induce proteinuria in vivo. As shown in
Fig.
7
a, b, we found that serum from FSGS, AS, or PKD subjects
did not trigger loss of permselectivity in our experimental
set-tings, further confirming specificity of albumin leakage induced
by MN sera.
Modeling response to therapy in the GOAC exposed to MN
sera. Building upon the previous results, we tested the hypothesis
that GOAC represents a unique platform for screening drugs
targeting the GFB. We exposed the GOAC to MN serum for 24 h
in the presence or absence of
α-melanocortin stimulating
hor-mone (α-MSH). This horhor-mone mimics the activity of the
adre-nocorticoid hormone (ACTH), clinically used in MN patients to
reduce proteinuria
58.
α-MSH main mechanism of action is
through inhibition of RhoA inhibitor p190RhoGAP activity,
which is crucial for the stabilization of podocyte stress
fibers
59.
We found that, similarly to data obtained in vivo using ACTH
60,
Fig. 5 Evaluation of permselectivity using human membranous nephropathy serum samples. a Representation of the GOAC albumin permselectivity assay to MN serum exposure. Following a 24 h incubation with media supplemented with 0.5% serum from healthy individuals (CTRL1 and CTRL2) or MN patients (MN1–6), albumin-FITC is applied to channel C (yellow) and flow-through collected in channel F. b–g Bright field showing albumin leakage after 5 min (left columns) and 60 min (right columns) after exposure to healthy and MN patients serum in hAKPC-P+ hGEC (b, c), hiPOD + hGEC (d, e), and hpPOD+ hGEC (f, g) chips. Leakage is evident in hAKPC-P + hGEC and hpPOD + hGEC but not in hiPOD + hGEC chips after exposure to MN serum. h–j Box plot graph offluorescein absorbance (expressed as log) in filtrate collected after 60 min after serum exposure in hAKPC-P + hGEC (h), hiPOD + hGEC (i), and hpPOD+ hGEC (j) chips. Statistically significant increase in albumin permeability is evident after exposure to MN sera only in hAKPC-P + hGEC and hpPOD+ hGEC chips. Number of replicates for chips used in h is as follows: hAKPC-P + hGEC chip and CTRL1: #7; hAKPC-P + hGEC chip and CTRL2: #8; hAKPC-P+ hGEC chip and MN1: #4 ; hAKPC-P + hGEC chip and MN2: #7; hAKPC-P + hGEC chip and MN3: #3. hAKPC-P + hGEC chip and MN4: #4; hAKPC-P+ hGEC chip and MN5: #7; hAKPC-P + hGEC chip and MN6: #3. Number of replicates for chips used in i as follow: hiPOD + hGEC chip and CTRL1: #6; hiPOD+ hGEC chip and CTRL2: #4; hiPOD + hGEC chip and MN1: #11; hiPOD + hGEC chip and MN2: #5; hiPOD + hGEC chip and MN3: #4; hiPOD+ hGEC chip and MN4: #11; hiPOD + hGEC chip and MN5: #5; hiPOD + hGEC chip and MN6: #4. Number of replicates for chips used in j is as follows: hpPOD+ hGEC chip and CTRL1: #8; hpPOD + hGEC chip and CTRL2: #9; hpPOD + hGEC chip and MN1: #6; hpPOD + hGEC chip and MN2: #7; hpPOD+ hGEC chip and MN3: #7; hpPOD + hGEC chip and MN4: #6; hpPOD + hGEC chip and MN5: #7; hpPOD + hGEC chip and MN6: #7. For d, g, j significant differences were determined by a one-way ANOVA and Holm–Sidak post hoc test, *p < 0.05, **p < 0.01, ***p < 0.001 Box plots show the median, the 25th and 75th percentiles, whiskers (median ± 1.5 times interquartile range), and outliers (solid circle)α-MSH prevented proteinuria elicited by MN serum (Fig.
7
c, d)
indicating that it acts downstream the formation of immune
complexes on podocytes. These data demonstrate that GOAC
responds to human nephrotoxic serum and nephroprotective
treatment similarly to the in vivo human glomeruli.
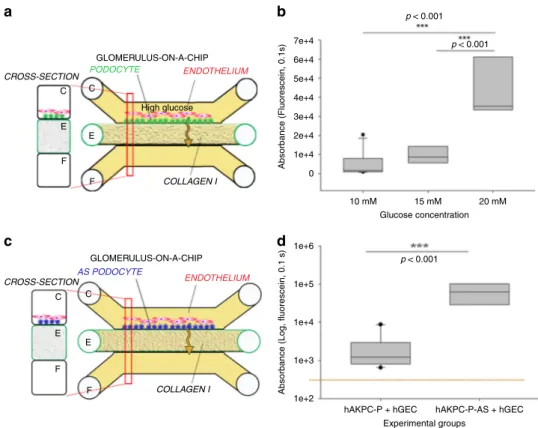
Establishing a model of diabetic nephropathy in the GOAC.
Hyperglycemia is recognized as a key initiation factor of ESRD in
diabetic patients, which contributes to the increased albumin
leakage across the GFB
61. High glucose has been shown in vitro to
lead to podocyte damage
62,63. To test whether our system could
replicate glucose-induced damage, we exposed GOAC to medium
containing 10, 15, or 20 mM glucose and assessed its effect on
permselectivity. After 72 h, the chips presented with a significant
loss of albumin permselectivity compared to the control group
(10 mM) or 15 mM (Fig.
8
a, b).
Primary podocyte mutations promote albumin leakage in
GOAC. To test disease-modeling applications, we generated a
GOAC using hAKPC-P derived from a patient affected by AS
SampleCorrelation
GOAC proteinuria/clinical proteinuria CTRL1 M M M M F F F F 30 41 47 70 30 73 32 43 0 0 13.4 1.2 0.8 0.9 0.67 0.97 0.77 0.76 0.53 8.6 6.51 4 2.4 3.6 CTRL1 CTRL1 CTRL1 CTRL2 CTRL2 CTRL2 CTRL2 MN1 MN1 MN1 MN1 MN2 MN2 MN2 MN2 R = 0.8901 p < 0.01 R = 0.3155 p = 0.4565 MN3 MN3 MN3 MN3 MN4 MN4 MN4 MN4 MN5 MN5 MN5 MN5 MN6 x (Absorbance) vs y (Proteinuria) Absorbance vs Proteinuria 95% Prediction band
Absorbance vs proteinuria - hAKPC-P
Absorbance vs proteinuria - hiPOD
hiPOD hpPOD hAKPC-P
CTRL MN CTRL MN CTRL MN
Absorbance vs proteinuria - hpPOD
95% Confidence band
MN6
MN6
MN6
Sex Age Proteinuria (g/24 h) Creatinine (mg/dl)
25 0.5 0.4 0.3 0.2 0.1 0.0 140 kDa 40 kDa C3d Beta actin hiPOD hpPOD hAKPC-P CTRL MN CTRL MN CTRL MN 138 kDa 40 kDa Nphs1 Beta actin 1.3 1.2 1.1 1.0 0.9 Pix el density Pix el density 0.8 0.7 0.6 0.5 20 15 10 Protein u ri a 5 –5 –10 –15 10,000 20,000 30,000 40,000 0 25 20 15 10 Protein ur ia 5 –5 –10 –15 15,000 20,000 25,000 30,000 0 25 20 15 10 Protein ur ia 5 –5 –10 –15 20,000 0 40,000 60,000 80,000 0 Absorbance (Fluorescein, 0.1s) Absorbance (Fluorescein, 0.1s) R = 0.7995 p < 0.05 hAKPC-P + CTRL ser um hAKPC-P + MN ser um hiPOD + MN ser um hpPOD + CTRL ser um hiPOD + CTRL ser um hpPOD + MN ser um hAKPC-P + CTRL ser um hAKPC-P + MN ser um hiPOD + MN ser um hpPOD + CTRL ser um hiPOD + CTRL ser um hpPOD + MN ser um
a
b
e
c
f
g
d
h
(AS-hAKPC-P). In AS, a mutation on COL4α3α4α5 genes leads to
deposition of a defective GBM, leading to CKD and ESRD
26. As
predicted, chips generated using AS-hAKPC-P exhibited a marked
and statistically significant albumin leakage (Fig.
8
c, d), while chips
with podocytes from control individuals did not. Overall, these data
document that GOAC may be used to model in vitro abnormalities
in the GFB due to genetic abnormalities in podocytes.
Discussion
Our data show that we can combine human podocytes and
glo-merular endothelial cells with the MIMETAS
TMtechnology to
create a functional GFB in vitro. These cells co-cultured in our
GOAC maintain their phenotype and function for at least a
month, allowing for long-term experiments. Compared to other
proposed glomerular chips
20–22, our system presents important
Fig. 6 Correlation of GOAC proteinuria with clinical data and MN mechanism modeling on the chip. a Table of clinical parameters for proteinuria in MN serum samples used on the GOAC.b hAKPC-P+ hGEC chip proteinuria for CTRL1-2 and MN1–6 clinical proteinuria levels suggests a very strong correlation between clinical profile and response in the chip (measured as albumin leakage). R: 0.8901, P < 0.01. c hiPOD + hGEC chip proteinuria for CTRL1–2 and MN1–6 clinical proteinuria levels suggests a weak correlation between clinical profile and response in the chip (measured as albumin leakage).R: 0.3156, not significant. d hpPOD + hGEC chip proteinuria for CTRL1–2 and MN1–6 clinical proteinuria levels suggests a strong correlation between clinical profile and response in the chip (measured as albumin leakage). R: 0.7995, p < 0.05. For all samples, regression analysis was performed. Equation: Polynomial, linear. Blue lines= 95% confidence band; red lines = 95% prediction band. e, f Western blot analysis for C3d (140kDA) and beta actin (40 kDa) in hAKPC-P+ hGEC, hiPOD + hGEC, and hpPOD + hGEC chips exposed to healthy or MN serum confirmed increased expression for C3d by all three MN chips. Number of replicates per experimental group: 3 (f). Quantification of C3d expression was performed by measuring pixel density and followed by normalization against beta actin.g, h Western blot analysis for NPHS1 (138kDA) and beta actin (40 kDa) in hAKPC-P+ hGEC, hiPOD + hGEC, and hpPOD+ hGEC chips exposed to healthy or MN serum confirmed decreased expression for NPHS1 by all three MN chips. Number of replicates per experimental group: 3.h Quantification of NPHS1 expression was performed by measuring pixel density and followed by normalization against beta actin (g). For all samples lack of significant differences was determined by a one-way ANOVA and Student–Newman–Keuls post hoc test. Box plots show the median, the 25th and 75th percentiles, whiskers (median ± 1.5 times interquartile range), and outliers (solid circle). Western blot images were cropped to show the relevant bands and improve clarity. Uncropped and unprocessed scans for western blotting analysis are provided in Supplementary Figs. 13, 14
CROSS-SECTION GLOMERULUS-ON-A-CHIP FSGS/AS/PKD serum ENDOTHELIUM COLLAGEN I PODOCYTE C
a
b
d
c
C E E F F CROSS-SECTION GLOMERULUS-ON-A-CHIP 50,000 40,000 30,000 20,000 10,000 0 α-MSH ENDOTHELIUM MN serum COLLAGEN I PODOCYTE C C E E F F Absorbance (Fluorescein, 0.1s) 50,000 CTRL1Control serum MN serum MN serum + α-MSH
CTRL2 FSGS1 FSGS2 FSGS3 AS PKD1 PKD2 PKD3 40,000 30,000 20,000 10,000 0 Absorbance (Fluorescein, 0.1s) p < 0.001 p < 0.003 Experimental groups Treatment groups
Fig. 7 Validation of the hAKPC-P GOAC system as a diagnostic and drug screening platform. a Scheme of GOAC albumin permselectivity assay and exposure to serum from patients affected by FSGS, AS, and PKD. Following a 24 h incubation with media supplemented with 0.5% serum from healthy individuals (CTRL1 and CTRL2) or CKD patients, albumin-FITC is applied to channel C (yellow) andflow-through presents in channel F. b Box plot graph of fluorescein absorbance in filtrate after 60 min following 24 h incubation with serum from healthy individuals (CTRL1 and CTRL2), patients affected by FSGS (FSGS1, FSGS2, and FSGS3), AS, and PKD (PKD1, PKD2, and PKD3). As expected, no statistically significant differences were detected among groups. Number of replicates for chips used inb as follow: CTRL1: #7; CTRL2: #8; FSGS1: #9; FSGS2: #3; FSGS3: #4; AS: #4; PKD1: #5; PKD2: #5; PKD3: #5. c Scheme of GOAC albumin permselectivity assay and exposure to healthy or MN serum with or withoutα-MSH. Following a 24 h incubation with media supplemented with 0.5% serum from healthy individuals (CTRL2), MN patient (MN3) or MN patient (MN3)+ α-MSH, albumin-FITC is applied to channel C (yellow) andflow-through presents in channel F. d Box plot graph of fluorescein absorbance in filtrate after 60 min following 24 h incubation with serum from healthy individuals or MN with or without supplementation with 10 ng/ml ofα-MSH for 24 h. Quantification of proteinuria (albumin-FITC) was performed by measuring absorbance (fluorescein, 0.1 s) of flow-through for hAKPC-P + hGEC at 60 min Number of replicates for chips used in d is as follows: CTRL2: #6 : MN3: #9; MN3+ a-MSH: #11. Significant differences were determined by a one-way ANOVA and Holm–Sidak post hoc test. Box plots show the median, the 25th and 75th percentiles, whiskers (median ± 1.5 times interquartile range), and outliers (solid circle)
differences and great advantages. The use of a chip devoid of any
artificial membrane that separates layers of cells facilitates the
correct interactions and crosstalk between cells as it is occurring
in vivo. Seeded podocytes form slit diaphragm and endothelial
cells form capillary-like structures, cellular features that are
essential for a correct
filtration activity of the glomerular barrier.
We also show the formation of a correctly assembled basement
membrane containing specific glomerular extracellular proteins
(like COL4α3α4α5 and LAM5α2β1γ). We demonstrated the
resemblance of the GFB structure in vitro, thus showing that the
absence of synthetic membrane could be essential for the correct
assembly of the GFB.
Importantly, we demonstrated the
filtration of inulin and the
retention of albumin within the GOAC, thus resembling the
human GFB. This successful reconstruction of the GFB by our
chips can be explained not only by the absence of a synthetic
membrane between the cell layers and by the correct assembly
of the GBM, but also by the choice of the podocyte source.
hAKPC-P present phenotype and function very similar to
pri-mary podocytes, and most importantly they can be efficiently
differentiated in large scale without the use of any
immortali-zation or laborious protocols, as we have previously shown
25.
We also confirmed our system to be superior compared to
transwell systems built following the same protocol, thus
fur-ther highlighting the strength of our platform. Our data also
indicate that immortalized podocytes present some limitations
in studies of permselectivity in response to damage as shown in
Figs.
5
and
6
.
Of major relevance for research on glomerular diseases, we
showed that the GOAC responded to chemical injury with PAN,
glucose-induced damage, and nephrotoxic serum from MN
patients similarly to in vivo glomeruli. Upon deposition of IgG on
the podocytes, the GFB exposed to sera from MN lost
perms-electivity to albumin to an extent that was proportional to the
levels of anti-PLA
2R IgG and severity of proteinuria measured
in vivo in the same patients. Altogether, these data demonstrate
that this system represents a unique platform to study the
pathophysiology of glomerular diseases in a manner that,
differ-ently from previously proposed works, allows to study (1)
changes in 3D conformation of podocytes, endothelial cells, and
GBM; (2) abnormalities in their function; and (3) the crosstalk
among them. The ability to separately manipulate the three
ele-ments of the GFB in the GOAC offers the opportunity to test
mechanisms of glomerular diseases by selectively targeting—on a
large scale—genes or molecules in the cultured podocytes and/or
endothelial cells. The strong association between functional data
in the GOAC and in vivo renal parameters also indicates that this
system may be used as a platform to identify new biomarkers of
glomerular injury in response to various stimuli and to test
glo-merular toxicity of new compounds.
The fact that a podocyte-targeting drug like
α-MSH, clinically
used to reduce proteinuria in MN patients, prevented the
CROSS-SECTION CROSS-SECTION GLOMERULUS-ON-A-CHIP GLOMERULUS-ON-A-CHIP High glucose ENDOTHELIUM ENDOTHELIUM AS PODOCYTE COLLAGEN I COLLAGEN I PODOCYTE C C E E F F C C E E F F 7e+4 6e+4 5e+4 4e+4 3e+4 2e+4 1e+4 1e+6 1e+5
hAKPC-P + hGEC hAKPC-P-AS + hGEC 1e+4
1e+3
1e+2 0
Absorbance (Fluorescein, 0.1s)
Absorbance (Log, fluorescein, 0.1 s)
Experimental groups Glucose concentration 10 mM 15 mM 20 mM p < 0.001 p < 0.001 p < 0.001
a
b
d
c
Fig. 8 Validation of the hAKPC-P GOAC system as disease-modeling platform (221). a Scheme of GOAC albumin permselectivity assay and exposure to glucose at different concentrations (10, 15, 20 mM). Following a 72 h incubation, albumin-FITC is applied to channel C (yellow) andflow-through presents in channel F.b Box plot graph offluorescein absorbance in filtrate collected after 60 min following 72 h incubation with 10–20 mM glucose. Number of replicates for chips used inb is as follows: 10 mM: #7; 15 mM: #8; 20 mM: #9. c Scheme of GOAC albumin permselectivity assay with AS-hAKPC-P+ hGEC. Following formation of the AS podocyte-endothelial cell layer, albumin-FITC is applied to channel C (yellow) andflow-through presents in channel F. d Box plot graph offluorescein absorbance in filtrate after 60 min. Quantification of proteinuria (albumin-FITC) was performed by measuring absorbance (fluorescein, 0.1 s) of flow-through for hAKPC-P + hGEC at 60 min Number of replicates for chips used in d is as follows: hAKPC-P = hGEC: #12: AS-hAKPC-P+ hGEC: #7. Significant differences were determined by a one-way ANOVA and Holm–Sidak post hoc test. Box plots show the median, the 25th and 75th percentiles, whiskers (median ± 1.5 times interquartile range), and outliers (solid circle)
proteinuric effects of MN sera in the GOAC is indeed remarkable.
This result supports the use of our GOAC for drug screening
studies, a major unmet need for research in nephrology. Our
system, devoid of synthetic membrane but with functional GBM,
allows real doses of drugs to be tested; they can be added directly
into channel C without worries that synthetic membrane (with
pore size bigger than what is present in the in vivo GBM and lack
of the morphology represented by the curvature of the
vascu-lature
22) could improperly absorb/retain different molecules,
compromising evaluation of efficacy and toxicity of the tested
compound. Moreover, while organoids have proven to be a key
tool for understanding kidney development and for disease
modeling, their usefulness for drug screening is still unclear due
to the (1) potential incomplete differentiation of the renal
structures, (2) difficult diffusion of drugs within the 3D tissue as
well as the (3) difficult assessment of proteinuria in their system
64Our system also offers a unique prospect for disease-modifying
studies. Here, we validate the GOAC using podocytes derived
from a patient affected of AS (ref.
26, male X-linked, missense
mutation, p.Gly370Glu). We demonstrated that this
Alport-GOAC shows improper
filtration; thus, it can serve as a platform
for studies of personalized medicine. Amniotic
fluid can be
col-lected from Alport patients carrying the natural mutation, thus
accurately recapitulating the human disease. Most importantly,
the derivation of multiple cell lines from patients affected by
different mutations of the same disease guarantees representation
of disease heterogeneity in real time in a dynamic system, which
is not possible for example in mice studies. Even if iPs technology
presents this advantage too, the derivation of podocytes from iPs
requires immortalization and laborious induction protocols, while
hAKPC-P differentiation is an easy and fast process with minimal
cell manipulation
25.
We acknowledge that our system has some limitations,
including the bi-directionality of the
flow (in vivo the flow in the
vascular lumen is uni-directional with the glomerulus receiving
its blood supply from afferent arterioles before exiting into
efferent arterioles and is not recirculated), and the fact that
GOAC does not include mesangial cells, an important component
of normal glomeruli
65; future studies will focus on generating a
four lane chips, allowing culture of three different cell types.
MIMETAS has already demonstrated the feasibility of producing
functional proximal tubules
19,66using their technology so the
next step will be to combine the GOAC and the tubules to
gen-erate a functional nephron on a chip where
filtration and
reab-sorption can be evaluated at the same time. Of note, to establish
the model and generate all the data for the current manuscript we
have used about 50 plates, for a total of 2000 independent chips
analyzed. Thus, we believe that the high number of chips analyzed
allows us to interpret our data with high reproducibility. In
conclusion, our chip represents a transformative system that
mimics the human renal
filtration barrier and is an ideal tool to
study glomerular disease mechanisms and drug screening. Chips
generated with diseased podocyte lines will increase our
under-standing of the cellular and molecular mechanisms responsible
for glomerular injury and podocyte loss and will advance the
design and evaluation of therapeutics strategically targeted to the
glomerulus, thus ultimately benefiting patients affected by CKD
and renal failure.
Methods
Ethics statement and acquisition of human samples. Amnioticfluid-derived cells: Discarded samples of human amnioticfluid from male fetuses (15–20 weeks of gestation) were provided to our laboratory by Labcorp (now Integrated Geno-mics, Monrovia, CA, USA) after karyotyping analysis. The study was approved by the Children’s Hospital Los Angeles (CHLA) Institutional Review Boards and exemption was obtained since no written or verbal consent was required as samples were de-identified. Samples presented with normal karyotype and ultrasound and
were confirmed negative for infectious diseases. Samples of amniotic fluid from patients affected by AS were obtained through the Telethon Biobank (Siena, Italy) directed by Dr. Renieri and Alport hAKPC-P were derived as described below.
Primary glomerular cells: Kidneys deemed non-suitable for transplantation were used for isolation of human primary podocytes and glomerular endothelial cells. CHLA Institutional Review Boards approved tissue collection. Discarded kidneys were harvested from infant patients with a non-nephrological cause of death, and thus our isolation of primary podocytes and glomerular endothelial cells rendered functional cell types.
Immortalized podocyte lines: were kindly donated by Dr. J. Reiser (Rush University Medical Center, Chicago, IL).
Patient serum: De-identified sera from healthy subjects and from individuals with MN (n= 6), FSGS (n = 3), PKD (n = 3), and AS (n = 1) were obtained from Drs. Joaquin Manrique (Biobank Navarrabiomed, integrated in the Spanish National Biobanks Network, Complejo Hospitalario de Navarra, Pamplona, Spain) and Andrea Angeletti (S. Orsola-Malpighi Hospital, University of Bologna, Bologna, Italy). Protocols for the collection of these human samples were approved by the Institutional Review Boards of the two Institutions, and informed consent was obtained from all participants.
Cells: isolation and culture. Kidney progenitor cells derived from amnioticfluid (hAKPC) were isolated by co-expression of OB-cadherin, CD24, and podoca-lyxin25. Sorted hAKPC were expanded and differentiated into podocytes (hAKPC-P) by culturing on collagen I (Corning, c#354236)-coated plates in VRADD media: RPMI-1640 (Gibco, c#11875093) supplemented with 5% FBS (Gibco, c#26140079), 1% antibiotic (Gibco, c#15070063), 1,25(OH)2D3 [100 nM, cholecalciferol] (Sigma, c#C9756), all trans retinoic acid (ATRA) [1μM], dexamethasone [100 nM] (Sigma, c#D4902), for up to 30 days. Human immortalized podocytes (hiPOD) were cul-tured as described by Saleem et al.28. Re-differentiation of hiPOD was performed by thermoshifting to 37° for up to 15 days.
Human lungfibroblasts (hFIB) were purchased from LifeLine Cell Technology (#FC-0049) and expanded with Fibrolife Media (LifeLine Cell Technology, c# LL-0001) in tissue culture dishes for up tofive passages. Human lung endothelial cells were purchased from ATCC (HuLEC-5a, CRL-3244) and expanded with ATCC basal media (#MCDB131, supplemented with 10 ng/ml Epidermal Growth Factor, 1 µg/ml hydrocortisone,10 mM glutamine, FBS to afinal concentration of 10%) in gelatin-coated tissue culture dishes for up tofive passages.
Primary podocytes (hpPOD) and glomerular endothelial cells (hGEC) were isolated from discarded human kidney samples through mechanical and chemical digestion. Briefly, the kidneys were minced and digested in 125 U/ml collagenase I (Worthington, LS004197) in RPMI-1640 at 37 °C for 30 min andfiltered three times in 100-μm cell strainers and once on the 40-μm cell strainer (Corning, c# 352360, 352340). The glomeruli that remained on the 40-μm cell strainer were washed out with PBS and centrifuged at 1800 × g for 7 min The extracted glomeruli were thoroughly checked by light microscopy to confirm the absence of contaminants including afferent and efferent vessels and tubules. The glomerular pellet was re-suspended and plated onto a 100 cm2tissue culture dish in media
comprised of RPMI-1640, 5% FBS, and 0.2% Primocin (Invivogen, c# ant-pm-1), and left to incubate overnight at 37 °C. After 24 h the glomeruli were trypsinized (Trypsin-EDTA; Gibco, c# 25200072) using 0.25% trypsin-EDTA for 5 min to allow all the components of the glomerulus, including the hpPOD and hGEC, to separate. Cells were prepared for sorting as described under FACS andflow cytometry analysis in Methods. Once sorted, the NPHS1-FITC-positive cells (podocytes) were seeded onto collagen in VRADD medium (as described above) and cultured for no more than one passage; the CD31-647 cells (hGEC) were plated onto gelatin (Cell Biologics, c# 6950) in human endothelial cell medium (Cell Biologics, c# H1168;) and cultured for no more than 10 passages.
FACS andflow cytometry analysis. Kidney progenitor cells were isolated from human total amnioticfluid cell populations by triple staining with antibodies detecting OB-cadherin-FITC, CD24-APC and podocalyxin-PE. hpPOD and hGEC were isolated from human glomerular cell suspension by staining with respectively NPHS1-FITC and CD31-AF647 antibodies. Briefly, cells were blocked using 1× human IgG (Sigma c# I2511) for 30 min and then stained with the specified antibodies, 1μg/1 × 106cells/100 µl IgG solution unless otherwise specified on the
datasheet, for 1 h on ice. Cells were then washed twice in PBS andfiltered immediately before sorting. Cells were sorted using a FACSAria sorter. Unstained and single positive controls were used to perform area scaling, exclude auto-fluorescence, and perform fluorochrome compensation when needed. Cells were first gated based on forward and side scatters (FSC/SSC) to exclude dead cells and then gated for FSC-W/FSC-H and SSC-W/SSC-H to exclude potential duplets. Sorting gates were established based on the unstained population for each sample (Supplementary Fig. 10). Forflow cytometry analysis, cells were fixed in 4% par-aformaldehyde (Santa Cruz Biotechnology c# sc-281692) for 10 min and permea-bilized with 0.05% saponin for nuclear proteins (WT1). Cells were then blocked in 1× human IgG solution for 10 min and incubated with either antibody for WT1, nephrin, CD31, EHD3, syndecan-1, and syndecan-4. Analysis was performed on a FACScanto machine using FACSDiva software. Gating strategy was performed as described above. Histogram plots were obtained using FlowJO software.