The 2020 report of The Lancet Countdown on health and
climate change: responding to converging crises
Nick Watts, Markus Amann, Nigel Arnell, Sonja Ayeb-Karlsson, Jessica Beagley, Kristine Belesova, Maxwell Boykoff, Peter Byass, Wenjia Cai, Diarmid Campbell-Lendrum, Stuart Capstick, Jonathan Chambers, Samantha Coleman, Carole Dalin, Meaghan Daly, Niheer Dasandi,
Shouro Dasgupta, Michael Davies, Claudia Di Napoli, Paula Dominguez-Salas, Paul Drummond, Robert Dubrow, Kristie L Ebi, Matthew Eckelman, Paul Ekins, Luis E Escobar, Lucien Georgeson, Su Golder, Delia Grace, Hilary Graham, Paul Haggar, Ian Hamilton, Stella Hartinger, Jeremy Hess, Shih-Che Hsu, Nick Hughes, Slava Jankin Mikhaylov, Marcia P Jimenez, Ilan Kelman, Harry Kennard, Gregor Kiesewetter, Patrick L Kinney, Tord Kjellstrom, Dominic Kniveton, Pete Lampard, Bruno Lemke, Yang Liu, Zhao Liu, Melissa Lott, Rachel Lowe, Jaime Martinez-Urtaza, Mark Maslin, Lucy McAllister, Alice McGushin, Celia McMichael, James Milner, Maziar Moradi-Lakeh, Karyn Morrissey, Simon Munzert, Kris A Murray, Tara Neville, Maria Nilsson, Maquins Odhiambo Sewe, Tadj Oreszczyn, Matthias Otto, Fereidoon Owfi, Olivia Pearman, David Pencheon, Ruth Quinn, Mahnaz Rabbaniha, Elizabeth Robinson, Joacim Rocklöv, Marina Romanello, Jan C Semenza, Jodi Sherman, Liuhua Shi, Marco Springmann, Meisam Tabatabaei, Jonathon Taylor, Joaquin Triñanes, Joy Shumake-Guillemot, Bryan Vu, Paul Wilkinson, Matthew Winning, Peng Gong*, Hugh Montgomery*, Anthony Costello*
Executive summary
The Lancet Countdown is an international collaboration established to provide an independent, global monitoring system dedicated to tracking the emerging health profile of the changing climate.
The 2020 report presents 43 indicators across five sections: climate change impacts, exposures, and vulnerabilities; adaptation, planning, and resilience for health; mitigation actions and health co-benefits; econo-mics and finance; and public and political engagement. This report represents the findings and consensus of the 35 leading academic institutions and UN agencies that make up The Lancet Countdown, and draws on the expertise of climate scientists, geographers, engineers, experts in energy, food, and transport, economists, social, and political scientists, data scientists, public health professionals, and doctors.
The emerging health profile of the changing climate 5 years ago, countries committed to limit global warming to “well below 2°C” as part of the landmark Paris Agreement. 5 years on, global carbon dioxide (CO2)
emissions continue to rise steadily, with no convincing or sustained abatement, resulting in a rise in the global average temperature of 1·2°C. Indeed, the five hottest years on record have occurred since 2015.
The changing climate has already produced consid-erable shifts in the underlying social and environmental determinants of health at the global level. Indicators in all domains of section 1 (climate change impacts, exposures, and vulnerabilities) are worsening. Concern-ing, and often acceleratConcern-ing, trends were seen for each of the human symptoms of climate change monitored, with the 2020 indicators presenting the most worrying out-look reported since The Lancet Countdown was first established.
These effects are often unequal, disproportionately impacting populations who have contributed the least to the problem. This fact reveals a deeper question of justice, whereby climate change interacts with existing social and economic inequalities and exacerbates longstanding
trends within and between countries. An examination of the causes of climate change revealed similar issues, and many carbon-intensive practices and policies lead to poor air quality, poor food quality, and poor housing quality, which disproportionately harm the health of disadvantaged populations.
Vulnerable populations were exposed to an additional 475 million heatwave events globally in 2019, which was, in turn, reflected in excess morbidity and mortality (indicator 1.1.2). During the past 20 years, there has been a 53·7% increase in heat-related mortality in people older than 65 years, reaching a total of 296 000 deaths in 2018 (indicator 1.1.3). The high cost in terms of human lives and suffering is associated with effects on economic output, with 302 billion h of potential labour capacity lost in 2019 (indicator 1.1.4). India and Indonesia were among the worst affected countries, seeing losses of potential labour capacity equivalent to 4–6% of their annual gross domestic product (indicator 4.1.3). In Europe in 2018, the monetised cost of heat-related mortality was equivalent to 1·2% of regional gross national income, or the average income of 11 million European citizens (indicator 4.1.2).
Turning to extremes of weather, advancements in climate science allow for greater accuracy and certainty in attribution; studies from 2015 to 2020 have shown the fingerprints of climate change in 76 floods, droughts, storms, and temperature anomalies (indicator 1.2.3). Furthermore, there was an increase in the number of days people were exposed to a very high or extremely high risk of wildfire between 2001–04 and 2016–19 in 114 countries (indicator 1.2.1). Correspondingly, 67% of global cities surveyed expected climate change to seriously compromise their public health assets and infrastructure (indicator 2.1.3).
The changing climate has downstream effects, impacting broader environmental systems, which in turn harm human health. Global food security is threatened by rising temperatures and increases in the frequency of extreme events; global yield potential for major crops declined by 1·8–5·6% between 1981 and 2019 (indicator 1.4.1). The climate suitability for infectious
*Co-chairs
Institute for Global Health (N Watts MA, J Beagley BA, S Coleman MSE, Prof I Kelman PhD, A McGushin MSc,
M Romanello PhD), Office of the Vice Provost for Research (Prof A Costello FmedSci), Energy Institute (S-C Hsu MSc, I Hamilton PhD, H Kennard PhD, Prof T Oreszczyn PhD), Institute for Sustainable Resources (C Dalin PhD, P Drummond MSc, Prof P Ekins PhD, N Hughes PhD, M Winning PhD), Institute for Environmental Design and Engineering
(Prof M Davies PhD), Department of Geography (Prof M Maslin PhD), and Institute for Human Health and Performance (Prof H Montgomery MD), University College London, London, UK; Air Quality and Greenhouse Gases Program, International Institute for Applied Systems Analysis, Laxenburg, Austria (M Amann PhD, G Kiesewetter PhD); Department of Meteorology (Prof N W Arnell PhD) and School of Agriculture, Policy, and Development (C Di Napoli PhD, Prof E Robinson PhD), University of Reading, Reading, UK; Institute for Environment and Human Security, United Nations University, Bonn, Germany (S Ayeb-Karlsson PhD); Centre on Climate Change and Planetary Health
(K Belesova PhD), Department of Population Health (P Dominguez-Salas PhD), Centre for Mathematical Modelling of Infectious Diseases (R Lowe PhD), and
1 5 10 15 20 25 30 35 40 45 50 55
Department of Public Health, Environments, and Society (J Milner PhD, Prof P Wilkinson FRCP), London School of Hygiene & Tropical Medicine, London, UK; Environmental Studies Program, University of Colorado Boulder, Boulder, CO, USA (Prof M Boykoff PhD, O Pearman MEM); Department of Epidemiology and Global Health (Prof P Byass PhD, Prof M Nilsson PhD) and Department of Public Health and Clinical Medicine (M O Sewe PhD, Prof J Rocklöv PhD), Umeå University, Umeå, Sweden; Department of Earth System Science, Tsinghua University, Beijing, China (W Cai PhD, Prof P Gong PhD, Z Liu PhD); Environment, Climate Change and Health Department, World Health Organization, Geneva, Switzerland (D Campbell-Lendrum DPhil, T Neville MSc); School of Psychology, Cardiff University, Cardiff, UK (S Capstick PhD, P Haggar PhD); Institute for Environmental Sciences, University of Geneva, Geneva, Switzerland (J Chambers PhD); Department of Environmental Studies, University of New England, Biddeford, ME, USA (M Daly PhD); School of Government, University of Birmingham, Birmingham, UK (N Dasandi PhD); Centro Euro-Mediterraneo sui Cambiamenti Climatici, Venice, Italy (S Dasgupta PhD); Yale Center on Climate Change and Health (Prof R Dubrow PhD) and Department of Anesthesiology (J Sherman MD), Yale University, New Haven, CT, USA; Department of Global Health (Prof K L Ebi PhD) and Center for Health and the Global Environment (J Hess MD), University of Washington, Seattle, WA, USA; Department of Civil & Environmental Engineering, Northeastern University, Boston, MA, USA (M Eckelman PhD); Department of Fish and Wildlife Conservation, Virginia Polytechnic Institute and State University, Blacksburg, VA, USA (L E Escobar PhD); Oxford Martin School, University of Oxford, Oxford, UK (L Georgeson PhD, M Springmann PhD); Department of Health Sciences,
disease transmission has been growing rapidly since the 1950s, with a 15·0% increase for dengue caused by Aedes
albopictus in 2018, and regional increases for malaria and Vibrio bacteria (indicator 1.3.1). Projecting forward, based
on current populations, between 145 million people and 565 million people face potential inundation from rising sea levels (indicator 1.5).
Despite these clear and escalating signs, the global response to climate change has been muted and national efforts continue to fall short of the commitments made in the Paris Agreement. The carbon intensity of the global energy system has remained almost flat for 30 years, with global coal use increasing by 74% during this time (indicators 3.1.1 and 3.1.2). The reduction in global coal use that had been observed since 2013 has now reversed for the past 2 consecutive years: coal use rose by 1·7% from 2016 to 2018. The health burden is substantial— more than 1 million deaths occur every year as a result of air pollution from coal-fired power, and some 390 000 of these deaths were a result of particulate pollution in 2018 (indicator 3.3). The response in the food and agri-cultural sector has been similarly concerning. Emissions from livestock grew by 16% from 2000 to 2017, with 93% of emissions coming from ruminant animals (indicator 3.5.1). Likewise, increasingly unhealthy diets are becoming more common worldwide, with excess red meat consumption contributing to some 990 000 deaths in 2017 (indicator 3.5.2). 5 years on from when countries reached an agreement in Paris, a concerning number of indicators are showing an early, but sustained, reversal of previously positive trends identified in past reports (indicators 1.3.2, 3.1.2, and 4.2.3).
A growing response from health professionals
Despite little economy-wide improvement, relative gains have been made in several key sectors: from 2010 to 2017, the average annual growth rate in renewable energy capacity was 21%, and low-carbon electricity was respon-sible for 28% of capacity in China in 2017 (indicator 3.1.3). However, the indicators presented in the 2020 report of The Lancet Countdown suggest that some of the most considerable progress was seen in the growing momentum of the health profession’s engagement with climate change globally. Doctors, nurses, and the broader profession have a central role in health system adaptation and mitigation, in understanding and maximising the health benefits of any intervention, and in communicating the need for an accelerated response.
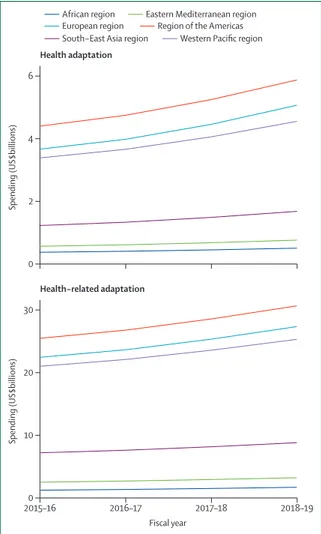
In the case of adaptation in national health systems, this change is underway. Impressively, health services in 86 countries are now connected with their equivalent meteorological services to assist in health adaptation planning (indicator 2.2). At least 51 countries have developed plans for national health adaptation, and global spending in health adaptation rose to 5·3% of all adapta-tion spending in 2018–19, reaching US$18·4 billion in 2019 (indicators 2.1.1 and 2.4).
The health-care sector, which was responsible for 4·6% of global greenhouse gas emissions in 2017, is taking early but important steps to reduce its own emissions (indicator 3.6). In the UK, the National Health Service has declared an ambition to deliver a net-zero health service as soon as possible, building on a decade of impressive progress in reducing delivery of care emissions by 57% since 1990, and by 22% when considering the service’s supply chain and broader responsibilities. Elsewhere, the Western Australian Department of Health used its 2016
Public Health Act to conduct Australia’s first climate and
health inquiry, and the German Federal Ministry of Health has established a dedicated department on health protection and sustainability responsible for climate-related matters. This progress is becoming more evenly distributed around the world, with 73% of countries making explicit references to health and wellbeing in their Nationally Determined Contributions under the Paris Agreement, and 100% of countries in the South-East Asia and South-Eastern Mediterranean regions doing so (indicator 5.4). Similarly, least-developed countries and small island developing states are providing increasing global leadership within the UN General Debate on the connections between health and climate change (indicator 5.4).
Individual health professionals and their associations are also responding well, with health institutions committing to divest more than $42 billion worth of assets from fossil fuels (indicator 4.2.4). In academia, the publication of original research on health and climate changed has increased by a factor of eight from 2007 to 2019 (indicator 5.3).
These shifts are being translated into the broader public discourse. From 2018 to 2019, the coverage of health and climate change in the media increased by 96% worldwide, outpacing the increased coverage of climate change overall, and reaching the highest observed point to date (indicator 5.1). Just as it did with advancements in sanitation and hygiene and with tobacco control, growing and sustained engagement from the health profession during the past 5 years is now beginning to fill a crucial gap in the global response to climate change.
The next 5 years: a joint response to two public health crises
Dec 12, 2020, will mark the anniversary of the 2015 Paris Agreement, with countries set to update their national commitments and review these commitments every 5 years. These next 5 years will be pivotal. To reach the 1·5°C target and limit temperature rise to “well below 2°C”, the 56 gigatonnes of CO2 equivalent (GtCO2e)
currently emitted annually will need to drop to 25 GtCO2e
within only 10 years (by 2030). In effect, this decrease will require a 7·6% reduction every year, representing an increase in current levels of national government ambition of a factor of five. Without further intervention during the next 5 years, the reductions required to
1 5 10 15 20 25 30 35 40 45 50 55
University of York, York, UK (S Golder PhD,
Prof H Graham PhD, P Lampard PhD); CGIAR Research Program on Agriculture for Human Nutrition and Health, International Livestock Research Institute, Nairobi, Kenya (D Grace PhD); School of Public Health and Administration, Universidad Peruana Cayetano Heredia, Lima, Peru (S Hartinger PhD); Department of Epidemiology, Harvard TH Chan School of Public Health, Harvard University, Boston, MA, USA (M P Jimenez PhD); Department of Environmental Health, Boston University, Boston, MA, USA (Prof P L Kinney ScD); Health and Environment International Trust, Nelson, New Zealand
(Prof T Kjellstrom PhD); School of Global Studies, University of Sussex, Falmer, UK (Prof D Kniveton PhD); School of Health (B Lemke PhD) and Department of Arts, Media and Digital Technologies (M Otto MEng), Nelson Marlborough Institute of Technology, Nelson, New Zealand; Gangarosa Department of Environmental Health (L Shi ScD), Rollins School of Public Health, Emory University, Atlanta, GA, USA (Prof Y Liu PhD, B Vu MSPH); Center on Global Energy Policy, Columbia University, New York, NY, USA (M Lott PhD); Department of Genetics and Microbiology, Universitat Autònoma de Barcelona, Barcelona, Spain (Prof J Martinez-Urtaza PhD); Center for Energy Markets, Technical University of Munich, Munich, Germany
(L McAllister PhD); Data Science Lab, Hertie School, Berlin, Germany
(Prof S Jankin Mikhaylov PhD, Prof S Munzert PhD); School of Geography, University of Melbourne, Melbourne, VIC, Australia (C McMichael PhD); Preventive Medicine and Public Health Research Center, Psychosocial Health Research Institute, Iran University of Medical Sciences, Tehran, Iran (Prof M Moradi-Lakeh MD); European Centre for Environment and Human Health (K Morrissey PhD) and Medical and Health School (Prof D Pencheon MSc),
achieve this target increase to 15·4% every year, moving the 1·5°C target out of reach.
The need for accelerated efforts to tackle climate change during the next 5 years will be contextualised by the impacts of, and the global response to, the COVID-19 pandemic. With the loss of life from the pandemic and from climate change measured in the hundreds of thousands, the potential economic costs measured in the trillions, and the broader consequences expected to continue for years to come, the measures taken to address both of these public health crises must be carefully examined and closely linked. Health professionals are well placed to act as a bridge between the two issues, and analogically considering the clinical approach to managing a patient with COVID-19 might be useful in understanding the ways in which these two public health crises should be jointly addressed.
First, in an acute setting, a high priority is placed on rapidly diagnosing and comprehensively assessing the situation. Likewise, further work is required to understand the problem, including: which populations are vulnerable to both the pandemic and to climate change; how global and national economies have reacted and adapted, and the health and environmental consequences of these actions; and which aspects of these shifts should be retained to support longer term, sustainable development. Second, appropriate resuscita tion and treatment options are reviewed and administered, with careful consideration of any potential side-effects, the goals of care, and the life-long health of the patient. Economic recovery packages that prioritise outdated forms of energy and transport that are fossil fuel intensive will have unintended side-effects, unnecessarily adding to the 7 million people that die every year from air pollution. Instead, investments in health imperatives, such as renewable energy and clean air, active travel infrastructure and physical activity, and resilient and climate-smart health care, will ultimately be more effective than these outdated methods.
Finally, attention turns to secondary prevention and long-term recovery, seeking to minimise the permanent effects of the disease and prevent recurrence. Many of the steps taken to prepare for unexpected shocks, such as a pandemic, are similar to those required to adapt to the extremes of weather and new threats expected from climate change. These steps include the need to identify vulnerable populations, assess the capacity of public health systems, develop and invest in preparedness measures, and emphasise community resilience and equity. Indeed, without considering the current and future impacts of climate change, efforts to prepare for future pandemics are likely to be undermined.
At every step and in both cases, acting with a level of urgency proportionate to the scale of the threat, adhering to the best available science, and practising clear and consistent communications, are paramount. The conse-quences of the pandemic will contextualise the economic, social, and environmental policies of govern ments during
the next 5 years, a period that is crucial in determining whether temperatures will remain “well below 2°C”. Unless the global COVID-19 recovery is aligned with the response to climate change, the world will fail to meet the target laid out in the Paris Agreement, damaging public health in the short term and long term.
Introduction
The world has already warmed by more than 1·2°C compared with preindustrial levels, resulting in profound, immediate, and rapidly worsening health effects, and moving dangerously close to the agreed limit of main-taining temperatures “well below 2°C”.1–4 These health
impacts are seen on every continent, with the ongoing spread of dengue virus across South America, the cardiovascular and respiratory effects of record heatwaves and wildfires in Australia, western North America, and western Europe, and the undernutrition and mental health effects of floods and droughts in China, Bangladesh, Ethiopia, and South Africa.5–8 In the long term, climate
change threatens the very foundations of human health and wellbeing, with the Global Risks Report9 registering
climate change as one of the five most damaging or probable global risks every year for the past decade.
It is clear that human and environmental systems are inextricably linked, and that any response to climate change must harness, rather than damage, these con-nections.10 Indeed, a response commensurate to the size
of the challenge, which prioritises strengthening health-care systems, invests in local communities, and ensures clean air, safe drinking water, and nourishing food, will provide the foundations for future generations to not only survive, but to thrive.11 Evidence suggests that being more
ambitious than current climate policies by limiting warming to 1·5°C by 2100 would generate a net global benefit of US$264–610 trillion.12 The economic case of
expanding ambition is further strengthened when the benefits of a healthier workforce and reduced health-care costs are considered.13–15
The present day effects of climate change will continue to worsen without meaningful intervention. These tangible, if less visible, impacts on public health have so far resulted in a delayed and inadequate policy response. By contrast, and on a considerably shorter timescale, COVID-19, the disease caused by severe acute respi-ratory syndrome coronavirus 2, has rapidly developed into a global public health emergency. Since COVID-19 was first detected in December, 2019, the loss of life and livelihoods has occurred with staggering speed. However, as for climate change, much of the impact is expected to unfold over the coming months and years, and is likely to disproportionately affect vulnerable populations as both the direct effects of the virus, and the indirect effects of the response to the virus, are felt throughout the world. Several lessons and parallels between climate change and COVID-19 are discussed in panel 1, focusing on the response to, and the recovery from, the two health crises.
1 5 10 15 20 25 30 35 40 45 50 55
University of Exeter, Exeter, UK; Medical Research Council Centre for Global Infectious Disease Analysis, Department of Infectious Disease Epidemiology, Imperial College London, London, UK (K A Murray PhD); Medical Research Council Unit The Gambia at London School of Hygiene & Tropical Medicine, Bakau, The Gambia (K A Murray); Iranian Fisheries Science Research Institute, Agricultural Research, Education, and Extension Organisation, Tehran, Iran (F Owfi PhD, M Rabbaniha PhD); Department of Civil and Structural Engineering, University of Sheffield, Sheffield, UK (R Quinn PhD); Scientific Assessment Section, European Centre for Disease Prevention and Control, Solna, Sweden (Prof J C Semenza PhD); WHO-WMO Joint Climate and Health Office, Geneva, Switzerland (J Shumake-Guillemot DrPH); Institute of Tropical Aquaculture and Fisheries, Universiti Malaysia Terengganu, Kuala Terengganu, Malaysia (Prof M Tabatabaei PhD); Department of Civil Engineering, Tampere University, Tampere, Finland (J Taylor PhD); and Department of Electronics and Computer Science, CRETUS Institute, Universidade de Santiago de Compostela, Santiago, Spain (J Triñanes PhD) Correspondence to: Dr Nick Watts, Institute for Global Health, University College London, London W1T 4TJ, UK [email protected] For Peter Byass’ obituary see
Obituary Lancet 2020; 396: 752
The Lancet Countdown exists as an independent, multidisciplinary collaboration dedicated to tracking the links between public health and climate change. It brings together 35 academic institutions and UN agencies from every continent, and structures its work across five key sections: climate change impacts, exposures, and vulner-abilities; adaptation, planning, and resilience for health; mitigation actions and health co-benefits; economics and finance; and public and political engagement (panel 2). The 43 indicators and conclusions presented in this report are the cumulative result of the past 8 years of collaboration, and represent the consensus of climate scientists, geographers, engineers, experts in energy, food, and transport, economists, social and political scientists, public health professionals, and doctors.
Where the COVID-19 pandemic has direct implications for an indicator being reported (and where accurate data exists to allow meaningful commentary), these implica-tions are discussed in-text. Beyond this deviation, the 2020 report of The Lancet Countdown maintains focus on the connections between public health and climate change, and the collaboration worked hard to ensure the continued high quality of its indicators, with only minor amendments and omissions resulting from the ongoing disruptions.
Expanding and strengthening a global monitoring system for health and climate change
The Lancet Countdown’s work draws on decades of underlying scientific progress and data, with the initial
Panel 1: Health, climate change, and COVID-19
As of Nov 9, 2020, the COVID-19 pandemic has spread to 190 countries, with more than 50 493 000 cases confirmed and
more than 1 257 700 deaths recorded.16 The scale and extent of
the suffering, and the social and economic toll, will continue to evolve over the coming months, with the effects of the pandemic
likely to be felt for years to come.17 The relationship between the
spread of existing and novel infectious diseases, worsening environmental degradation, deforestation, and change in land use, and animal ill health has long been analysed and described. Equally, both climate change and COVID-19 act to exacerbate
existing inequalities within and between countries.18–20
As a direct consequence of the pandemic, an 8% reduction in greenhouse gas emissions is projected for 2020, which would be
the most rapid 1-year decline on record.21 Crucially, these
reductions do not represent the decarbonisation of the economy required to respond to climate change, but simply the freezing of economic activity. Equally, the 1·4% reduction in greenhouse gas emissions that followed the 2008 global financial crisis was proceeded by a rebound, with emissions rising by 5·9% in 2010. Likewise, it is unlikely that the current fall in emissions will be sustained, with any reductions being potentially outweighed by a shift away from otherwise ambitious policies for climate
change mitigation. However, this route need not be taken.21
Over the next 5 years, considerable financial, social, and political investment will be required to continue to protect populations and health systems from the worst effects of COVID-19, to safely restart and restructure national and local economies, and to rebuild in a way that prepares for future economic and public health shocks. Harnessing the health co-benefits of climate change mitigation and adaptation will ensure the economic, social, and environmental sustainability of these efforts, while providing a framework that encourages investment in local communities and health systems and synergises with existing
health challenges.22
Multiple, ready-to-go examples of such alignment are available, such as commonalities between future pandemic preparedness
and effective health adaptation to climate-related impacts.23
In climate-related health adaptation, decision making under deep uncertainty necessitates the use of the principles of flexibility, robustness, economic low regrets, and equity to guide
decisions.24 At the broader level, reducing poverty and
strengthening health systems will both stimulate and restructure economies, and are among the most effective measures to
enhance community resilience to climate change.3
Turning to mitigation, at a time when more and more countries are closing down the last of their coal-fired power plants and oil prices are reaching record lows, the fossil fuel sector is expected to be more affected than is the renewable
energy sector.21 If done with care and adequate protection for
workers, government stimulus packages are well placed to prioritise investment in healthier, cleaner forms of energy. The response to COVID-19 has encouraged a rethinking of the scale and pace of ambition. Health systems have restructured services practically overnight to conduct millions of primary care and specialist appointments online, and a sudden switch to online work and virtual conferencing has shifted investment towards communications infrastructure instead of aviation
and road transport.25,26 A number of these changes should be
reviewed, improved on, and retained over the coming years. It is clear that a growing body of literature and rhetoric will be inadequate to respond to climate change, and this work must take advantage of the moment to combine public health and climate change policies in a way that addresses inequality directly. The UN Framework Convention on Climate Change’s 26th Conference of the Parties, which is postponed to 2021 and is set to be in Glasgow, UK, presents an immediate opportunity to ensure the long-term effectiveness of the response to COVID-19 by linking the recovery to countries’ revised commitments (Nationally Determined Contributions) under the Paris Agreement. The solution to one economic and public health crisis must not exacerbate another, and, in the long term, the response to COVID-19 and climate change will be the most successful when they are closely aligned.
1 5 10 15 20 25 30 35 40 45 50 55
indicator set selected as part of an open, global con-sultation that sought to identify which of the connections between health and climate change could be meaningfully tracked.27 Proposals for indicators were considered and
adopted on the basis of numerous criteria, including the existence of a credible underlying link between climate change and health that was well described in the scientific literature; the availability of reliable and regularly updated data across expanded geographical and temporal scales; the presence of acceptable methods for monitoring; and the relevance to policy and availability of actionable interventions.
An iterative and adaptive approach has substantively improved most of these initial indicators and resulted in the development of several additional indicators. Given this approach, and the rapidly evolving nature of
the scientific and data landscape, each annual update replaces the analysis from previous years. The methods, sources of data, and improvements for each indicator are described in full in the appendix, which is an essential companion to the main report.
The 2020 report of The Lancet Countdown reflects an enor mous amount of work done during the past 12 months to refine and improve these indicators, including the annual update of the data. Several key developments have occurred.
Methods and datasets have been strengthened and stan-dardised for indicators that capture heat and heatwaves, floods and droughts, wildfires, the climate suitability for infectious disease transmission, food security and under nutrition, health adaptation spending, food and agriculture, low-carbon health care, the economics of
Panel 2: The indicators of the 2020 report of The Lancet Countdown
Climate change impacts, exposures, and vulnerabilities
1.1: health and heat
1.1.1: vulnerability to the extremes of heat
1.1.2: exposure of vulnerable populations to heatwaves 1.1.3: heat-related mortality
1.1.4: change in labour capacity 1.2: health and extreme weather events
1.2.1: wildfires 1.2.2: flood and drought
1.2.3: lethality of extreme weather events 1.3: climate-sensitive infectious diseases
1.3.1: climate suitability for infectious disease transmission
1.3.2: vulnerability to mosquito-borne diseases 1.4: food security and undernutrition
1.4.1: terrestrial food security and undernutrition 1.4.2: marine food security and undernutrition 1.5: migration, displacement, and rising sea levels
Adaptation, planning, and resilience for health
2.1: adaptation planning and assessment 2.1.1: national adaptation plans for health
2.1.2: national assessments of climate change impacts, vulnerability, and adaptation for health
2.1.3: city-level climate change risk assessments 2.2: climate information services for health 2.3: adaptation delivery and implementation
2.3.1: detection, preparedness, and response to health emergencies
2.3.2: air conditioning: benefits and harms 2.3.3: urban green space
2.4: spending on adaptation for health and health-related activities
Mitigation actions and health co-benefits
3.1: energy system and health
3.1.1: carbon intensity of the energy system 3.1.2: coal phase-out
3.1.3: zero-carbon emission electricity 3.2: clean household energy
3.3: premature mortality from ambient air pollution by sector 3.4: sustainable and healthy transport
3.5: food, agriculture, and health
3.5.1: emissions from agricultural production and consumption
3.5.2: diet and health co-benefits 3.6: mitigation in the health-care sector
Economics and finance
4.1: the health and economic costs of climate change and benefits from mitigation
4.1.1: economic losses due to climate-related extreme events
4.1.2: costs of heat-related mortality
4.1.3: loss of earnings from heat-related reduction in labour capacity
4.1.4: costs of the health impacts of air pollution
4.2: the economics of the transition to zero-carbon economies 4.2.1: investment in new coal capacity
4.2.2: investments in zero-carbon energy and energy efficiency
4.2.3: employment in low-carbon and high-carbon industries
4.2.4: funds divested from fossil fuels
4.2.5: net value of fossil fuel subsidies and carbon prices
Public and political engagement
5.1: media coverage of health and climate change 5.2: individual engagement in health and climate change 5.3: coverage of health and climate change in scientific journals
5.4: government engagement in health and climate change 5.5: corporate sector engagement in health and climate change
1 5 10 15 20 25 30 35 40 45 50 55
air pollution, and engagement in health and climate change from the media, the scientific community, and individuals.
Geographical or temporal coverage have been improved or expanded for indicators that track heat and heatwaves, labour capacity loss, floods and droughts, the climate suitability for infectious disease transmission, climate change risk assessments in cities, the use of clean household energy, and household air pollution.
New indicators have been developed to explore heat-related mortality, migration and population displacement, access to urban green space, the health benefits of low-carbon diets, the economic costs of extremes of heat and of labour capacity loss, net carbon pricing, and the extent to which the UN Framework Convention on Climate Change’s (UNFCCC) Nationally Determined Contributions (NDCs) engage with public health.
This continued progress has been supported by The Lancet Countdown’s scientific advisory group and the creation of a new, independent, quality improvement process, which provided independent expert input on the indicators before the formal peer review process, adding rigour and transparency to the collaboration’s research. In every case, the most up-to-date data avail-able are presented, with the precise nature and timing of these updates varying depending on the data source. This presentation of data has occurred despite the impact of COVID-19, which has only affected the production of a small subset of indicators for this report.
The Lancet Countdown has also taken several steps to ensure that it has the expertise, data, and representation required to build a global monitoring system. Partnering with Tsinghua University, Beijing, China, and Universidad Peruana Cayetano Heredia, Lima, Peru, the collaboration launched two new regional offices for South America (in Lima), and for Asia (in Beijing), and developed a new partnership to build capacity in west Africa. This expansion is coupled with ongoing work to develop national and regional Lancet Countdown reports in Australia (in partnership with the Medical Journal of
Australia), the EU (in partnership with the European
Environment Agency), China, and the USA. At the same time, a new data visualisation platformhas been launched, allowing health professionals and policy makers to investigate the indicators in this report.
Future work will concentrate on supporting these regional and national efforts, building capacity for communications and engagement, developing new indicators (with a particular interest in developing indicators related to mental health and gender), and further improving existing indicators. To this end, the continued growth of The Lancet Countdown depends on the dedication of each of its composite experts and partners, continued support from the Wellcome Trust, and ongoing input and offers of support from new academic institutions willing to build on the analysis published in this report.
Section 1: climate change impacts, exposures,
and vulnerabilities
A changing climate threatens to undermine the past 50 years of gains in public health, disrupting the wellbeing of communities and the foundations on which health systems are built.28 The effects of climate
change are pervasive and impact the food, air, water, and shelter that society depend on, extending across every region of the world and every income group. These effects act to exacerbate existing inequities, with vulnerable populations within and between countries affected more frequently and with a more lasting impact.3
Section 1 of the 2020 report tracks the links between climate change and human health along several exposure pathways, from the climate signal through to the resulting health outcome. This section begins by examining sev-eral dimensions of the effects of heat and heatwaves, ranging from exposure and vulnerability through to labour capacity and mortality (indicators 1.1.1–1.1.4). The indicator on heat-related mortality has been developed for the 2020 report, and, although ongoing work will strengthen these findings in subsequent years, this indicator comple ments existing indicators on exposure and vulnerability to heat and represents an important step forward.
Indicators 1.2.1–1.2.3 navigate the effects of extreme weather events, tracking wildfires, floods and droughts, and the lethality of extreme weather events. The wildfire indicator now tracks the risk of, and the exposure to, wildfires, the classification of drought has been updated to better align with climate change trends, and the attribution of the health effects of extreme weather events to climate change is presented. The climate suitability for the transmission of infectious diseases and the vulnerability of populations to infectious diseases were monitored, and so too were the evolving impacts of climate change on terrestrial and marine food security (indicators 1.3.1–1.4.2). The consideration of regional variation provided robust estimates of the effects of rising temperatures on crop yield potential. Indicator 1.5, which tracks exposure to rising sea levels in the context of migration and displacement, the resulting health effects, and policy responses, closes this section.
Indicator 1.1: health and heat
Exposure to high temperatures and heatwaves results in a range of negative health impacts, from morbidity and mortality due to heat stress and heatstroke to exacerba-tions of cardiovascular and respiratory disease.29,30 The
worst affected are those older than 65 years, those with disabilities or pre-existing medical conditions, those working outdoors or in non-cooled environments, and those living in regions already at the limits for human habitation.31 The following indicators track the
vulnera-bilities, exposures, and impacts of heat and heatwaves in every region of the world.
For more on the data visualisation platform see
1 5 10 15 20 25 30 35 40 45 50 55
Indicator 1.1.1: vulnerability to the extremes of heat—headline finding: vulnerability to the extremes of heat continues to increase in every region of the world, led by populations in Europe, with the Western Pacific region, South-East Asia region, and the African region all seeing an increase of more than 10% since 1990
This indicator re-examines the index results presented in the 2019 report,28 which combines data on the proportion
of the population older than 65 years; the prevalence of chronic respiratory disease, cardiovascular disease, and diabetes in this population, and the proportion of the total population living in urban areas. It also introduces a more comprehensive index of heat vulnerability, combining these aforementioned factors with heatwave exposure data and the International Health Regulations capacity score.
Since 1990, as a result of ageing populations, the high prevalence of chronic disease, and rising levels of urbanisation, populations in the European and Eastern Mediterranean regions have been the most vulnerable to the extremes of heat of all the WHO regions. In 2017, vulnerability was 40·6% in the European region and 38·7% in the Eastern Mediterranean region. However, no WHO region is immune and vulnerability has worsened everywhere. From 1990 to 2017, vulnerability increased in the African region (28·4% to 31·3%), the South-East Asia region (28·3% to 31·3%), and the Western Pacific region (33·2% to 36·6%). By taking into account health system strengthening and heatwave exposure across these regions, this vulnerability indicator can be usefully built into one that captures population risk, which has been done for the 2020 report (appendix pp 4–5). This new indicator shows trends similar to those aforementioned, with risk rising in every region. This index will be further developed during the course of 2020, and presented in full, alongside a broader suite of risk indicators, in future reports.
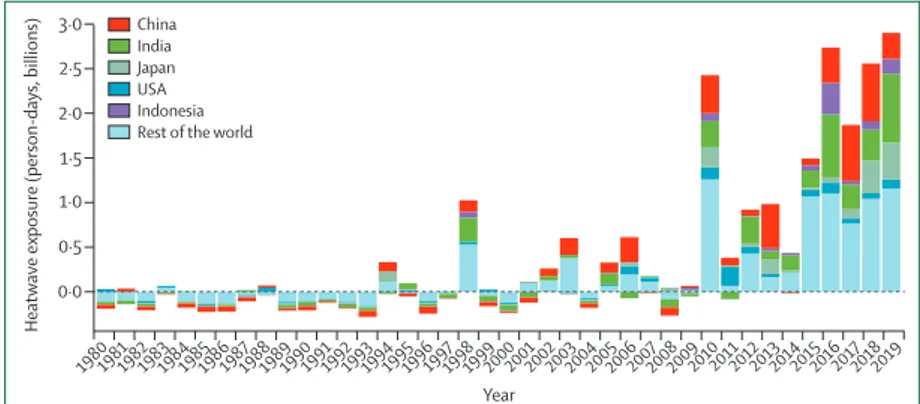
Indicator 1.1.2: exposure of vulnerable populations to heatwaves—headline finding: a record 475 million additional exposures to heatwaves affecting vulnerable populations were observed in 2019, representing some 2·9 billion additional days of heatwaves experienced
Since 2010, there has been an increase in the number of days of heatwave exposure, relative to a 1986–2005 base-line, in the population older than 65 years (figure 1). This rise has been driven by the combination of increasing heatwave occurrences and ageing populations. In 2019, there were 475 million additional exposure events. Expressed as the number of days in which a heatwave was experienced, this number breaks the previous 2016 record by an additional 160 mil lion person-days.
Indicator 1.1.2 tracks the exposure of vulnerable populations to heatwaves and has now been updated to make use of the latest climate data and a hybrid popula-tion dataset.32–34 This indicator has undergone several
additional improvements to best capture heatwave
exposure in every region of the world, including an improved definition of heatwave, the quantification of exposure days to capture changing frequency and duration, and improved estimates of demographic breakdown (appendix pp 6–11).
Indicator 1.1.3: heat-related mortality—headline finding: from 2000 to 2018, heat-related mortality in people older than 65 years increased by 53·7% and, in 2018, reached 296 000 deaths, the majority of which occurred in Japan, eastern China, northern India, and central Europe
This metric, newly created for the 2020 report, tracks global heat-related mortality in populations older than 65 years. By use of methods originally described by WHO, this indicator applies the exposure-response function and optimum temperature described by Honda and col-leagues35 to the daily maximum temperature exposure of
the population older than 65 years to estimate the attributable fraction and thus the heat-related excess mortality.36 As with indicator 1.1.2, data on daily maximum
temperature were taken from the European Centre for Medium-Range Weather Forecasts’ fifth reanalysis (ERA5) and gridded population data were taken from a hybrid of the National Aeronautics and Space Administration’s
Figure 1: Change in days of heatwave exposure relative to the 1986–2005 baseline in people older than 65 years
The dotted line at 0 represents baseline.
Heatwave exposure (person-days, billions)
Year 1980198119821983198419851986198719881989199019911992199319941995199619971998199920002001200220032004200520062007200820092010201120122013201420152016201720182019 3·0 2·5 2·0 1·5 1·0 0·5 0·0 China India Japan USA Indonesia Rest of the world
Figure 2: Global heat-related mortality for populations older than 65 years
The error bars were calculated on the basis of the uncertainty range of the exposure-response function, as described by Honda and colleagues.35
1999 2000 2001 2002 2003 2004 2005 2006 20072008 2009 2010 2011 2012 2013 2014 2015 2016 2017 2018 2019 100 000 150 000 200 000 250 000 300 000 350 000 Annual heat -related deaths Year
1 5 10 15 20 25 30 35 40 45 50 55
gridded popula tion of the world (version four) and the Inter-Sectoral Impact Model Intercomparison Project, with full metho dology described in the appendix (pp 12–13).32–34
This indicator estimates that the global average heat-related mortality per year in people older than 65 years has increased by 53·7% from 2000–04 to 2014–18, with a total of 296 000 deaths in 2018 (figures 2, 3). With the largest populations, China (62 000 deaths) and India (31 000 deaths) had the most deaths in 2018, followed by Germany (around 20 200 deaths), the USA (almost 19 000 deaths), Russia (18 600 deaths), and Japan (around 14 200 deaths). At more
than 104 000 deaths, the European region was the most affected of the WHO regions. Importantly, the effects of temperature on mortality vary by region and are modified by local factors, including population urban green space and inequality, both within and between countries.37,38
Work has begun to develop a future form of this indicator, which builds in more localised exposure-response func-tions as these funcfunc-tions become available.
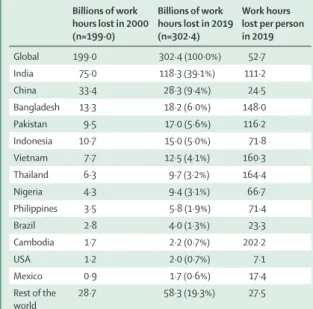
Indicator 1.1.4: change in labour capacity—headline finding: rising temperatures were responsible for an excess of 100 billion potential work h lost globally in 2019 compared with those lost in 2000, with India’s agricultural sector among the worst affected
Indicator 1.1.4 tracks the effects of heat exposure on working people, with impact expressed as potential work hours lost.39 This indicator has been updated to capture
construction, service, manufacturing, and agricultural sectors, and used climate data from the ERA5 models, with methods and data described in full previously and in the appendix (pp 13–16).33,40–43
Across the globe, a potential 302 billion work h were lost in 2019, which is 103 billion h more than that lost in 2000. 13 countries represented 244·1 billion (80·7%) of the 302·4 billion global work h lost in 2019 (table 1), with India having the greatest total loss and Cambodia having the highest per-capita loss of any country. In many countries in the world, agricultural workers see the worst of these effects, whereas, in high-income countries, such as the USA, the burden is often on those in the construction sector.
Indicator 1.2: health and extreme weather events Extreme weather events, including wildfires, floods, storms, and droughts, affect human health in various ways, with the frequency and intensity of such events shifting as a result of climate change. Death and injury as a direct consequence of an extreme event are often
Figure 3: Annual heat-related mortality in the population older than 65 years averaged from 2014 to 2018 10 001–100 000
1001–10 000 101–1000 1–100 No data
Annual number of deaths attributable to heat Billions of work hours lost in 2000 (n=199·0) Billions of work hours lost in 2019 (n=302·4) Work hours lost per person in 2019 Global 199·0 302·4 (100·0%) 52·7 India 75·0 118·3 (39·1%) 111·2 China 33·4 28·3 (9·4%) 24·5 Bangladesh 13·3 18·2 (6·0%) 148·0 Pakistan 9·5 17·0 (5·6%) 116·2 Indonesia 10·7 15·0 (5·0%) 71·8 Vietnam 7·7 12·5 (4·1%) 160·3 Thailand 6·3 9·7 (3·2%) 164·4 Nigeria 4·3 9·4 (3·1%) 66·7 Philippines 3·5 5·8 (1·9%) 71·4 Brazil 2·8 4·0 (1·3%) 23·3 Cambodia 1·7 2·2 (0·7%) 202·2 USA 1·2 2·0 (0·7%) 7·1 Mexico 0·9 1·7 (0·6%) 17·4 Rest of the world 28·7 58·3 (19·3%) 27·5
Data are n or n (%). For these estimates, all agricultural and construction work was assumed to be in the shade or indoors—the lower bounds of potential work hours lost. Work hours lost per person were estimated for the population older than 15 years.
1 5 10 15 20 25 30 35 40 45 50 55
compounded by effects that are mediated through the environment—eg, the exacerbation of respiratory symp-toms from wildfire smoke and the spread of vector-borne and water-borne diseases following a flood or drought. Impacts are also mediated through social systems—eg, the disruption to health services and the mental ill health that can be caused by storms and fires.3,44 The following
indicators track the risk and exposure of the population to wildfires, changes in meteorological flood and drought, and the lethality of extreme weather events.
Indicator 1.2.1: wildfires—headline finding: in 114 countries, there was an increase in the number of days people were exposed to very high or extremely high risk of danger from fire in 2016–19 compared with 2001–04. This increased risk translated into an increase in population exposure to wildfires in 128 countries
For the 2020 report, analysis on the effects of wildfires has been developed to track the average number of days people are exposed to very high or extremely high risk (figure 4) of wildfire annually and the change in actual population exposure to wildfires across the globe. The indicator uses both model-based risk to wildfires and satellite-observed exposure. Climatological wildfire risk was estimated by combining daily very high or extremely high wildfire risk (a fire danger index score of 5 or 6) with climate and population data for every 0·25° × 0·25° global grid cell.32,45 For wildfire exposure,
satellite-obser ved active fire spots were detected by use of the Moderate Resolution Imaging Spectroradiometer, and then aggre gated and spatially joined with gridded popula tion data on a global grid with a resolution of 10 km, with urban areas excluded.32,46 A full description
of the methodology can be found in the appendix (pp 17–18).
Compared with the period 2001–04, there was an increase in the risk of wildfire in 114 (58%) of 196 countries in 2016–19, with the largest increases occurring in Lebanon, Kenya, and South Africa (figure 4). Considering area-weighted, rather than population-weighted change, Australia, devastated by the 2019–20 fire season, had one of the largest increases in wildfire risk. During 2016–19, this increased risk translated into an additional 194 000 daily exposures to wildfires per year around the world, and an increase in population exposure to wild-fires in 128 countries, compared with 2001–04. Driven by the record breaking fires in 2017 and 2018, the USA saw one of the largest increases globally, with more than 470 000 addi tional daily exposures to wildfires per year occurring in 2016–19 compared with 2001–04.
Indicator 1.2.2: flood and drought—headline finding: in 2018, the global land surface area affected by excess drought was more than twice that of a historical baseline
Climate change alters hydrological cycles, tending to make dry areas drier and wet areas wetter.3 By altering
rainfall patterns and increasing temperatures, climate change affects the intensity, duration, and frequency of drought events.3,47 Drought poses multiple risks for health,
threatening drinking water supplies and sanitation, and crop and livestock productivity, enhancing the risk of wildfires, and potentially leading to forced migration.48
Additionally, altered precipitation patterns increase the risk of localised flood events, resulting in direct injury, the spread of infectious diseases, and impacts on mental health.49
In the 2020 report, meteorological drought is tracked by use of the standardised precipitation evapotrans piration index, which considers both precipitation and temperature, and the effect of temperature on the loss of soil moisture.
–50 –40 –30 –20 –10 0 10 20 30 40 50 Change in number of days of exposure to very high or extremely high risk of wildfire
Figure 4: Population-weighted averagechanges in the number of days of exposure to very high or extremely high risk of wildfire in 2016–19 compared with 2001–04
Large urban areas with a population density of 400 people per km² or more are excluded. Wildfire risk is based on the Fire Danger Index, which rates risk on a scale from 1 to 6 (1 is very low; 2 is low; 3 is medium; 4 is high; 5 is very high; and 6 is extremely high). The higher the number, the more favourable the meteorological conditions are to trigger a wildfire.
1 5 10 15 20 25 30 35 40 45 50 55
This index measures significant increases in the num ber of months of drought compared with an extended historical baseline (1950–2005) to account for periodic variations such as those generated by the El Niño Southern Oscillation.50 A full explanation of the methodology and
additional analysis are in the appendix (pp 19–21). In 2018, there was a larger number of exceptional drought events affecting all populated continents and the global land surface area affected by an excess number of months in drought was more than twice that of the historical base-line. Areas that saw unusually high numbers of months with excess drought in 2018 included Europe, the Eastern Mediterranean region, and, specifically, Mongolia.
Indicator 1.2.3: lethality of extreme weather events—headline finding: from 1990 to 2019, the long-term, increasing trends in the number of weather-related disasters were accompanied by an increase in the number of people affected by these disasters in countries where health-care expenditure had reduced or had minimally increased during 2000–17
The links between climate change and the health effects of extreme weather events are presented in two ways for this indicator. The first part studies long-term trends in the occurrence of such events, along with changes in the
number of people affected, and the resultant mortality. The methods and data for this analysisare similar to those used in previous reports and are described in full in the appendix (pp 22–24).51 Recognising that an increase
in the variability and intensity of these events is also expected, the second part considers the attribution of individual extreme weather events to climate change, and the effects that a selection of events have had on the health of populations (table 2, panel 3).
From 1990 to 2019, there were clear, significant, increasing trends in the number of occurrences of weather-related disasters, but no significant difference in the number of people affected per event or the number of deaths per event. Within the subset of countries that had a reduction, or a minimal increase in, health-care expen-diture from 2000 to 2017, a significant increase in the number of people affected by extreme weather events was identified. By contrast, in countries with the greatest increase in health-care expenditure in 2000–17, the number of people affected by extreme weather events decreased between 1990 and 2019, despite an increasing frequency of events. One possible explanation for this finding could be the adaptive effects of health system strengthening. This relationship will be further explored in future reports from Anthropogenic influence increased event likelihood or strength Anthropogenic influence
decreased event likelihood or strength
Anthropogenic influence not identified or uncertain
Heat (36 studies; 32 events) Events ending in 2015 in India, Pakistan, China, Indonesia, Europe,8,52 Egypt, Japan,
southern India and Sri Lanka, Australia, and worldwide;8,53 in 2016 in southern
Africa, Thailand, Asia, and worldwide; in 2017 in Australia,54 the USA, South Korea,
western Europe,55 China, and the Euro-Mediterranean region; in 2018 in northeast
Asia, the Iberian Peninsula, and Europe; in 2019 in France56 and western Europe;57
and in 2020 in Australia58
·· Events ending in 2015–16 in India59
Cold and frost (nine studies;
eight events) Events ending in 2016 in Australia Events ending in 2015 in the USA; in 2016 in China; and in 2018 in North America60 and the UK
··
Drought and reduced precipitation (26 studies; 24 events)
Events ending in 2015 in the USA, Canada, Ethiopia, Indonesia, and Australia; in 2016 in southern Africa and Thailand; in 2017 in east Africa, the USA, and China; and in 2018 in South Africa,61 China, and the USA
·· Events ending in 2015 in Brazil,62 Nigeria,
and Ethiopia;63 in 2016 in Brazil, the USA,
Somalia,64 and western Europe; in 2017 in
Kenya65 and the USA; and in 2019 in
Australia58
Wildfire (five studies;
six events) Events ending in 2015 in the USA; in 2016 in Australia and western North America; in 2018 in Australia; and in 2020 in Australia58
·· Events ending in 2017 in Australia
Heavy precipitation and flood
(23 studies; 19 events) Events ending in 2015 in China and the USA; in 2016 in France,
66 China, and
Louisiana (USA);67 in 2017 in Bangladesh, Peru, Uruguay, and China; and in 2018 in
the USA and Japan6,68
Events ending in 2018 in
China Events ending in 2015 in India; in 2016 in Germany66 and Australia; in 2017 in
Bangladesh;69 and in 2018 in Mozambique,
Zimbabwe and Zambia, Australia, India,70
and China* Storms (eight studies;
eight events) Events ending in 2015 in the UK
71 and the western north Pacific;72 in 2017 in
the USA;73 in 2018 in the USA;74 and in 2019 in the USA75
·· Events ending in 2016 in the USA and in 2018 in western Europe76
Marine heat and melting sea
ice (13 studies; ten events) Events ending in 2015 in the northern hemisphere; in 2016 in the USA, Australia, the Coral Sea,7,77 the North Pole,7,78 the Gulf of Alaska and the Bering Sea, and the central
equatorial Pacific; and in 2018 in the Tasman Sea and the Bering Sea
·· Events ending in 2015 in the central equatorial Pacific and in 2016 in the eastern equatorial Pacific
Total studies 81 6 27
Total events 76 5 28
Events have been listed according to the year in which they ended. In some countries and regions, multiple events in the same year were studied. References were gained from papers published in the Bulletin of the American Meteorological Society,5–8 or otherwise are listed separately. *Anthropogenic influence had varied effects.
Table 2: Detection and attribution studies linking extreme weather events to climate change from 2015 to 2020 For more on the methods and
data for this analysis see https://emdat.be/
1 5 10 15 20 25 30 35 40 45 50 55
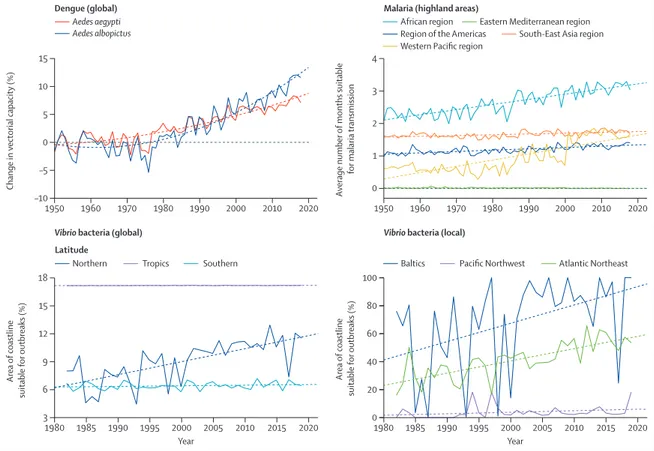
The Lancet Countdownby considering variables, such as expenditure for specific health-care functions and excess deaths, in addition to the immediate event-related deaths. Indicator 1.3: climate-sensitive infectious diseases Indicator 1.3.1: climate suitability for infectious disease transmission—headline finding: changing climatic conditions are increasingly suitable for the transmission of numerous infectious diseases. From 1950 to 2018, the global climate suitability for the transmission of dengue increased by 8·9% for
Aedes aegypti and 15·0%for Aedes albopictus. In 2015–19,
suitability for malaria transmission in highland areas was 38·7% higher in the African region and 149·7% higher in the Western Pacific region compared with a 1950s baseline
Climate change is affecting the risk to humans and the distribution of many infectious diseases, including
vector-borne, food-borne, and water-borne diseases.3 By
use of three different models, this indicator tracks the change in climate suitability for the transmission of infectious diseases of particular global importance: den gue, malaria, and pathogenic Vibrio bacteria (ie,
Vibrio parahaemolyticus, Vibrio vulnificus, and non-toxigenic Vibrio cholerae). Temperature-driven, process-based
mathe-matical models were used to capture the change in vectorial capacity of A aegypti and A albopictus for the transmission of dengue compared with a 1950s baseline.94
Change in the climate suitability for Plasmodium falciparum malaria was modelled on the basis of empirically derived thresholds of precipitation, temperature, and relative humidity and compared with a 1950s baseline.94 Highland
areas (ie, those ≥1500 m above sea level) are highlighted in the model because increasing temperatures are eroding
For more on climatic suitability see https://climexp.knmi.nl/
Panel 3: Quantifying the links between climate change, human health, and extreme events
Formal statistical methods, grouped as detection and attribution studies, are already used widely in other sectors, and are increasingly deployed to quantify the extent to which climate change has had observed impacts on population health
and health systems.79–81 However, detection and attribution
studies focusing on the changing likelihood and intensity of extreme events are generally limited to meteorological events in high-income and upper-middle-income countries. Further development of this body of literature offers an essential and unique way of improving understanding of current impacts and future risks of climate change on lives and livelihoods, guiding evidence-based management and adaptation. The following three case studies illustrate the linkage of detection and attribution studies of meteorological events to the resulting health impacts.
1. Reduced sea ice in the Arctic region
The Arctic region is warming two to three times faster than the global annual average, with observable impacts for Arctic
communities, but limited data on the health consequences.82
Extreme weather events, shifting migration patterns, and warmer and shorter winters now threaten food security and vital infrastructure.
The winter of 2017–18 heralded warm temperatures and an
extreme low ice year in the Bering Sea.83 The extent of sea ice
was the lowest in recorded and reconstructed history: an estimated two in 1800 year event considering preindustrial
climate forcing according to one study.84 This study also
suggested that climate change was responsible for 90% of the attributable risk, and that this extent of sea ice might become
the mean within 20 years.84
This low ice year had multiple detrimental effects on communities in western Alaska, USA, although the health impacts have rarely been measured. These communities generally depend on sea ice for transportation, hunting and fishing, coastal buffering from storms, and a host of other ecosystem services. During this period of record low sea ice, a range of events
occurred, including a loss of power, and damage to the water treatment plant, in Little Diomede (an Alaskan island) and a fatal accident that resulted from open waterholes along a previously
frozen travel corridor on the Kuskokwim River.85–87
2. Northern European heatwaves in 2018 and 2019
During the summer of 2018, parts of northern Scandinavia experienced record breaking daily temperatures that were more than 5°C warmer than those in 1981–2010, an occurrence that evidence suggests was made five times more probable as a
result of climate change.88 In Sweden, the Public Health Agency
estimated an excess mortality of 750 deaths between July and August, 2018, with more than 600 of these attributed to higher
temperatures, when compared with the same weeks in 2017.89
Countries across western Europe and Scandinavia again experienced record breaking temperatures in 2019, with the temperatures in several countries exceeding 40°C for 3–4 days during June and July. Attribution studies suggest climate change was responsible for a ten times increase in the likelihood of the event occurring, and a 1·2–3·0°C increase in the temperature of these events, with almost 1500 deaths in France and 400 deaths
in the Netherlands occurring because of these events.57,90,91
3. Japan heatwave of 2018
The summer of 2018 in Japan saw a combination of a national emergency resulting from extreme precipitation followed closely by record breaking temperatures. The event had roughly a 20% probability of occurring in today’s world compared with a
probability of 0% in a world without climate change.92,93
Another attribution study compared modest and extreme heatwave days with a 1941–79 baseline, concluding that the probability of the defined heatwave event was 1·5 times higher for 1980–2018 and 7·0–8·0 times higher for 2019–50. This hot summer had large health implications. In 2018, there were an estimated 14 200 heat-related deaths in the population in Japan aged more than 65 years—more than 3000 more deaths than the previous record set in 2010, and 8100 more than the 2000–04 average (indicator 1.1.3).
1 5 10 15 20 25 30 35 40 45 50 55
the effect altitude has as a barrier to malaria transmission, which has resulted in more favourable conditions in densely populated highland areas, as seen in Ethiopia.95
In the case of pathogenic Vibrio spp, which cause a range of human infections, including gastroenteritis, wound infections, sepsis, and cholera, 2019 and 2016–19 average climate suitability were compared with a 1980s global baseline and between one region each in Europe (the Baltics), the Atlantic Northeast coast of the USA, and the Pacific Northwest coast of North America.96–98 Full
descrip-tions of the context of these diseases, the methodology of the models, and additional analysis can be found in the appendix (pp 25–33).
Climate suitability for disease transmission increased globally for all diseases tracked. 2018 was particularly favourable for the transmission of dengue, with a global rise in vectorial capacity of 8·9% for A aegypti and 15·0% for A albopictus compared with a 1950s baseline (figure 5). Although average suitability for dengue remained low in Europe, 2018 was the most suitable year yet recorded for both vector species in this region, with a change from the 1950s baseline of 25·8% for A aegypti and 40·7% for A albopictus. There have been significant increases in the environmental suitability for the trans-mission of falciparum malaria in highland areas of four of the five malaria endemic regions, with an increase
of 38·7% in the African region and 149·7% in the Western Pacific region in 2015–19 compared with the 1950s baseline (figure 5). The coastal area suitable for
Vibrio infections in the past 5 years has increased at
northern latitudes (40–70° N) by 50·6% compared with a 1980s baseline. Regionally, the area of coastline suitable for Vibrio spp has increased by 61·2% for the Baltics and 98·9% for the Atlantic Northeast. In 2019, for the second consecutive year, the entirety of the Baltic coastline was suitable for the transmission of Vibrio bacteria.
Indicator 1.3.2: vulnerability to mosquito-borne diseases— headline finding: following a sharp decline from 2010 to 2016, 2016–18 saw small up-ticks in national vulnerability to dengue outbreaks in four of six WHO regions; further data are required to establish a trend
As discussed, climate change is expected to facilitate the expansion of Aedes mosquito vectors that transmit dengue. Improvements in public health services might counteract these threats in the short-to-medium term; however, climate change will continue to make such efforts increasingly difficult and costly.99 This indicator
tracks vulnerability to mosquito-borne disease by com-bining data from indicator 1.3.1 on vectorial capacity for the transmission of dengue with the core capacities of countries’ health-care systems, as outlined by WHO’s
Figure 5: Change in climate suitability for infectious diseases
Solid lines represent the annual change. Dashed lines represent the trend since 1950 (for dengue and malaria) and 1982 (for Vibrio bacteria). 1950 Dengue (global) 1960 1970 1980 1990 2000 2010 2020 –10 –5 0 5 10 15
Change in vectorial capacity (%)
1950
Malaria (highland areas)
1960 1970 1980 1990 2000 2010 2020 0 1 2 3 4 Av erage number of months suitable for malaria transmission 1980
Vibrio bacteria (global)
1985 1990 1995 2000 Year Year 2005 2010 2015 2020 1980 1985 1990 1995 2000 2005 2010 2015 2020 3 6 9 12 15 18 Area of coastline suitable for outbreaks (%)
Vibrio bacteria (local)
0 40 20 60 80 100 Area of coastline suitable for outbreaks (%) Aedes aegypti Aedes albopictus
Northern Tropics Southern Baltics Pacific Northwest Atlantic Northeast
African region Region of the Americas
Eastern Mediterranean region Western Pacific region South-East Asia region