2018
Publication Year
2021-02-26T17:33:29Z
Acceptance in OA@INAF
ALMA Observations of Polarized Emission toward the CW Tau and DG Tau
Protoplanetary Disks: Constraints on Dust Grain Growth and Settling
Title
BACCIOTTI, Francesca; Girart, Josep Miquel; Padovani, Marco; PODIO, LINDA;
Paladino, Rosita; et al.
Authors
10.3847/2041-8213/aadf87
DOI
http://hdl.handle.net/20.500.12386/30664
Handle
THE ASTROPHYSICAL JOURNAL LETTERS
Journal
865
ALMA Observations of Polarized Emission toward the CW Tau and DG Tau
Protoplanetary Disks: Constraints on Dust Grain Growth and Settling
Francesca Bacciotti1 , Josep Miquel Girart2,3 , Marco Padovani1 , Linda Podio1 , Rosita Paladino4, Leonardo Testi1,5 , Eleonora Bianchi6 , Daniele Galli1 , Claudio Codella1 , Deirdre Coffey7,8, Cecile Favre1 , and Davide Fedele1
1Istituto Nazionale di Astrofisica–Osservatorio Astrofisico di Arcetri, Largo Enrico Fermi, 5, I-50125 Firenze, Italy;
2
Institut de Ciències de l’Espai (ICE, CSIC), Can Magrans, s/n, E-08193 Cerdanyola del Vallés, Catalonia, Spain
3Institut d’Estudis Espacials de Catalunya (IEEC), E-08034, Barcelona, Catalonia, Spain 4
Istituto Nazionale di Astrofisica - Istituto di Radioastronomia Via P. Gobetti, 101, I-40129 Bologna, Italy
5
European Southern Observatory, Karl-Schwarzschild-Strasse 2, D-85748 Garching bei München, Germany
6
Institut de Planétologie et d’Astrophysique de Grenoble (IPAG) Université Grenoble Alpes, CS 40700, F-38058 Grenoble Cédex 9, France
7
School of Physics, University College Dublin, Belfield, Dublin 4, Ireland
8
School of Cosmic Physics, The Dublin Institute for Advanced Studies, Dublin 2, Ireland Received 2018 July 10; revised 2018 September 5; accepted 2018 September 6; published 2018 September 24
Abstract
We present polarimetric data of CW Tau and DG Tau, two well-known Class II disk/jet systems, obtained with the Atacama Large Millimeter/submillimeter Array (ALMA) at 870 μm and 0 2 average resolution. In CW Tau, the total and polarized emission are both smooth and symmetric, with polarization angles almost parallel to the minor axis of the projected disk. In contrast, DG Tau displays a structured polarized emission, with an elongated brighter region in the disk’s near side and a belt-like feature beyond about 0 3 from the source. At the same time, the total intensity is spatially smooth, with no features. The polarization pattern, almost parallel to the minor axis in the inner region, becomes azimuthal in the outer belt, possibly because of a drop in optical depth. The polarization fraction has average values of 1.2% in CW Tau and 0.4% in DG Tau. Our results are consistent with polarization from self-scattering of the dust thermal emission. In this hypothesis, the maximum size of the grains contributing to polarization is in the range 100–150 μm for CW Tau and 50–70 μm for DG Tau. The polarization maps combined with dust opacity estimates indicate that these grains are distributed in a geometrically thin layer in CW Tau, representing a settling in the disk midplane. Meanwhile, such settling is not yet apparent for DG Tau. These results advocate polarization studies as a fundamental complement to total emission observations, in investigations of the structure and the evolution of protoplanetary disks.
Key words: ISM: jets and outflows – polarization – protoplanetary disks
1. Introduction
The study of protoplanetary disks has recently seen significant advances, driven by the desire to identify the initial conditions for planet formation. The advent of the Atacama Large Millimeter/ submillimeter Array(ALMA) has brought increased sensitivity in mm-wave polarimetry, opening a new area of investigation into disk properties. Polarimetry is long believed to allow access to information on the orientation of magnetic field lines, because linear polarization can arise from “grain alignment,” i.e., the tendency of non-spherical dust grains to align their short axis along the magnetic field lines (e.g., Andersson et al. 2015). This is a crucial test for disk models, in particular regarding the magneto-centrifugal acceleration of outflows (Blandford & Payne 1982; Frank et al.2014) and the magneto-rotational instability (Balbus & Hawley1991). However, linear polarization in the mm continuum emitted from disks can also be produced by processes unrelated to the magneticfield. In particular, self-scattering and radiative grain alignment can result in a high percentage of linear polarization, with very specific polarization patterns (Kataoka et al. 2017; Tazaki et al.2017; Yang et al.2017).
Thefirst polarimetry studies of protostellar envelopes, at 1″–3″ resolution, allowed the identification of hourglass-shaped, twisted polarization patterns consistent with the pinching of magneticfield lines due to the contraction of the natal cloud(Girart et al.2006; Rao et al.2009; Hull et al.2014). Subsequent studies at 0 4–1 2 reported the first detections of polarized emission in protostellar disks(e.g., Rao et al.2014; Cox et al.2015; Kataoka et al.2016b).
Recently, the scales of the inner protoplanetary disk have been accessed with ALMA, reaching 0 1 resolution. Observations show that all of the mechanisms mentioned above can produce polarization, but dust self-scattering appears to be dominant here (Stephens et al. 2014, 2017; Kataoka et al. 2016a, 2017; Alves et al.2018; Girart et al.2018; Hull et al. 2018; Lee et al. 2018).
Our study maps the polarization properties of the more evolved (i.e., Class II) systems that are associated with jets. These systems offer the advantage of being less embedded than younger sources. In addition, the kinematics of the bipolar jet allows identification of the disk’s near side, which is an important information in polarization studies(Yang et al.2017). Here, we present the results for two sources, CW Tau and DG Tau, selected because they are nearby(d∼140 pc, Rebull et al.2004), tilted with respect to the plane of the sky (i.e., favorable for polarization measurements), and have bright dust continuum emission(allowing sensitivity in detection of polarization). Previous studies of these sources include disk investigations by Testi et al.(2002), Isella et al. (2010), and Piétu et al. (2014), and jet investigations by Eislöffel & Mundt (1998), Dougados et al. (2000), Bacciotti et al. (2002), Hartigan et al.(2004), and Coffey et al. (2007).
2. Observations and Data Reduction
We observed polarized emission toward the young Taurus systems CW Tau and DG Tau, within the ALMA Cycle 3 program 2015.1.00840.S(PI: F. Bacciotti). Observations were © 2018. The American Astronomical Society. All rights reserved.
carried out in Band 7(870 μm) in full polarization mode. The spectral setup included four spectral windows, 1.875 GHz wide, centered at the standard ALMA Band 7 polarization frequencies (336, 338, 348, and 350 GHz). The spectral resolution was 31.250 MHz (55 km s−1). Two successful executions were made on 2017 July 11, with 40 antennas in the configuration C36-6, giving nominal angular resolution of 0 15. Total exposure time was 34.38 minutes for CW Tau and 30.24 minutes for DG Tau. Quasars J0429+2724 and J0403 +2600 were observed to calibrate the bandpass, and the gains in amplitude and phase, respectively. To determine the instrumental contribution to the cross-polarized interferometer response, a bright strongly polarized(2%) quasar, J0522-3627, was observed.
The data were processed using the Common Astronomical Software Application(CASA) version 4.7.2. The two data sets were calibrated separately to obtain total intensity, and then concatenated to perform the polarization calibration. Calibra-tion followed the standard procedure described in Nagai et al. (2016) and in the ALMA polarization casaguide.9
The data were reduced using the task CLEAN in CASA. To improve the dynamic range of the images, phase-only self-calibration runs were executed. For CW Tau, two runs resulted in a final dynamic range of 625, a factor of three better than in the initial image. Meanwhile, for DG Tau, three runs resulted in afinal dynamic range of 1025, giving an improvement of a factor of seven with respect to the initial image. The final images were obtained using Briggs weighting, and the synthesized beam was 0 27×0 14 (PA=−39°) for CW Tau and 0 24×0 14 (PA=−32°) for DG Tau (corresponding to an average of 29 au and 27 au, respectively, at 140 pc). The rms achieved for CW Tau was 72μJy beam−1in Stokes I, and∼40 μJy beam−1in Stokes Q and U, while for DG Tau it was 180μJy beam−1in Stokes I, and ∼58 μJy beam−1 in Stokes Q and U. From the Stokes I, U, Q maps we obtain the linear polarization intensity,P= Q2+U2,
the linear polarization fraction, p=P/I, and the polarization angle, χ=0.5 arctan(U/Q), i.e., the direction of polarization of the electricfield. The ALMA instrumental error is reported to be 0.1% on p, and at least 2° on χ (ALMA polarization casaguide).
3. Results 3.1. Total Emission
Figure 1 illustrates the total intensity (Stokes I) of the 870μm continuum emission and the azimuthal average of the intensity radial profile for each target, with both showing a smooth distribution with no features apparent at our resolution. For CW Tau, the integratedflux is 145.1±1.4 mJy, with peak intensity of 44.9±0.3 mJy beam−1located at R.A. 4h14m17 0, δ28°10′57 35. The measured flux is the same, within the errors, as the one extrapolated from integrated 1.3 mmflux of Piétu et al. (2014), adopting their spectral index of 2.3. The FWHM along the major and minor axis, determined with a 2D Gaussian fit deconvolved from the beam, is 0 35 and 0 18, respectively. From these values, we estimate a disk inclination idisk with respect to the line of sight of∼59°, between the inclination angle for the disk, idisk=65°±2° indicated by Piétu et al. (2014) and the one of jet, ijet=49° reported in Hartigan et al. (2004). The same fit gives a disk position angle, PAdisk=60°.7±1°.9, in good agreement with PAdisk=62°±3° (Piétu et al. 2014),
and almost perpendicular to the jet PAjet=−29° (Hartigan et al. 2004).
For DG Tau, the integratedflux is 880.2±9.4 mJy, with peak intensity of 182.4±1.4 mJy beam−1, located at R.A. 4h27m4 7, δ26°6′15 71. The integrated flux is slightly lower (by 12%) than that extrapolated from 1.3 mmflux of Isella et al. (2010), adopting their spectral index of 2.5. A 2D Gaussian fit deconvolved from the beam provided a FWHM along the major and minor axis of 0 45 and 0 36, respectively. The combination of these values implies idisk∼37°, almost identical to ijet=38° (Eislöffel & Mundt 1998), and only slightly higher than disk models of idisk=24°–32° (Isella et al.2010). The 2D Gaussian fit gives PAdisk=135°.4±2°.5, almost perpendicular to PAjet= 46° (Eislöffel & Mundt1998).
3.2. Polarized Emission
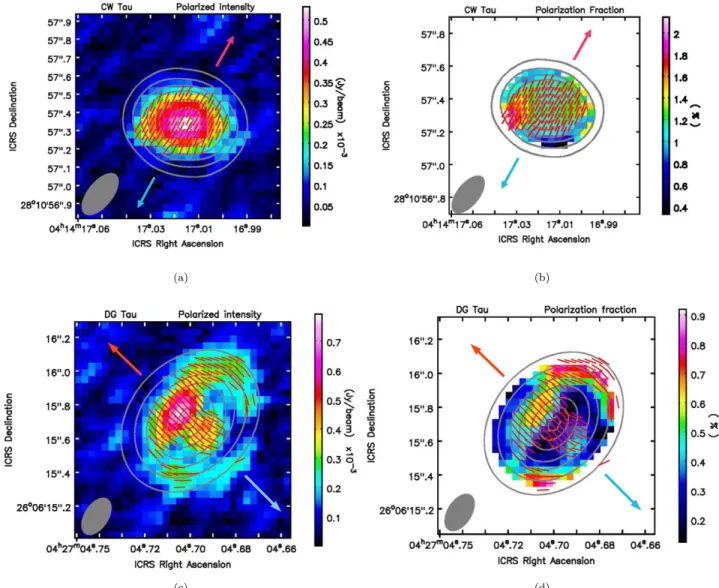
Figure2illustrates the polarization properties in our targets. For CW Tau, the map of linearly polarized intensity P is centrally peaked and does not show any significant asymmetry. The maximum value is 0.53±0.14 mJy beam−1. The super-imposed polarization vectors are aligned along the minor axis of the disk. Figure 3 panel (a) shows that the distribution of the polarization angles is very narrow, averaging−29°.8±4°.0, and nearly coincident with the position angle(PA) of the disk minor axis and the PA of the jet. The polarization fraction, p, is almost constant in the central region of the disk, averaging 1.15±0.26% over the whole disk.
For DG Tau, the intensity map is distributed asymmetrically with respect to the disk’s major axis. The near side of the disk (identified by its proximity to the receding jet lobe) is brighter, with the signal distributed parallel to the major axis. The peak emission of 0.79±0.13 mJy beam−1is found along the minor axis, displaced by ∼0 07 from the Stokes I photocenter. A secondary peak of 0.45 mJy beam−1is seen 0 07 southwest of the disk center. In the outer disk region, between 0 3 and 0 5 from the source, the polarized emission is distributed in a belt-like structure of lower intensity (0.2–0.3 mJy beam−1). The polarization vectors follow two distinct patterns. In the central inner region, they appear to be nearly aligned with the minor axis, while in the outer belt they have an azimuthal orientation. The distribution of polarization angles (Figure 3, panel (b)) gives an average of 50°.7±27°.4 which is similar to the PA of the minor axis (45°). The wide distribution is due to the azimuthal orientation of the vectors in the outer disk. The linear polarization fraction p reflects the distribution of the polarized intensity, with a region of higher values in the disk’s near side, along a direction parallel to the major axis. The peak of 0.65%±0.10% is located at 0 07 from the total intensity peak. The outer belt beyond 0 3 shows a higher polarization fraction toward the NW and the SE, where the polarized emission falls off more slowly than the total intensity. The average value of the polarization fraction over the whole disk area is 0.41%±0.17%, with a median of 0.38%.
4. Discussion
4.1. Polarization from Self-scattered Dust Emission The polarization properties in our sources match the model expectations of self-scattering of thermal dust emission from large (>30 μm) dust grains, as modeled by Kataoka et al. (2015,2017), and Yang et al. (2016,2017), and in agreement with the findings in other protoplanetary disks at similar 9 https://casaguides.nrao.edu/index.php/3C286_Band6Pol_Calibration_
for_CASA_4.3#Polarization_Calibration
wavelengths(e.g., Kataoka et al.2017for HL Tau, Girart et al. 2018for the GGD27 MM1 disk, Hull et al. 2018for the disk around IM Lup). In all of these cases, the strongest indication for polarization from self-scattering is the alignment of the polarization vectors along the minor axis in the central region of the disk. This feature originates from the geometry of the scattering when the disk is inclined with respect to the line of sight.
4.2. Grain Size Estimates
Kataoka et al. (2015) showed that the maximum grain size contributing to polarization from self-scattering at a given wavelength, λ, is comparable to λ/2π. At 870 μm, we expect a maximum size in the range 35–350 μm, peaked around 140μm (see their Figure3). Further constraints can come from the correlation between grain size, wavelength, and polarization fraction, as investigated for the disk around HL
Tau in Kataoka et al. (2016a) and Kataoka et al. (2017). We attempt a rough estimate of the grain size in our targets using the same diagnostic diagrams, because the polarization fraction has a weak dependence on the particular disk model while it is strongly dependent on the grain size (Kataoka et al.2016a). Using our values of the average polarization fraction and the diagrams in Kataoka et al. (2017), we estimate that the maximum grain size giving rise to the observed polarization is in the range 100–150 μm for CW Tau, and in the range 50–70 μm for DG Tau.
4.3. Constraints on Dust Settling
In CW Tau, the distribution of the polarized intensity is symmetric, and polarization vectors are nearly parallel to the minor axis, with no curvature toward the outer disk. These features are consistent with polarization produced by self-scattering in either an optically thin disk(Yang et al.2016), or Figure 1.Total emission map at 870μm and average radial intensity profiles in the disks around CW Tau (panels (a), (b)) and DG Tau (panels (c), (d)). Contour levels are[0.1, 0.2, 0.3, 0.4, 0.6, 0.8, 0.95]×peak value, which is 44.9 and 182.4 mJy beam−1for CW Tau and DG Tau, respectively. The gray areas in the radial profile give the 1σ uncertainties from the standard deviation.
in an optically thick but geometrically thin disk (Yang et al.2017, see their Figure10). Piétu et al. (2014) found that this dusty disk is optically thick, thus our observations indicate that the grains in question are located in a geometrically thin layer near the disk midplane.
Meanwhile, in DG Tau, we see a similar polarization angle alignment in the inner disk, but in this case it is accompanied by an asymmetry in polarization intensity. This combination is consistent with the expectations of models of self-scattering in
disks of intermediate or high optical depth, and with a finite angular thickness(Yang et al.2017). We estimate the optical depth of the DG Tau disk at 870μm using the models for dust opacity and surface density in Isella et al.(2010). The optical depth varies smoothly from about 1.0 to about 0.4 between 10 and 30 au from the star, where we observe the asymmetry, and decreases to about 0.1 at 80 au (an uncertainty of 20% accounts for the different models adopted). The disk is, therefore, moderately optically thick, which corresponds to the assumptions of Model B of Yang et al. (2017). Indeed, the observed polarization map is well reproduced by the output of this model (see Figures4(d)–(f) in Yang et al. 2017). The observed asymmetry thus appears to indicate that the scattering grains have not yet settled to the midplane.
We further investigate DG Tau by comparing the PA of the polarization vectors within the inner 35 au(∼0 25) to that of the disk minor axis. Figure 4 (lower panel) shows PA differences along three cuts parallel to the major axis: the major axis itself(black); 0 14 toward the near side (red); and 0 14 toward the far side (blue). The PA differences are less than 10 degrees in the inner 20 au, and do not change sign at the minor axis. This is in contrast with the expectations from
Figure 2.Linearly polarized intensity P and polarization fraction p at 870μm in the disks around CW Tau (panels (a), (b)), and DG Tau (panels (c), (d)). Contours as in Figure1. Polarization angle,χ, is indicated with fixed-length vector bars. Arrows indicate the jet orientation. The disk’s near side lies toward the receding jet lobe (red arrow). Polarization fraction p is shown where total intensity is I>10 mJy beam−1for CW Tau and I>30 mJy beam−1for DG Tau.
Figure 3.Distribution of the polarization angles toward CW Tau(a) and DG Tau(b). Dashed and red lines indicate the average of the distributions and the PA of the disk minor axis, respectively.
the models at moderate/high optical thickness in Yang et al. (2017), in which the PA difference is expected to change sign crossing the minor axis, and to reach an absolute value between 15° and 20°. This suggests that in the DG Tau disk the grains are distributed with a finite angular thickness (because we observe an asymmetry), but the optical depth of this material is not high enough to induce the position angle bifurcation. It is possible that our observations probe an intermediate scale height between the disk surface and the disk midplane. Alternatively, we may be witnessing moderate dust settling occurring in an optically thick portion of the disk.
4.4. Variation of Polarization Orientation in DG Tau We now consider the outer region of the DG Tau disk, i.e., beyond 0 3 from the source. Figure 2 panel (c) shows structures in the polarized emission that do not correspond to any feature in the total intensity at the same resolution. In addition, a change in the orientation of the polarization pattern is observed.
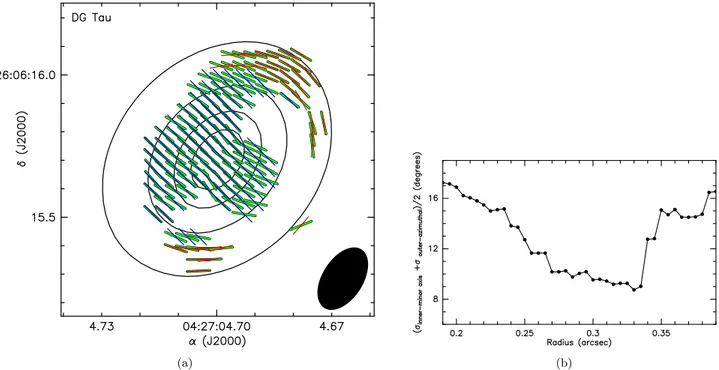
This PA transition was investigated using a geometrical model in which the polarization vectors are parallel to the minor axis inside a given radius R, and have an azimuthal orientation outside R, as in Figure 5, panel (a). This figure illustrates the best fit with the observations, obtained setting R=0 33. This value of R is the one for which the the standard deviation in PA difference(combining inner and outer disk) as a function of (the free parameter) R reaches its minimum (see Figure 5, panel (b)). The good agreement with the observed polarization pattern suggests that there is a real change in polarization properties at about 45 au from the star. The physical meaning of this radius, however, which has been derived under purely geometrical assumptions, is not obvious. No substructure is apparent in the total intensity map, nor in the averaged radial profile of the total intensity, at our resolution (Figure 1, panels (c, d)). A possible explanation may come
from a drop in the optical depth at R. This would imply that the outer disk is optically thin and that the radiation is seen to come primarily from the inner disk. Under such conditions, the self-scattered radiation would have an azimuthal polarization orientation in the outer disk, as observed. A similar pattern is found by Girart et al.(2018) in the GGD27 MM1 disk, and a change in optical depth is invoked for the transition. The physical reason for such a change, however, remains to be investigated. Alternatively, the alignment of non-spherical grains with the anisotropic radiation field (Tazaki et al.2017) may contribute to the azimuthal polarization pattern in the outer disk belt. Multi-wavelength observations at higher angular resolution are needed to clarify this point. In any case, our analysis indicates that the polarization maps are providing us with complementary information on the disk structure that are not accessible via the total intensity maps.
5. Conclusions
Our ALMA observations of the disks around CW Tau and DG Tau support dust self-scattering as the origin of the polarization seen in the 870μm continuum emission. By observing systems with jets, we can successfully identify the near side of the disk and thus correctly interpret asymmetry properties of the linearly polarized light intensity. This in turn provides us with constraints on the scale height of the dust grains responsible for this polarization. Furthermore, our determination of the polarization fraction allows us to estimate a maximum size for the scattering dust grains. We find that such grains tend to be larger and more settled to the disk midplane in the case of CW Tau than in DG Tau. The maps of the polarization intensity and polarization vector orientation reveal details that are not shown in the total intensity map at the same resolution. Overall, our analysis indicates that polarimetry is set to be a powerful tool in accessing information on the dust properties that cannot be obtained from the unpolarized emission alone. It is anticipated that this will be of great interest in studies of structure and evolution of protoplanetary disks.
This paper uses ALMA data from project ADS/JAO.ALMA 2015.1.00840.S. ALMA is a partnership of ESO(representing its member states), NSF (USA) and NINS (Japan), together with NRC(Canada), MOST and ASIAA (Taiwan), and KASI (Republic of Korea), in cooperation with the Republic of Chile. The Joint ALMA Observatory is operated by ESO, AUI/ NRAO and NAOJ. We thank the anonymous referee for very valuable comments. J.M.G. is supported by the MINECO (Spain) AYA2014-57369-C3 and AYA2017-84390-C2 grants. M.P. acknowledges funding from the EU-Horizon-2020/MSC grant agreement No-664931. L.P. and C.C. acknowledge the project PRIN-INAF/2016 GENESIS-SKA. This work was partly supported by the Italian Ministero dell’Istruzione, Università e Ricerca, through the grants Progetti Premiali 2012/iALMA (CUP-C52I13000140001), 2017/FRONTIERA (CUP-C61I15000000001), SIR-(RBSI14ZRHR; acknowledged by D.F. and C.F.), by the Deutsche Forschungs-gemeinschaft (DFG; German Research Foundation)-Ref no. FOR 2634/1 TE 1024/1-1, and by the DFG cluster of excellence Origin and Structure of the Universe(www.universe-cluster.de).
Figure 4.Upper panel: total intensity profiles across the DG Tau disk along cuts parallel to the major axis. The black line represents the major axis itself (PAdisk=135°), the red line cuts the disk at 0 14 to its near side, and the blue
line cuts at 0 14 to its far side. Positive offsets correspond to east of the intensity peak. Lower panel: the difference between the position angles of the polarization vectors and of the disk minor axis, along the same profile cuts as above.
ORCID iDs
Francesca Bacciotti https://orcid.org/0000-0001-5776-9476 Josep Miquel Girart https://orcid.org/0000-0002-3829-5591 Marco Padovani https://orcid.org/0000-0003-2303-0096 Linda Podio https://orcid.org/0000-0003-2733-5372 Leonardo Testi https://orcid.org/0000-0003-1859-3070 Eleonora Bianchi https://orcid.org/0000-0001-9249-7082 Daniele Galli https://orcid.org/0000-0001-7706-6049 Claudio Codella https://orcid.org/0000-0003-1514-3074 Cecile Favre https://orcid.org/0000-0002-5789-6931 Davide Fedele https://orcid.org/0000-0001-6156-0034
References
Alves, F. O., Girart, J. M., Padovani, M., et al. 2018,A&A,616, 56
Andersson, B.-G., Lazarian, A., & Vaillancourt, J. E. 2015,ARA&A,53, 501
Bacciotti, F., Ray, T. P., Mundt, R., Eislöffel, J., & Solf, J. 2002,ApJ,576, 222
Balbus, S. A., & Hawley, J. F. 1991,ApJ,376, 214
Blandford, R. D., & Payne, D. G. 1982,MNRAS,199, 883
Coffey, D., Bacciotti, F., Ray, T. P., Eislöffel, J., & Woitas, J. 2007, ApJ,
663, 350
Cox, E. G., Harris, R. J., Looney, L. W., et al. 2015,ApJL,814, L28
Dougados, C., Cabrit, S., Lavalley, C., & Ménard, F. 2000, A&A,357, L61
Eislöffel, J., & Mundt, R. 1998,AJ,115, 1554
Frank, A., Ray, T. P., Cabrit, S., et al. 2014, in Protostars and Planets VI, ed. H. Beuther et al.(Tucson, AZ: Univ. Arizona Press),451
Girart, J. M., Fernández-López, M., Li, Z.-Y., et al. 2018,ApJL,856, L27
Girart, J. M., Rao, R., & Marrone, D. P. 2006,Sci,313, 812
Hartigan, P., Edwards, S., & Pierson, R. 2004,ApJ,609, 261
Hull, C. L. H., Plambeck, R. L., Kwon, W., et al. 2014,ApJS,213, 13
Hull, C. L. H., Yang, H., Li, Z.-Y., et al. 2018,ApJ,860, 82
Isella, A., Carpenter, J. M., & Sargent, A. I. 2010,ApJ,714, 1746
Kataoka, A., Muto, T., Momose, M., et al. 2015,ApJ,809, 78
Kataoka, A., Muto, T., Momose, M., et al. 2016a,ApJ,820, 54
Kataoka, A., Tsukagoshi, T., Momose, M., et al. 2016b,ApJL,831, L12
Kataoka, A., Tsukagoshi, T., Pohl, A., et al. 2017,ApJL,844, L5
Lee, C.-F., Li, Z.-Y., Ching, T.-C., Lai, S.-P., & Yang, H. 2018,ApJ,854, 56
Nagai, H., Nakanishi, K., Paladino, R., et al. 2016,ApJ,824, 132
Piétu, V., Guilloteau, S., Di Folco, E., Dutrey, A., & Boehler, Y. 2014,A&A,
564, A95
Rao, R., Girart, J. M., Lai, S.-P., & Marrone, D. P. 2014,ApJL,780, L6
Rao, R., Girart, J. M., Marrone, D. P., Lai, S.-P., & Schnee, S. 2009,ApJ,707, 921
Rebull, L. M., Wolff, S. C., & Strom, S. E. 2004,AJ,127, 1029
Stephens, I. W., Looney, L. W., Kwon, W., et al. 2014,Natur,514, 597
Stephens, I. W., Yang, H., Li, Z.-Y., et al. 2017,ApJ,851, 55
Tazaki, R., Lazarian, A., & Nomura, H. 2017,ApJ,839, 56
Testi, L., Bacciotti, F., Sargent, A. I., Ray, T. P., & Eislöffel, J. 2002,A&A,
394, L31
Yang, H., Li, Z.-Y., Looney, L., & Stephens, I. 2016,MNRAS,456, 2794
Yang, H., Li, Z.-Y., Looney, L. W., Girart, J. M., & Stephens, I. W. 2017, MNRAS,472, 373
Figure 5.Panel(a): observed polarization angles (green), with superposed a model polarization pattern in which the vectors lie parallel to the minor axis (blue) for radii smaller than a given r=R, while at larger radii the vectors lie along the azimuthal angle (red). Here R=0 33 has been adopted, as the value that minimizes the combined standard deviation(panel (b)) of the differences between the observed polarization angles and those in the model. Contours in panel (a) represent total intensity, from 20 to 180 mJy beam−1in steps of 40 mJy beam−1.